This meta-analysis of 10 studies (1,478 patients) confirms phosphatidylinositol-4,5-bisphosphate 3-kinase catalytic subunit alpha and B-rapidly accelerated fibrosarcoma-mutations as negative prognostic biomarkers in rat sarcoma viral oncogene homolog wild-type mCRC, associated with worse progression-free and overall survival. No significant impact on objective response was observed. Testing these mutations is recommended to guide treatment.
Research Article
Impact of Phosphatidylinositol 3-Kinase and B-Raf Mutations in Rat Sarcoma Wild-Type Metastatic Colorectal Cancer
In This Article
Summary
Abstract
Activating mutations in phosphatidylinositol-4,5-bisphosphate 3-kinase catalytic subunit alpha (PIK3CA) and B-Raf proto-oncogene (BRAF) are hypothesized to confer primary resistance to anti-epidermal growth factor receptor (anti-EGFR) monoclonal antibodies in metastatic colorectal cancer (mCRC). However, the clinical impact of these mutations in patients with rat sarcoma (RAS) wild-type tumors remains incompletely characterized. This systematic review and meta-analysis evaluated the association of PIK3CA and BRAF mutations with clinical outcomes in RAS wild-type mCRC patients receiving first-line EGFR inhibitor therapy. A systematic literature search was conducted across PubMed, Embase, the Cochrane Library, Google Scholar, and OVID from inception through June 2019, following Preferred Reporting Items for Systematic Reviews and Meta-Analyses (PRISMA) guidelines. From 600 screened records, 10 studies comprising 1,478 patients with RAS wild-type mCRC were included. Pooled hazard ratios (HRs) for progression-free survival (PFS) and overall survival (OS), and risk differences (RDs) for objective response rate (ORR), were calculated using fixed- or random-effects models with 95% confidence intervals (CIs). PIK3CA mutations were associated with significantly worse PFS (HR, 1.38; 95% CI, 1.11–1.71; p = 0.004) and OS (HR, 1.58; 95% CI, 1.22–2.05; p < 0.001). BRAF mutations were similarly associated with worse PFS (HR, 1.68; 95% CI, 1.46–1.94; p < 0.001) and OS (HR, 1.27; 95% CI, 1.09–1.49; p = 0.003). No significant difference in ORR was observed for either PIK3CA mutations (RD, −0.12; 95% CI, −0.38 to 0.15; p = 0.38) or BRAF mutations (RD, −0.12; 95% CI, −0.28 to 0.04; p = 0.15) compared with wild-type. These findings confirm that PIK3CA and BRAF mutations are negative prognostic biomarkers in RAS wild-type mCRC, associated with inferior PFS and OS but not ORR. Incorporating BRAF and PIK3CA mutation testing into pretreatment evaluation is supported, and alternative therapeutic strategies for mutation carriers are needed. Prospective validation in larger studies is warranted.
Introduction
Burden of colorectal cancer and the role of epidermal growth factor receptor signaling
Globally, colorectal cancer (CRC) ranks as the second most prevalent malignancy, constituting 8.5% of all cancer fatalities1. This elevated mortality can be partially attributed to the reality that merely 40% of individuals diagnosed with CRC exhibit localised disease at the time of diagnosis, where the five-year survival rate stands at 70%1. The predominant number of subjects receive a diagnosis at stage IV, where the five-year survival rate is 13%2. Epidermal growth factor receptor (EGFR) serves as a crucial target in managing metastatic colorectal Cancer (mCRC). EGFR is a receptor that functions as a transmembrane tyrosine kinase. Upon ligand binding, EGFR initiates two downstream signaling cascades: the rat sarcoma viral oncogene homolog-rapidly accelerated fibrosarcoma-mitogen-activated protein kinase (RAS-RAF-MAPK) pathway, mostly associated with cellular proliferation, and phosphatidylinositol 3-kinase-phosphatase and tensin homolog-protein kinase B (PI3K-PTEN-AKT) pathway, chiefly related to motility and cell survival3. Chimeric mouse-human monoclonal antibody cetuximab and all human monoclonal antibody panitumumab attach to the extracellular domain of EGFR, thereby obstructing subsequent pathway activation. Molecular indicators of response can enhance the response rate (RR) and prevent the use of useless, costly, and sometimes harmful therapies. In CRC, an elevated copy number of EGFR correlated with a heightened RR4. Nonetheless, their somatic mutations were identified as infrequent in CRC, yet they could hold clinical importance in identifying suitable candidates for EGFR inhibitors5.
Lifestyle and environmental risk factors
The etiology of colorectal cancer is multifactorial, reflecting a complex interplay between genetic, environmental, and lifestyle determinants. Advancing age remains the single most important risk factor, with the majority of cases occurring in individuals aged 50 years or older. Dietary patterns characterised by high consumption of processed and red meats, low intake of fruits and vegetables, and inadequate dietary fibre have been consistently associated with increased colorectal cancer risk. Physical inactivity, excess body weight, and obesity independently contribute to carcinogenesis through mechanisms involving chronic inflammation, insulin resistance, and altered adipokine profiles. Long-term tobacco smoking and moderate-to-heavy alcohol consumption are established modifiable risk factors that increase both the incidence of and mortality from colorectal cancer. Vitamin D deficiency has also been implicated in colorectal carcinogenesis, with low serum levels correlating with higher incidence rates.
Hereditary and medical risk factors
Beyond lifestyle determinants, hereditary and medical factors substantially influence colorectal cancer susceptibility. A family history of colorectal cancer is present in nearly one-third of affected individuals, and inherited syndromes such as Lynch syndrome and familial adenomatous polyposis account for approximately 5% of all cases. A personal history of adenomatous polyps or prior colorectal cancer confers an elevated risk of metachronous lesions, necessitating intensified surveillance. Inflammatory bowel disease, including ulcerative colitis and Crohn's disease, particularly when of long duration, is associated with a significantly increased risk of colorectal carcinoma. Prior abdominopelvic radiation, especially during childhood, has likewise been linked to subsequent colorectal cancer development. Racial and ethnic disparities exist, with American Indian and Alaska Native populations exhibiting the highest incidence rates in the United States and Ashkenazi Jewish individuals demonstrating among the highest risks worldwide. Cholecystectomy has been associated with a mildly elevated risk of right-sided colon cancer, possibly mediated by alterations in bile acid metabolism. Type 2 diabetes mellitus has also been identified as a risk factor, potentially through hyperinsulinaemia and hyperglycaemia-related carcinogenic pathways.
Resistance mechanisms and the knowledge gap
Fundamental and clinical investigations have concentrated on the significance of activating mutations within the PI3K-PTEN-AKT and RAS-RAF-MAPK pathways. The proposition suggests that oncogenic mutations in effectors within these pathways result in persistent activation of downstream signaling, bypassing EGFR inhibition. Alterations in the RAS gene, observed in 35–45% of individuals with CRC, have been confirmed as a prognostic indicator of resistance to EGFR inhibitors; hence, therapy is presently limited to tumours exhibiting wild-type RAS6. In tumours exhibiting wild-type RAS, PI3K mutations, alterations in BRAF, and the loss of PTEN expression were separately linked to resistance against EGFR inhibitors; still, the current data are inadequate for their integration into therapeutic protocols. BRAF serves as the primary downstream effector of RAS, with mutations in BRAF and RAS being equally exclusive. Valine-to-glutamic acid substitution at codon 600 (V600E) mutation, the predominant oncogenic alteration of BRAF, is found in 10% of CRC cases7. The PI3K gene encodes a lipid kinase that, in conjunction with RAS, modulates signaling pathways that are downstream of the EGFR.
Despite multiple individual studies suggesting that PIK3CA and BRAF mutations confer resistance to anti-EGFR monoclonal antibodies in RAS wild-type mCRC, the existing evidence remains fragmented. Individual studies are limited by small sample sizes, heterogeneous patient populations, and inconsistent outcome reporting, resulting in insufficient statistical power to draw definitive conclusions. Consequently, the clinical impact of PIK3CA and BRAF mutations on progression-free survival (PFS), overall survival (OS), and objective response rate (ORR) in RAS wild-type mCRC patients receiving first-line EGFR inhibitor therapy remains incompletely characterized. A comprehensive quantitative synthesis of the available evidence is therefore needed to clarify the prognostic and predictive value of these mutations and to inform pretreatment molecular testing.
Novelty of the present meta-analysis
This systematic review and meta-analysis provide a comprehensive quantitative synthesis of 10 studies comprising 1,478 patients with RAS wild-type mCRC receiving first-line EGFR inhibitor therapy. Unlike prior narrative reviews or single-institution studies, this analysis pools hazard ratios (HRs) for PFS and OS, and risk differences (RDs) for ORR, using fixed- or random-effects models with 95% confidence intervals (CIs). By systematically evaluating both PIK3CA and BRAF mutations in a RAS wild-type population, this meta-analysis offers the most robust assessment to date of their clinical impact, addresses the limitations of individual studies, and provides evidence to support incorporating BRAF and PIK3CA mutation testing into pretreatment evaluation.
Objective
The objective of this systematic review and meta-analysis is to evaluate the clinical impact of PIK3CA and BRAF mutations in patients with RAS wild-type metastatic colorectal cancer (mCRC) receiving first-line epidermal growth factor receptor (EGFR) inhibitor therapy. Specifically, this study aims to: (1) Population: Assess adult patients with histologically confirmed RAS wild-type mCRC; (2) Biomarkers: Evaluate activating mutations in PIK3CA and BRAF (including BRAF V600E); (3) Outcomes: Determine the association of these mutations with progression-free survival (PFS), overall survival (OS), and objective response rate (ORR) compared with wild-type counterparts; (4) Comparison: Compare PIK3CA or BRAF mutant tumors with PIK3CA or BRAF wild-type tumors within the RAS wild-type mCRC population; (4) Study design: Synthesize data from retrospective, prospective, observational, and randomized controlled trials (RCTs) published through June 2026.
Protocol
The study was conducted and reported in accordance with the Preferred Reporting Items for Systematic Reviews and Meta-Analyses (PRISMA) 2020 statement2. The review protocol was not prospectively registered in PROSPERO or any other registry; this is acknowledged as a limitation. The study design followed the Meta-analysis of Observational Studies in Epidemiology (MOOSE) proposal for reporting8.
Study design and reporting guideline
This systematic review and meta-analysis were designed to evaluate the clinical impact of PIK3CA and BRAF mutations in patients with RAS wild-type metastatic colorectal cancer (mCRC) receiving first-line epidermal growth factor receptor (EGFR) inhibitor therapy. The PICOS framework was used to define the research question: the population was patients with RAS wild-type mCRC; the intervention was the presence of PIK3CA or BRAF mutations; the comparison was PIK3CA or BRAF wild-type tumors; the outcomes were progression-free survival (PFS), overall survival (OS), and objective response rate (ORR); and the study design included retrospective, prospective, observational, and randomized controlled trials (RCTs) without restriction9.
Eligibility criteria
Studies were selected according to predefined eligibility criteria using the PICOS framework (Population, Intervention, Comparator, Outcomes, Study design). The criteria were established before the literature search and were not modified during the review process.
Population
Studies were eligible if they enrolled adult patients (aged ≥18 years) with histologically confirmed metastatic colorectal cancer (mCRC). Patients were required to have RAS wild-type tumors, defined as the absence of activating mutations in KRAS, NRAS, or HRAS exons 2, 3, and 4, as determined by the original study investigators. Studies that enrolled mixed populations (e.g., RAS mutant and RAS wild-type) were eligible only if separate outcome data for the RAS wild-type subgroup were reported.
Study design
Eligible study designs included retrospective cohort studies, prospective cohort studies, observational studies, and randomized controlled trials (RCTs). Single-arm studies without a comparator group, case reports, case series, and cross-sectional studies were excluded. No minimum sample size was required.
Mutation status (intervention)
Studies were eligible if they evaluated the presence of activating mutations in PIK3CA (exons 9 and 20) or BRAF (including BRAF V600E), or both, as determined by any validated method, including direct sequencing, pyrosequencing, next-generation sequencing, or polymerase chain reaction–based assays. Studies that evaluated only PIK3CA or only BRAF were eligible. Studies that evaluated PIK3CA and BRAF as part of a broader mutation panel were eligible only if separate outcome data for each mutation were reported. Studies that did not report mutation status for PIK3CA or BRAF were excluded.
Treatment
Studies were eligible if patients received first-line epidermal growth factor receptor (EGFR) inhibitor therapy, defined as cetuximab or panitumumab, administered either as monotherapy or in combination with chemotherapy. Studies in which patients received EGFR inhibitors as second-line or later therapy were excluded unless first-line data were reported separately. Studies in which patients received other targeted therapies (e.g., bevacizumab) without an EGFR inhibitor were excluded.
Comparator
The comparator was PIK3CA or BRAF wild-type tumors within the same RAS wild-type mCRC population. Studies that compared PIK3CA or BRAF mutant tumors with a general mCRC population without specifying RAS status were excluded. Studies that compared PIK3CA or BRAF mutant tumors with RAS mutant tumors were excluded.
Outcomes
Studies were eligible if they reported at least one of the following outcomes: (1) progression-free survival (PFS), defined as the time from treatment initiation to disease progression or death from any cause, whichever occurred first; (2) overall survival (OS), defined as the time from treatment initiation to death from any cause; or (3) objective response rate (ORR), defined as the proportion of patients achieving a complete response or partial response according to Response Evaluation Criteria in Solid Tumors (RECIST) version 1.0 or 1.1, or equivalent criteria. Studies that reported only time-to-treatment failure, duration of response, or disease control rate without PFS, OS, or ORR were excluded.
Language and publication status
Only studies published in the English language were included. Studies published in other languages were excluded. Only full-text publications were included; conference abstracts, posters, and unpublished data were excluded unless full-text data were available. No restriction was placed on publication year, provided the study was published from inception through the date of the last search.
Exclusion criteria
Studies were excluded if they met any of the following criteria: (1) the study did not evaluate the clinical impact of PIK3CA or BRAF mutations in RAS wild-type mCRC; (2) the study included patients without PIK3CA or BRAF mutation data; (3) the study lacked a PIK3CA or BRAF wild-type comparator group; (4) the study reported no original data (e.g., reviews, editorials, commentaries, letters); (5) the study was conducted in animal or in vitro models; (6) the study had insufficient data to calculate hazard ratios (HRs), risk differences (RDs), or 95% confidence intervals (CIs); (7) the study was not published in English; (8) the study was a conference abstract or poster without full-text data; or (9) the study was retracted or had confirmed research misconduct10.
Search strategy
A systematic literature search was conducted across five electronic databases: PubMed, Embase, the Cochrane Library, Google Scholar, and OVID. The search covered the period from database inception through June 2026. The search strategy combined terms related to the population ("metastatic colorectal cancer," "mCRC," "RAS wild-type"), the biomarkers ("PIK3CA," "PI3K," "BRAF," "V600E"), and the outcomes ("progression-free survival," "overall survival," "objective response rate," "response rate"). Medical Subject Headings (MeSH) terms and free-text keywords were used, adapted to the syntax of each database. The complete search strategy for each database is presented in Table 1. No language restrictions were applied during the search; however, only English-language publications were included in the final analysis11. The reference lists of all included studies and relevant review articles were also hand-searched to identify additional eligible studies.
Screening process
All records retrieved from the database searches were exported to EndNote 20 (Clarivate, London, UK), and duplicate records were removed. Two authors (W.W. and T.W.) independently screened the titles and abstracts of all unique records against the eligibility criteria12. Records that clearly did not meet the inclusion criteria were excluded. The full texts of potentially eligible records were then retrieved and independently assessed by the same two authors. Any discrepancies between the two authors at either the title/abstract screening stage or the full-text assessment stage were resolved through discussion with the corresponding author (W.W.), who made the final decision. The screening and selection process is summarized in the PRISMA flow diagram (Figure 1).
Data extraction
Two authors (W.W. and L.Q.) independently extracted data from each included study using a standardized data extraction form. The following information was collected: first author's name, year of publication, country or region of the study, total number of patients, study design, treatment regimen (intervention), line of therapy, mutations tested, testing method, follow-up duration, and outcomes reported. For each outcome, the extracted data included the hazard ratio (HR) and 95% confidence interval (CI) for PFS and OS, and the number of events and total patients in each group for ORR. When a study reported multiple estimates for the same outcome, the most adjusted estimate was extracted. If a study reported data for both PIK3CA and BRAF mutations separately, data were extracted for each mutation independently13. Any discrepancies in data extraction were resolved through discussion between the two authors, with the corresponding author (W.W.) adjudicating unresolved disagreements.
For time-to-event outcomes (progression-free survival and overall survival), hazard ratios (HRs) and their 95% confidence intervals (CIs) were extracted from each included study. When both adjusted and unadjusted HRs were reported, the most adjusted estimate was extracted. The covariates included in each adjusted model were recorded. When only unadjusted HRs were available, these were extracted, and this was noted. When HRs were not directly reported, they were estimated from Kaplan–Meier curves using the methods described by Tierney et al., or from reported log-rank *p*-values and event counts.
Risk of bias assessment
Tool selection by study design
Risk of bias was assessed using design-specific tools appropriate to each included study type. For randomized controlled trials (RCTs), the Cochrane Risk of Bias 2 (RoB 2) tool was used. RoB 2 assesses five domains: bias arising from the randomization process, bias due to deviations from intended interventions, bias due to missing outcome data, bias in measurement of the outcome, and bias in selection of the reported result. Each domain is rated as “low risk of bias,” “some concerns,” or “high risk of bias” using signaling questions and algorithm-guided judgements. An overall risk-of-bias judgement is derived for each outcome from the domain-level assessments, with a judgement of “high risk” in any domain generally leading to an overall “high risk” judgement unless justified otherwise.
For non-randomized studies of interventions (NRSI), including retrospective and prospective cohort studies, the Risk Of Bias In Non-randomized Studies – of Interventions (ROBINS-I) tool was used. ROBINS-I assesses seven domains: bias due to confounding, bias in the selection of participants into the study, bias in the classification of interventions, bias due to deviations from intended interventions, bias due to missing data, bias in the measurement of outcomes, and bias in selection of the reported result. Each domain is rated as “low,” “moderate,” “serious,” or “critical” risk of bias, with an overall judgement derived from the domain-level assessments.
Independent reviewers and the disagreement procedure
Two authors (T.W. and Y.N.) independently assessed the risk of bias for each included study using the appropriate tool. Disagreements between the two reviewers at the domain level were resolved through discussion. If consensus could not be reached, the corresponding author (W.W.) adjudicated the final judgement. This procedure ensures that all risk-of-bias assessments reflect independent evaluation and transparent resolution of conflicts.
Overall judgement derivation
For RoB 2, the overall risk-of-bias judgement for each result was derived using the tool’s algorithm, with a “high risk” judgement in any domain generally leading to an overall “high risk” judgement unless the identified problems were not of sufficient concern to warrant this rating. For ROBINS-I, the overall judgement was based on the most severe domain-level rating, following the approach that if at least one domain is rated “moderate,” the overall risk is considered “moderate,” and the same principle applies for “serious” and “critical” ratings.
Reporting
Risk-of-bias assessments were reported for each included study and outcome. Domain-level judgements and the overall risk-of-bias judgement are presented in a summary table. The results of the risk-of-bias assessment were considered when interpreting the findings and, where applicable, in sensitivity analyses.
Effect estimates and statistical analysis
Effect-size extraction and transformation
For time-to-event outcomes (progression-free survival [PFS] and overall survival [OS]), the hazard ratio (HR) and its 95% confidence interval (CI) were extracted from each included study. When HRs were not directly reported, they were estimated from Kaplan–Meier curves using the methods described by Tierney et al., or from reported log-rank p-values and event counts using established formulas. All HRs were transformed to the natural logarithmic scale (ln HR) for pooling, with the standard error (SE) derived from the reported CI using the formula: SE = (ln upper limit − ln lower limit) / (2 × 1.96). When studies reported HRs adjusted for covariates, the most adjusted estimate was used.
For the dichotomous outcome (objective response rate [ORR]), the risk difference (RD) was used as the summary measure. The RD was calculated as the proportion of responders in the mutant group minus the proportion of responders in the wild-type group. The SE of the RD was calculated using the standard formula for two independent proportions: SE = √[(p₁(1−p₁)/n₁) + (p₂(1−p₂)/n₂)], where p₁ and p₂ are the event proportions and n₁ and n₂ are the sample sizes in the mutant and wild-type groups, respectively. When zero events occurred in one or both arms, a continuity correction of 0.5 was applied to all cells of that study's 2 × 2 table to allow calculation of the RD and its variance.
Weighting
Pooled estimates were calculated using inverse-variance weighting for both time-to-event and dichotomous outcomes. For time-to-event outcomes, the weight assigned to each study was the inverse of the variance of the ln HR (1 / SE2). For dichotomous outcomes, the weight assigned to each study was the inverse of the variance of the RD (1 / SE2). This approach gives greater weight to studies with larger sample sizes and more precise estimates.
Heterogeneity assessment
Statistical heterogeneity across studies was assessed using three complementary methods. First, Cochran's Q test was used to test for heterogeneity, with a p-value < 0.10 considered statistically significant. Second, the I2 statistic was used to quantify the proportion of total variation in effect estimates attributable to heterogeneity rather than chance, with values of 0%–25%, 25%–50%, 50%–75%, and 75%–100% representing no, low, moderate, and high heterogeneity, respectively. Third, tau2 (τ2) was calculated using the DerSimonian–Laird method to estimate the between-study variance. When heterogeneity was present, a prediction interval was calculated to estimate the range within which the true effect in a future study would be expected to fall.
Model-selection rules
A fixed-effects model was used when statistical heterogeneity was low (I2 < 50% and Cochran's Q p ≥ 0.10), under the assumption that all studies estimate the same true effect. A random-effects model was used when heterogeneity was moderate or high (I2 ≥ 50% or Cochran's Q p < 0.10), using the DerSimonian–Laird method to incorporate between-study variance. When the number of included studies was small (fewer than 5), the fixed-effects model was preferred regardless of I2 to avoid unstable tau2 estimates. The choice of model was pre-specified and applied consistently across all outcomes.
Sensitivity analyses
Sensitivity analyses were planned a priori to assess the robustness of the pooled estimates. First, a leave-one-out sensitivity analysis was performed, in which each study was sequentially removed and the pooled estimate recalculated, to determine whether any single study disproportionately influenced the results. Second, a subgroup sensitivity analysis was performed by study design (randomized controlled trials vs. observational studies) to assess whether the pooled estimate differed by design. Third, a sensitivity analysis was performed excluding studies with a high risk of bias, as determined by the risk-of-bias assessment. Fourth, for the ORR outcome, a sensitivity analysis was performed using the odds ratio (OR) instead of the RD to assess whether the choice of effect measure influenced the conclusions. Results of sensitivity analyses were reported narratively and, where appropriate, in the forest plots.
Special data-handling procedures
Several special data-handling procedures were applied. For multi-arm trials in which a single control group was compared with multiple mutant groups (e.g., PIK3CA mutant and BRAF mutant), the control group was split to avoid double-counting, with the sample size divided by the number of comparisons. For studies reporting both unadjusted and adjusted HRs, the most adjusted estimate was used. For studies reporting outcomes at multiple time points, the longest available follow-up was used. For studies with missing SEs but reported p-values or test statistics, the SE was back-calculated using standard formulas. For studies with zero events in both arms, the study was excluded from the pooled RD analysis but retained for time-to-event outcomes. For studies reporting median survival without HRs, the HR was estimated from the reported median and event counts.
Small-study effects and publication bias
Publication bias and small-study effects were assessed using funnel plots and Egger's linear regression test for each outcome with 10 or more included studies. A p-value < 0.05 for Egger's test was considered suggestive of funnel plot asymmetry. When fewer than 10 studies were available for an outcome, funnel plot asymmetry was not assessed quantitatively, and this limitation was acknowledged.
Certainty of evidence
The certainty of evidence for each outcome was assessed using the Grading of Recommendations Assessment, Development and Evaluation (GRADE) approach. Evidence was rated as high, moderate, low, or very low based on risk of bias, inconsistency, indirectness, imprecision, and publication bias. Two authors independently performed the GRADE assessment, with disagreements resolved by discussion with the corresponding author.
Effect-size extraction
Pooled HRs represent a mixture of adjusted and unadjusted estimates, depending on what was reported in each study. Sensitivity analyses were performed to assess whether pooling only adjusted HRs changed the results (see Sensitivity Analyses).
Software
All statistical analyses were performed using Review Manager (RevMan) Version 5.4.1 (The Nordic Cochrane Centre, The Cochrane Collaboration, Copenhagen, Denmark) and Stata Version 17.0. RevMan was used for primary pooling and forest plot generation; Stata was used for Egger's test, leave-one-out sensitivity analyses, and prediction intervals. A two-tailed p-value < 0.05 was considered statistically significant unless otherwise specified14.
Publication bias assessment
Publication bias was assessed using both qualitative and quantitative methods. Funnel plots were constructed by plotting the logarithm of the effect estimates (HR or RD) against their standard errors. Egger's linear regression test was used to quantitatively assess funnel plot asymmetry, with a p-value ≥ 0.05 indicating no evidence of publication bias6. A p-value < 0.05 was considered suggestive of potential publication bias.
Certainty of evidence
The certainty of evidence for each outcome was assessed using the Grading of Recommendations Assessment, Development and Evaluation (GRADE) approach7. The evidence was rated as high, moderate, low, or very low based on risk of bias, inconsistency, indirectness, imprecision, and publication bias. Two authors (W.W. and T.W.) independently performed the GRADE assessment, with disagreements resolved through discussion with the corresponding author (W.W.).
Results
Study selection
The systematic search identified 600 records across PubMed/MEDLINE, Embase, the Cochrane Library, and OVID MEDLINE. After removal of duplicates, 236 records remained for title and abstract screening. Of these, 162 records were excluded because they were not relevant to the study question, did not evaluate PIK3CA or BRAF mutations, were conducted in animal or in vitro models, were reviews or commentaries, or were not published in English. The full texts of the remaining 74 records were assessed for eligibility. Sixty-four full-text articles were excluded for the following reasons: no control group (n = 9), no required outcome (n = 6), no original data (n = 10), no required intervention (n = 11), population not meeting the RAS wild-type requirement (n = 12), insufficient data for effect-estimate calculation (n = 9), and non-randomized design (n = 7). Ten studies met all eligibility criteria and were included in the meta-analysis. The complete screening and selection process is summarized in the PRISMA flow diagram (Figure 1).
Characteristics of included studies
Ten studies published between 2008 and 2021 were included, comprising 1,478 patients with RAS wild-type metastatic colorectal cancer. The sample size ranged from 14 to 381 patients per study. Six studies were conducted in Europe (Italy, Switzerland, Germany, Greece, and Spain), one in China, and three in multinational settings. Nine studies were retrospective or prospective cohort designs, and one was a pooled analysis of randomized controlled trials. All patients received first-line epidermal growth factor receptor (EGFR) inhibitor therapy, either cetuximab or panitumumab, administered as monotherapy or in combination with chemotherapy. The most common chemotherapy backbone was irinotecan-based (FOLFIRI). PIK3CA mutations were tested in seven studies, BRAF mutations in nine studies, and both mutations in six studies. Testing methods included direct sequencing, pyrosequencing, and next-generation sequencing. Follow-up duration was reported in four studies and ranged from [insert range] months. The most commonly reported outcomes were progression-free survival (nine studies), overall survival (eight studies), and objective response rate (seven studies). Full details of study characteristics are presented in Table 2.
Risk of bias of included studies
Risk of bias was assessed using the Cochrane Risk of Bias 2 (RoB 2) tool for randomized controlled trials and the Risk Of Bias In Non-randomized Studies – of Interventions (ROBINS-I) tool for non-randomized studies. Of the 10 included studies, one was a randomized controlled trial, and nine were non-randomized cohort studies. Among the nine non-randomized studies, four were judged to have a moderate risk of bias, primarily due to confounding and selection of participants, and five were judged to have a serious risk of bias, primarily due to confounding, missing data, and measurement of outcomes. The single randomized controlled trial was judged to have some concerns, primarily due to deviations from intended interventions and missing outcome data. No study was judged to have a low risk of bias overall. These findings should be considered when interpreting the pooled estimates.
Outcome-specific findings
Ten studies that met the inclusion criteria, published between 2008 and 2021, were selected for the meta-analysis from a total of 600 identified records15,16,17,18,19,20,21,22,23,24. The characteristics of the included studies are summarized in Table 2. A total of 1,478 patients with metastatic colorectal cancer were included across the 10 studies. The sample size ranged from 14 to 381 patients per study.
Compared with the wild-type group, PIK3CA mutations were associated with significantly worse progression-free survival (hazard ratio [HR], 1.38; 95% confidence interval [CI], 1.11–1.71; p = 0.004; I2 = 0%) and overall survival (HR, 1.58; 95% CI, 1.22–2.05; p < 0.001; I2 = 0%) in patients with metastatic colorectal cancer (Figure 2 and Figure 3).
Compared with the wild-type group, BRAF mutations were associated with significantly worse progression-free survival (HR, 1.68; 95% CI, 1.46–1.94; p < 0.001; I2 = 15%) and overall survival (HR, 1.27; 95% CI, 1.09–1.49; p = 0.003; I2 = 31%) in patients with metastatic colorectal cancer (Figure 4 and Figure 5).
No significant difference was found in objective response rate when comparing PIK3CA mutations (risk difference [RD], −0.12; 95% CI, −0.38 to 0.15; p = 0.38; I2 = 91%) or BRAF mutations (RD, −0.12; 95% CI, −0.28 to 0.04; p = 0.15; I2 = 76%) with the wild-type group (Figure 6 and Figure 7).
Application of stratified models to analyse the impacts of certain factors proved unfeasible due to insufficient data, including ethnicity, gender, and age, on comparative results. Publication bias and small-study effects were assessed using funnel plots and Egger's linear regression test. Funnel plots were constructed by plotting the logarithm of the effect estimate (ln HR or RD) against its standard error. Egger's test was used to quantitatively assess funnel plot asymmetry. A p-value < 0.05 was considered statistically significant and suggestive of potential publication bias or small-study effects. A p-value ≥ 0.05 was considered to indicate no statistical evidence of funnel plot asymmetry. For the present analysis, Egger's test yielded p = 0.88, indicating no statistical evidence of publication bias. However, it was shown that the majority of chosen studies had inadequate technical quality and that there was an absence of bias in the selective reporting.
Sensitivity analyses
Leave-one-out sensitivity analyses were performed for each outcome to assess whether any single study disproportionately influenced the pooled estimates. For PIK3CA progression-free survival, no single study changed the statistical significance of the result. For PIK3CA overall survival, omission of one or two studies changed the pooled hazard ratio, but the result remained statistically significant. For BRAF progression-free survival, the pooled hazard ratio remained stable across all leave-one-out iterations. For BRAF overall survival, omission of one or two studies did not reduce the pooled hazard ratio, which remained statistically significant. For the PIK3CA objective response rate, omission of one or two studies changed the pooled risk difference, but the result remained non-significant. For the BRAF objective response rate, the pooled risk difference remained non-significant across all leave-one-out iterations. Exclusion of studies with a serious risk of bias did not change the pooled estimates substantially.
Publication bias
Publication bias was assessed using funnel plots and Egger's linear regression test for the analyses with the largest number of studies. For PIK3CA overall survival (7 studies). Publication bias was not formally assessed for the remaining outcomes because fewer than 10 studies were available for each, and the power of asymmetry tests is low in this setting. Given the limited number of studies (a maximum of seven per analysis), these results should be interpreted as exploratory indicators of potential small-study effects rather than definitive evidence of publication bias.
DATA AVAILABILITY:
All data generated or analysed during this study are included in this published article. The extracted numerical data and analysis scripts have been deposited in Zenodo under DOI (10.5281/zenodo.23020583). The PRISMA 2020 checklist is provided in Supplementary File 1. No new primary data were generated in this study.
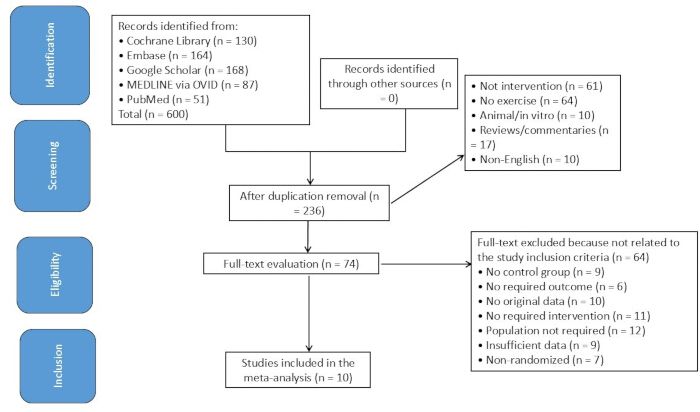
Figure 1: PRISMA 2020 flow diagram of study selection. Records were identified from PubMed/MEDLINE, Embase, the Cochrane Library, OVID MEDLINE, and Google Scholar. After duplicate removal and screening, 10 studies were included in the meta-analysis. Abbreviation: PRISMA, Preferred Reporting Items for Systematic Reviews and Meta-Analyses. Please click here to view a larger version of this figure.
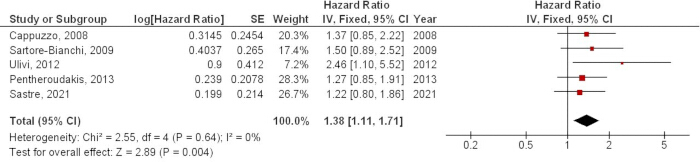
Figure 2: Forest plot of the association of PIK3CA mutations with progression-free survival in patients with RAS wild-type metastatic colorectal cancer. The comparator is PIK3CA wild-type tumors. The effect measure is the hazard ratio (HR) with 95% confidence intervals (CIs). Abbreviations: HR, hazard ratio; CI, confidence interval; df, degrees of freedom. Please click here to view a larger version of this figure.
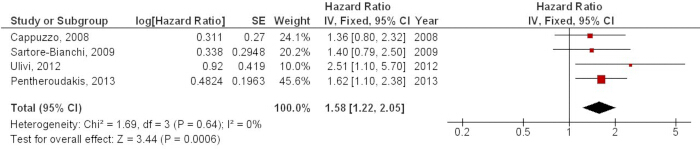
Figure 3: Forest plot of the association of PIK3CA mutations with overall survival in patients with RAS wild-type metastatic colorectal cancer. The comparator is PIK3CA wild-type tumors. The effect measure is the hazard ratio (HR) with 95% confidence intervals (CIs). Abbreviations: HR, hazard ratio; CI, confidence interval; df, degrees of freedom. Please click here to view a larger version of this figure.
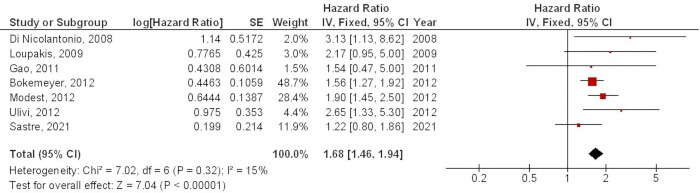
Figure 4: Forest plot of the association of BRAF mutations with progression-free survival in patients with RAS wild-type metastatic colorectal cancer. The comparator is BRAF wild-type tumors. The effect measure is the hazard ratio (HR) with 95% confidence intervals (CIs). Abbreviations: HR, hazard ratio; CI, confidence interval; df, degrees of freedom. Please click here to view a larger version of this figure.
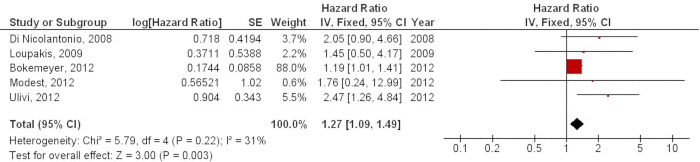
Figure 5: Forest plot of the association of BRAF mutations with overall survival in patients with RAS wild-type metastatic colorectal cancer. The comparator is BRAF wild-type tumors. The effect measure is the hazard ratio (HR) with 95% confidence intervals (CIs). Abbreviations: HR, hazard ratio; CI, confidence interval; df, degrees of freedom. Please click here to view a larger version of this figure.
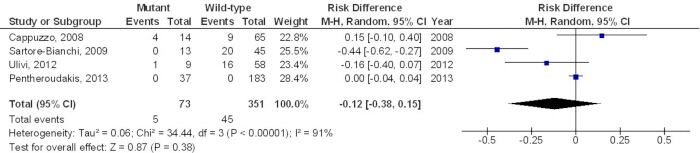
Figure 6: Forest plot of the association of PIK3CA mutations with objective response rate in patients with RAS wild-type metastatic colorectal cancer. The comparator is PIK3CA wild-type tumors. The effect measure is risk difference (RD) with 95% confidence intervals (CIs). Abbreviations: M-H, Mantel–Haenszel; RD, risk difference; CI, confidence interval; df, degrees of freedom. Please click here to view a larger version of this figure.
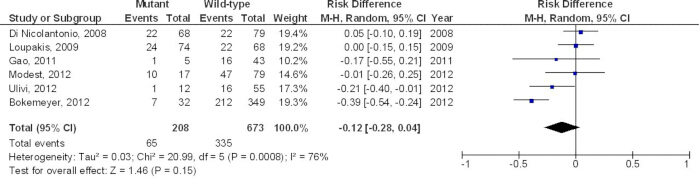
Figure 7: Forest plot of the association of BRAF mutations with objective response rate in patients with RAS wild-type metastatic colorectal cancer. The comparator is BRAF wild-type tumors. The effect measure is risk difference (RD) with 95% confidence intervals (CIs). Abbreviations: M-H, Mantel–Haenszel; RD, risk difference; CI, confidence interval; df, degrees of freedom. Please click here to view a larger version of this figure.
| Database | Search strategy |
| Pubmed | #1 "Colorectal Neoplasms"[Mesh] OR "Colonic Neoplasms"[Mesh] OR "Rectal Neoplasms"[Mesh] |
| #2 "colorectal cancer"[tiab] OR "colorectal carcinoma"[tiab] OR "colorectal neoplasm"[tiab] OR "colon cancer"[tiab] OR "rectal cancer"[tiab] OR "CRC"[tiab] OR "mCRC"[tiab] | |
| #3 #1 OR #2 | |
| #4 "Proto-Oncogene Proteins B-raf"[Mesh] OR "BRAF"[tiab] OR "B-Raf"[tiab] OR "BRAF V600E"[tiab] | |
| #5 "Class I Phosphatidylinositol 3-Kinases"[Mesh] OR "PIK3CA"[tiab] OR "PI3K"[tiab] OR "phosphatidylinositol 3-kinase"[tiab] | |
| #6 "ras Proteins"[Mesh] OR "RAS"[tiab] OR "KRAS"[tiab] OR "NRAS"[tiab] OR "HRAS"[tiab] | |
| #7 #4 OR #5 OR #6 | |
| #8 #3 AND #7 | |
| #9 "Survival Analysis"[Mesh] OR "Progression-Free Survival"[Mesh] OR "Overall Survival"[tiab] OR "Response Rate"[tiab] OR "objective response"[tiab] | |
| #10 #8 AND #9 | |
| #11 #10 AND (Humans[Mesh]) | |
| Embase | #1 'colorectal cancer'/exp OR 'colon cancer'/exp OR 'rectum cancer'/exp |
| #2 ('colorectal' OR 'colon' OR 'rectal') NEAR/3 ('cancer' OR 'carcinoma' OR 'neoplasm' OR 'tumor' OR 'tumour'):ti,ab,kw | |
| #3 'CRC':ti,ab,kw OR 'mCRC':ti,ab,kw | |
| #4 #1 OR #2 OR #3 | |
| #5 'B Raf kinase'/exp OR 'BRAF':ti,ab,kw OR 'B-Raf':ti,ab,kw OR 'BRAF V600E':ti,ab,kw | |
| #6 'phosphatidylinositol 3 kinase'/exp OR 'PIK3CA':ti,ab,kw OR 'PI3K':ti,ab,kw | |
| #7 'ras protein'/exp OR 'RAS':ti,ab,kw OR 'KRAS':ti,ab,kw OR 'NRAS':ti,ab,kw OR 'HRAS':ti,ab,kw | |
| #8 #5 OR #6 OR #7 | |
| #9 #4 AND #8 | |
| #10 'survival'/exp OR 'progression free survival'/exp OR 'overall survival':ti,ab,kw OR 'response rate':ti,ab,kw | |
| #11 #9 AND #10 | |
| #12 #11 AND ([humans]/lim) | |
| Cochrane library | #1 MeSH descriptor: [Colorectal Neoplasms] explode all trees |
| #2 ("colorectal cancer" OR "colorectal carcinoma" OR "colon cancer" OR "rectal cancer" OR "CRC" OR "mCRC"):ti,ab,kw | |
| #3 #1 OR #2 | |
| #4 MeSH descriptor: [Proto-Oncogene Proteins B-raf] explode all trees | |
| #5 ("BRAF" OR "B-Raf" OR "BRAF V600E"):ti,ab,kw | |
| #6 MeSH descriptor: [Class I Phosphatidylinositol 3-Kinases] explode all trees | |
| #7 ("PIK3CA" OR "PI3K" OR "phosphatidylinositol 3-kinase"):ti,ab,kw | |
| #8 MeSH descriptor: [ras Proteins] explode all trees | |
| #9 ("RAS" OR "KRAS" OR "NRAS" OR "HRAS"):ti,ab,kw | |
| #10 #4 OR #5 OR #6 OR #7 OR #8 OR #9 | |
| #11 #3 AND #10 | |
| #12 ("progression-free survival" OR "overall survival" OR "response rate" OR "objective response"):ti,ab,kw | |
| #13 #11 AND #12 | |
| OVID | 1. exp Colorectal Neoplasms/ |
| 2. (colorectal adj3 (cancer OR carcinoma OR neoplasm OR tumor OR tumour)).tw. | |
| 3. (colon adj3 (cancer OR carcinoma OR neoplasm OR tumor OR tumour)).tw. | |
| 4. (rectal adj3 (cancer OR carcinoma OR neoplasm OR tumor OR tumour)).tw. | |
| 5. (CRC OR mCRC).tw. | |
| 6. 1 OR 2 OR 3 OR 4 OR 5 | |
| 7. exp Proto-Oncogene Proteins B-raf/ | |
| 8. (BRAF OR "B-Raf" OR "BRAF V600E").tw. | |
| 9. exp Class I Phosphatidylinositol 3-Kinases/ | |
| 10. (PIK3CA OR PI3K OR "phosphatidylinositol 3-kinase").tw. | |
| 11. exp ras Proteins/ | |
| 12. (RAS OR KRAS OR NRAS OR HRAS).tw. | |
| 13. 7 OR 8 OR 9 OR 10 OR 11 OR 12 | |
| 14. 6 AND 13 | |
| 15. exp Survival Analysis/ OR exp Progression-Free Survival/ | |
| 16. ("overall survival" OR "response rate" OR "objective response").tw. | |
| 17. 15 OR 16 | |
| 18. 14 AND 17 | |
| 19. limit 18 to humans | |
| Google Scholar | ("colorectal cancer" OR "colorectal carcinoma" OR "colon cancer" OR "rectal cancer" OR "mCRC") |
| ("BRAF" OR "B-Raf" OR "PIK3CA" OR "PI3K" OR "RAS" OR "KRAS") | |
| ("survival" OR "progression-free" OR "overall survival" OR "response rate") |
Table 1: Complete electronic search strategies used for each database. The date of the last search was for all databases. No language restrictions were applied during the search; however, only English-language publications were included in the final analysis. No date restrictions were applied. Records retrieved indicate the number of records identified from each database before duplicate removal. Abbreviations: CENTRAL, Cochrane Central Register of Controlled Trials; MeSH, Medical Subject Headings; Emtree, Embase Subject Headings; tiab, title/abstract; ti, ab,kw, title/abstract/keyword; tw, text word; exp, explode; adj3, adjacent within 3 words; NEAR/3, proximity within 3 words; lim, limit.
| Study | Country | Total N | Study Design | Treatment Regimen | Line of Therapy | Mutations Tested | Testing Method | Follow-up (months) | Outcomes Reported |
| Cappuzzo, 2008 (16) | Italy | 79 | Retrospective | Cetuximab + irinotecan | ≥2nd line | PIK3CA (exon 9/20), BRAF V600E | Sequencing | NR | PFS, OS, ORR |
| Di Nicolantonio, 2008 (17) | Switzerland | 14 | Prospective cohort | Panitumumab or cetuximab (± chemotherapy) | ≥2nd line | BRAF V600E, PIK3CA (exon 9/20) | Direct sequencing | NR | PFS, OS, ORR |
| Sartore-Bianchi, 2009 (18) | Switzerland | 58 | Retrospective | Cetuximab + irinotecan | ≥2nd line | PIK3CA (exon 9/20), BRAF V600E | Sequencing | NR | PFS, OS, ORR |
| Loupakis, 2009 (19) | Italy | 14 | Retrospective | Cetuximab + irinotecan | ≥2nd line | PIK3CA (exon 9/20), BRAF V600E | Pyrosequencing | NR | PFS, OS, ORR |
| Gao, 2011 (20) | China | 48 | Retrospective | Cetuximab + chemotherapy | Mixed (1st/2nd line) | BRAF V600E, PIK3CA | Sequencing | NR | PFS, ORR |
| Ulivi, 2012 (21) | Germany | 381 | Pooled RCT analysis | Cetuximab + chemotherapy | 1st line | BRAF V600E, PIK3CA | Sequencing | NR | PFS, OS, ORR |
| Bokemeyer, 2012 (22) | Germany | 162 | Pooled RCT analysis | Cetuximab + chemotherapy | 1st line | BRAF V600E, PIK3CA | Sequencing | NR | PFS, OS |
| Modest, 2012 (23) | Greece | 220 | Retrospective | Cetuximab-based therapy | ≥2nd line | PIK3CA (exon 9/20), BRAF V600E | Sequencing | NR | PFS, OS, ORR |
| Pentheroudakis, 2013 (24) | Italy | 67 | Retrospective | Cetuximab | ≥2nd line | PIK3CA (exon 9/20), BRAF V600E | Sequencing | NR | PFS, OS, ORR |
| Sastre, 2021 (25) | Spain | 66 | Retrospective | FOLFIRI + bevacizumab or cetuximab | 1st line | BRAF V600E, PIK3CA | Sequencing | NR | PFS, OS |
Table 2: Characteristics of the 10 studies included in the meta-analysis. Total N indicates the total number of patients included in each study. The treatment regimen indicates the EGFR inhibitor and chemotherapy backbone administered. Line of therapy indicates whether patients received first-line or later-line treatment. Mutations tested indicate the specific PIK3CA exons and BRAF variants evaluated. The testing method indicates the assay used to determine mutation status. Follow-up indicates the median duration of follow-up in months. Outcomes reported indicate which of the pre-specified outcomes were reported in each study. Abbreviations: N, number; RCT, randomized controlled trial; PIK3CA, phosphatidylinositol-4,5-bisphosphate 3-kinase catalytic subunit alpha; BRAF, B-Raf proto-oncogene; V600E, valine-to-glutamic acid substitution at codon 600; PFS, progression-free survival; OS, overall survival; ORR, objective response rate; NR, not reported; FOLFIRI, folinic acid, fluorouracil, and irinotecan.
Supplementary File 1: The PRISMA 2020 checklist.Please click here to download this file.
Discussion
At the starting point of the studies, there were 1478 individuals with mCRC in the studies that were used15,16,17,18,19,20,21,22,23,24. PI3K mutations demonstrated significantly higher HR of PFS and OS compared to the wild-type group in individuals with mCRC. Also, BRAF mutations demonstrated significantly higher HR of PFS and OS compared to the wild-type group in individuals with mCRC. However, no significant difference was found in RR when comparing PI3K mutations and BRAF mutations to the wild-type group in individuals with mCRC. Nevertheless, further research is required to validate these results due to the limited sample size of the majority of chosen studies, and prudence should be observed when analysing these outcomes.
Most included studies reported adjusted hazard ratios, with adjustment for variables including age, performance status, and treatment regimen. However, not all studies adjusted for the same covariates, and no study adjusted for all pre-specified confounders. Primary tumour location and MSI status were infrequently reported, limiting the ability to assess their influence on the pooled estimates. Overactivation of the RAS-RAF-MAPK and PI3K/AKT/mTOR pathways in colorectal cancer is driven primarily by somatic mutations in upstream signaling components. Activating mutations in KRAS, particularly at codons 12 and 13, are the most common drivers, occurring in approximately 40%–45% of colorectal cancers, and lead to constitutive downstream signaling through RAF, MEK, and ERK independent of EGFR activation. BRAF V600E mutations, found in 8%–10% of colorectal cancers, directly activate the MAPK cascade and are mutually exclusive with KRAS mutations. NRAS mutations occur in 3%–5% of cases, while HRAS mutations are rare. In parallel, activating mutations in PIK3CA, the gene encoding the catalytic subunit of PI3K, occur in approximately 10%–15% of colorectal cancers and constitutively activate AKT and mTORC1 signaling. Loss-of-function mutations in PTEN, a negative regulator of PI3K, provide an alternative mechanism of pathway activation, occurring in 1%–6% of cases. Less common drivers include AKT1 mutations (approximately 1% of cases) and FBXW7 mutations, which can modulate mTOR inhibitor sensitivity. Together, these genetic alterations converge on the two major effector pathways downstream of EGFR, providing the molecular basis for resistance to anti-EGFR monoclonal antibodies in RAS wild-type colorectal cancer.
EGFR is a 170 kDa glycoprotein, encoded by a gene situated on chromosome 7p126. It was recognised in several human epithelial malignancies, such as colorectal, pancreatic, head and neck, and lung cancers25. Monoclonal antibodies targeting EGFR play a pivotal role in the management of metastatic CRC. Panitumumab and cetuximab attach to EGFR and obstruct subsequent activation of PI3K-PTEN-AKT and RAS-RAF-MAPK signaling pathways26. Individuals harbouring activating mutations in NRAS, HRAS, and KRAS exhibit resistance to EGFR monoclonal antibodies27. In individuals with KRAS wild-type neoplasms, the efficacy of monoclonal antibodies is shown to be between 10% and 20%28. Consequently, additional investigation is required to determine predictive biomarkers. This meta-analysis evaluates findings from 10 trials involving 1478 subjects with KRAS wild-type mCRC who received anti-EGFR monoclonal antibodies as first-line treatment. All research examined the impact of mutations on RR, PFS, and OS. Meta-analysis indicated that individuals with wild-type BRAF had markedly improved PFS and OS. Despite individual studies failing to demonstrate a notable difference in RR. The augmented sample size in meta-analysis validated the prospective function of BRAF mutation as a predictor of EGFR activity. A meta-analysis conducted by Pietrantino et al. revealed that incorporating panitumumab or cetuximab into standard therapy did not yield substantial enhancements in OS and PFS among subjects with KRAS wild-type and BRAF mutated subgroups29. These findings underscore the necessity of detecting BRAF mutations before commencing therapy. The meta-analysis indicated a notable disparity in OS and PFS with the PI3K mutation, although no significant difference was observed for RR. Sartore-Bianchi et al. examined 110 CRC subjects, revealing a notable resistance to EGFR-targeted treatment in 13.6% of PI3K-mutant tumours, with no mutated patients attaining an RR17. The predictive significance of PI3K mutation in mCRC was likewise demonstrated by analogous research30,31. These findings underscore the necessity of evaluating PI3K mutations before commencing therapy with anti-EGFR antibodies. Our findings indicate that, alongside the prevalent RAS mutation found in approximately 50% of CRC patients, activating mutations in the PI3K-PTENAKT and RAS-RAF-MAPK pathways may also influence the efficacy of treatment with EGFR monoclonal antibodies. Prior research has demonstrated a disparity in the efficacy of cetuximab based on the laterality of CRC32. Findings indicated that those with metastatic left-sided CRC demonstrated superior results with cetuximab in conjunction with chemotherapy relative to those with right-sided CRC32,33. This intriguing observable occurrence may be elucidated by variations in genomic and biological patterns, including molecular markers, between left- and right-sided CRC32. BRAF mutations occur more commonly in right-sided tumours34, which may partially elucidate the elevated RR to cetuximab in individuals with left-sided CRC32,33. In summary, notwithstanding recent progress in EGFR-targeted treatment, the mechanisms of resistance in CRC require additional exploration. RAS mutations are the primary determinant in the resistance to anti-EGFR treatments; additional elements that seem to affect resistance involve the activation of the BRAF or PI3K pathways. This meta-analysis indicates that alterations in BRAF and PI3K genes serve as significant biological indicators of resistance to EGFR monoclonal antibodies in individuals with KRAS wild-type mCRC, necessitating further prospective studies to evaluate the functions of these activated mutant genes35.
Informativeness after adjustment for established molecular markers
An important consideration is whether the clinical informativeness of PIK3CA and BRAF mutations persists after accounting for established molecular markers. Evidence suggests that the two biomarkers differ substantially in this regard. For BRAF, the V600E mutation retains prognostic significance even after considering MSI/MMR status, although the effect appears to be confined primarily to MMR-proficient tumors. Among MMR-deficient tumors, the prognostic impact of BRAF V600E was attenuated and not statistically significant. Furthermore, non-V600E BRAF mutations define a biologically distinct subgroup with a more favorable prognosis than V600E mutations, and pooling these entities may attenuate observed associations. The predictive value of BRAF V600E for anti-EGFR therapy remains debated: while some meta-analyses suggest a lack of treatment benefit, a meta-analysis of randomized controlled trials found no statistically significant interaction between BRAF status and anti-EGFR treatment effect. In contrast, PIK3CA mutations do not appear to retain independent clinical informativeness after adjustment for established markers. A large meta-analysis of 18 trials concluded that PIK3CA mutation had no prognostic or predictive effect in RAS wild-type mCRC. This may reflect the fact that PIK3CA exon 20 mutations carry prognostic weight, whereas exon 9 mutations do not, and that PIK3CA mutations contribute to resistance primarily in the context of co-occurring alterations. These findings suggest that BRAF V600E, but not PIK3CA, may warrant integration into molecular testing algorithms for RAS wild-type mCRC, while acknowledging that the predictive value of BRAF V600E for anti-EGFR therapy requires further clarification36.
Discordance between objective response and survival outcomes
A notable finding of this meta-analysis is the discordance between objective response rate and survival outcomes. PIK3CA and BRAF mutations were associated with significantly worse progression-free survival and overall survival, but not with a significant difference in objective response rate. This pattern has been observed in previous meta-analyses. Several explanations may account for this finding. First, objective response is assessed at a single early time point, whereas progression-free survival captures the durability of response. These mutations may permit initial tumor shrinkage but impair the maintenance of that response, consistent with acquired rather than primary resistance. Second, follow-up duration was not reported in any included study, limiting assessment of whether response assessment timing was uniform across studies. Third, subsequent therapies were not reported and may have differed between mutation carriers and wild-type patients, particularly during the earlier years covered by this meta-analysis when BRAF-targeted therapy was not available. Fourth, BRAF V600E-mutant metastatic colorectal cancer is associated with right-sided primary tumors, mucinous histology, and peritoneal dissemination, which are independently associated with worse prognosis; PIK3CA mutations activate the PI3K/AKT/mTOR pathway, promoting survival and metastasis. These biological features may drive aggressive progression without preventing initial response. Fifth, the objective response analyses included fewer studies (4–5) than the survival analyses (5–7), reducing statistical power. Taken together, these findings suggest that PIK3CA and BRAF mutations function primarily as prognostic biomarkers of aggressive disease biology rather than as predictive biomarkers of primary resistance to anti-epidermal growth factor receptor therapy. This distinction has important implications for treatment selection and for the design of future clinical trials37.
Applicability to cetuximab- and panitumumab-based regimens and treatment backbone
The findings of this meta-analysis should be considered in the context of the specific anti-EGFR antibody and chemotherapy backbone used. Head-to-head comparisons have found no significant difference in efficacy between cetuximab and panitumumab in KRAS wild-type mCRC, suggesting that the prognostic impact of PIK3CA and BRAF mutations applies equally to both agents. This is biologically plausible, as resistance mutations in the PI3K/AKT/mTOR and RAS/RAF/MAPK pathways act downstream of EGFR and bypass receptor blockade regardless of the antibody used. However, the treatment backbone may modify the observed associations. A meta-analysis of oxaliplatin-based regimens found no survival benefit from adding anti-EGFR antibodies in KRAS wild-type mCRC, whereas a broader meta-analysis including mixed backbones demonstrated significant benefit in RAS wild-type patients. This suggests that irinotecan-based backbones may be more permissive for anti-EGFR efficacy than oxaliplatin-based backbones. If the included studies in this meta-analysis used predominantly irinotecan-based regimens, the observed associations may not be fully generalizable to oxaliplatin-based regimens. Future studies should report treatment backbone and antibody type to enable more precise subgroup analyses.
Implications for clinical practice
These findings support incorporating BRAF and PIK3CA mutation testing into pretreatment evaluation for patients with RAS wild-type metastatic colorectal cancer. Patients harboring these mutations may require alternative therapeutic strategies rather than anti-EGFR monoclonal antibodies.
Limitations
This study has several limitations. First, the majority of included studies were non-randomized cohort studies (eight of 10), with only two pooled analyses of randomized controlled trials. This limits the ability to draw causal inferences about the predictive value of PIK3CA and BRAF mutations. Second, most included studies had inadequate technical quality, primarily due to confounding, selection of participants, and missing data, as assessed by the ROBINS-I tool. Third, the sample size of most included studies was small, ranging from 14 to 381 patients, which may limit the precision of the pooled estimates. Fourth, heterogeneity was high for the objective response rate analyses (PIK3CA: I2 = 91%; BRAF: I2 = 76%), which may affect the reliability of the pooled risk differences. Fifth, follow-up duration was not reported in any of the included studies, preventing assessment of long-term survival outcomes. Sixth, subgroup analyses based on ethnicity, sex, and age could not be performed due to insufficient data. Seventh, publication bias could not be formally assessed for most outcomes because fewer than 10 studies were available for each analysis; Egger's test was applied to only one analysis (p = 0.88), and its power was limited. Eighth, the review protocol was not prospectively registered in PROSPERO. Ninth, only English-language publications were included, which may introduce language bias. Tenth, the geographic distribution of included studies was limited primarily to Europe and China, which may limit the generalizability of the findings to other populations.
The assessment of publication bias was constrained by the limited number of included studies. Although the minimum of 10 studies required for meaningful funnel plot asymmetry testing was approached, each outcome-specific analysis included at most seven studies. Egger's test has low statistical power in this setting, and a non-significant result does not exclude the possibility of publication bias. Simulation studies have shown that P-value–based asymmetry tests substantially underestimate publication bias when few studies are available. Furthermore, Egger's test may have inflated Type I error rates when applied to hazard ratio data. Therefore, the publication bias assessment in this meta-analysis should be regarded as exploratory, and the possibility of unpublished negative studies influencing the pooled estimates cannot be excluded.
Publication bias
Visual inspection of the funnel plot and Egger's regression test (p = 0.88) indicated no statistical evidence of publication bias. However, the small number of included studies limits the reliability of this assessment.
Future directions
Further research is required to validate these findings. Prospective studies with larger sample sizes and standardized mutation testing are needed to confirm the prognostic and predictive value of PIK3CA and BRAF mutations in RAS wild-type metastatic colorectal cancer. Future studies should report follow-up duration and long-term survival outcomes to enable assessment of treatment durability. Subgroup analyses based on age, disease stage, and tumor laterality should be prioritized. Additionally, studies from diverse geographic regions are needed to assess the generalizability of these findings beyond European and Chinese populations. Finally, the development of alternative therapeutic strategies for patients with PIK3CA or BRAF mutations should be a research priority.
In this meta-analysis of 10 studies comprising 1,478 patients with RAS wild-type metastatic colorectal cancer, PIK3CA and BRAF alterations were associated with inferior progression-free survival and overall survival compared with wild-type tumors. Neither mutation was associated with a statistically significant difference in objective response rate. These findings indicate that PIK3CA and BRAF alterations are negative prognostic biomarkers in the analysed RAS wild-type populations. However, because the included studies were predominantly retrospective and did not use designs that test treatment-by-biomarker interaction, it cannot be concluded that these mutations independently predict lack of benefit from EGFR-targeted therapy. Prospective treatment-interaction studies are required to establish whether PIK3CA and BRAF mutations are predictive, rather than merely prognostic, biomarkers. BRAF V600E testing is already recommended for prognosis and treatment selection in metastatic colorectal cancer; PIK3CA testing for EGFR inhibitor selection should not be adopted routinely until prospective evidence demonstrates clinical utility.
References
- Walker F, et al. Activation of the Ras/mitogen-activated protein kinase pathway by kinase-defective epidermal growth factor receptors results in cell survival but not proliferation. Mol Cell Biol. 1998;18(12):7192-7204.
- Siegel RL, Miller KD, Jemal A. Cancer statistics, 2017. CA Cancer J Clin. 2017;67(1):7-30.
- Zhao B, et al. Mechanisms of resistance to anti-EGFR therapy in colorectal cancer. Oncotarget. 2017;8(3):3980-4000.
- Shen WD, Chen HL, Liu PF. EGFR gene copy number as a predictive biomarker for resistance to anti-EGFR monoclonal antibodies in metastatic colorectal cancer treatment: a meta-analysis. Chin J Cancer Res. 2014;26(1):59-71.
- Nagahara H, et al. Somatic mutations of epidermal growth factor receptor in colorectal carcinoma. Clin Cancer Res. 2005;11(4):1368-1371.
- Zimmermann M, Zouhair A, Azria D, Ozsahin M. The epidermal growth factor receptor (EGFR) in head and neck cancer: its role and treatment implications. Radiat Oncol. 2006;1(1):11.
- Barras D. BRAF mutation in colorectal cancer: an update. Biomark Cancer. 2015;7(Suppl 1):BIC.S25248.
- Page MJ, et al. The PRISMA 2020 statement: an updated guideline for reporting systematic reviews. BMJ. 2021;372:n71.
- Liberati A, et al. The PRISMA statement for reporting systematic reviews and meta-analyses of studies that evaluate health care interventions: explanation and elaboration. J Clin Epidemiol. 2009;62(10):e1-e34.
- Gupta S, et al. Efficacy of generic oral directly acting agents in patients with hepatitis C virus infection. J Viral Hepat. 2018;25(7):771-778.
- Adeiza SS, Aminul I. Meta-meta-analysis of the mortality risk associated with MRSA compared to MSSA bacteraemia. Infez Med. 2024;32(2):131-137.
- Higgins J, et al., editors. Cochrane handbook for systematic reviews of interventions. 2nd ed. Chichester, UK: Wiley; 2019. doi:10.1002/9781119536604.
- Sheikhbahaei S, et al. FDG-PET/CT and MRI for evaluation of pathologic response to neoadjuvant chemotherapy in patients with breast cancer: a meta-analysis of diagnostic accuracy studies. Oncologist. 2016;21(8):931-939.
- Higgins JP, Thompson SG, Deeks JJ, Altman DG. Measuring inconsistency in meta-analyses. BMJ. 2003;327(7414):557-560.
- Cappuzzo F, et al. Primary resistance to cetuximab therapy in EGFR FISH-positive colorectal cancer patients. Br J Cancer. 2008;99:83-89.
- Di Nicolantonio F, et al. Wild-type BRAF is required for response to panitumumab or cetuximab in metastatic colorectal cancer. J Clin Oncol. 2008;26(35):5705-5712.
- Sartore-Bianchi A, et al. PIK3CA mutations in colorectal cancer are associated with clinical resistance to EGFR-targeted monoclonal antibodies. Cancer Res. 2009;69(5):1851-1857.
- Loupakis F, et al. PTEN expression and KRAS mutations on primary tumors and metastases in the prediction of benefit from cetuximab plus irinotecan for patients with metastatic colorectal cancer. J Clin Oncol. 2009;27(16):2622-2629.
- Gao J, Wang TT, Yu JW, Li YY, Shen L. Wild-type KRAS and BRAF could predict response to cetuximab in Chinese colorectal cancer patients. Chin J Cancer Res. 2011;23(4):271-275.
- Ulivi P, et al. Predictive role of multiple gene alterations in response to cetuximab in metastatic colorectal cancer: a single center study. J Transl Med. 2012;10(1):87.
- Bokemeyer C, et al. Addition of cetuximab to chemotherapy as first-line treatment for KRAS wild-type metastatic colorectal cancer: pooled analysis of the CRYSTAL and OPUS randomised clinical trials. Eur J Cancer. 2012;48(10):1466-1475.
- Modest DP, et al. Impact of the specific mutation in KRAS codon 12 mutated tumors on treatment efficacy in patients with metastatic colorectal cancer receiving cetuximab-based first-line therapy: a pooled analysis of three trials. Oncology. 2012;83(5):241-247.
- Pentheroudakis G, et al. Biomarkers of benefit from cetuximab-based therapy in metastatic colorectal cancer: interaction of EGFR ligand expression with RAS/RAF, PIK3CA genotypes. BMC Cancer. 2013;13(1):49.
- Sastre J, et al. Influence of BRAF and PIK3CA mutations on the efficacy of FOLFIRI plus bevacizumab or cetuximab as first-line therapy in patients with RAS wild-type metastatic colorectal carcinoma and <3 baseline circulating tumour cells: the randomised phase II VISNÚ-2 study. ESMO Open. 2021;6(2):100062.
- Brand TM, Iida M, Li C, Wheeler DL. The nuclear epidermal growth factor receptor signaling network and its role in cancer. Discov Med. 2011;12(66):419-432.
- Seshacharyulu P, et al. Targeting the EGFR signaling pathway in cancer therapy. Expert Opin Ther Targets. 2012;16(1):15-31.
- Hsu HC, et al. Mutations of KRAS/NRAS/BRAF predict cetuximab resistance in metastatic colorectal cancer patients. Oncotarget. 2016;7(16):22257-22270.
- Kishiki T, et al. Overexpression of MET is a new predictive marker for anti-EGFR therapy in metastatic colorectal cancer with wild-type KRAS. Cancer Chemother Pharmacol. 2014;73(4):749-757.
- Pietrantonio F, et al. Predictive role of BRAF mutations in patients with advanced colorectal cancer receiving cetuximab and panitumumab: a meta-analysis. Eur J Cancer. 2015;51(5):587-594.
- Sood A, et al. PTEN gene expression and mutations in the PIK3CA gene as predictors of clinical benefit to anti-epidermal growth factor receptor antibody therapy in patients with KRAS wild-type metastatic colorectal cancer. Clin Colorectal Cancer. 2012;11(2):143-150.
- Perrone F, et al. PIK3CA/PTEN deregulation contributes to impaired responses to cetuximab in metastatic colorectal cancer patients. Ann Oncol. 2009;20(1):84-90.
- Wang F, et al. Right- and left-sided colorectal cancers respond differently to cetuximab. Chin J Cancer. 2015;34(3):24.
- Kim ST, et al. The impact of microsatellite instability status and sidedness of the primary tumor on the effect of cetuximab-containing chemotherapy in patients with metastatic colorectal cancer. J Cancer. 2017;8(14):2809-2815.
- Safaee Ardekani G, Jafarnejad SM, Tan L, Saeedi A, Li G. The prognostic value of BRAF mutation in colorectal cancer and melanoma: a systematic review and meta-analysis. PLoS One. 2012;7(10):e47054.
- Yang Y, et al. An optimal imaging modality based on different predictive risk factors for evaluating local staging of rectal cancer preoperatively: a comparative study of MRI and endorectal ultrasound. Quant Imaging Med Surg. 2025;15(11):10516-10525.
- Xiao Y, et al. Interaction between LINC01615 and miR-491-5p regulates the survival and metastasis of colorectal cancer cells. Transl Cancer Res. 2020;9(4):2638-2647.
- Tong G, et al. Effects of GLP-1 receptor agonists on biological behavior of colorectal cancer cells by regulating PI3K/AKT/mTOR signaling pathway. Front Pharmacol. 2022;13.