This protocol describes a rapid and highly reproducible murine abdominal aortic aneurysm model established by perivascular sheath microinjection of chymotrypsin into the infrarenal aorta without vascular dissection. The technique achieves 100% aneurysm induction within 14 days with human-like histopathology, benchmarked against the conventional porcine pancreatic elastase topical application model.
Method Article
Mouse Abdominal Aortic Aneurysm Model Induced by Perivascular Sheath Microinjection of Chymotrypsin
In This Article
Summary
Abstract
Abdominal aortic aneurysm (AAA) is a life-threatening degenerative vascular disease for which no effective pharmacological therapy currently exists. Reliable and technically accessible animal models are essential for mechanistic and preclinical investigations. However, existing murine platforms are limited by technical complexity, prolonged operative time, or incomplete recapitulation of human AAA pathology. Here, this study presents a novel murine AAA model established by direct perivascular sheath microinjection of chymotrypsin. After midline laparotomy and identification of the infrarenal abdominal aorta, chymotrypsin working solution is injected directly into the perivascular sheath space under direct vision using a microscale needle. To determine the optimal enzyme concentration, a pilot dose-finding study was conducted using 0.125% (w/v; 1.25 mg/mL), 0.25% (w/v; 2.50 mg/mL), and 0.375% (w/v; 3.75 mg/mL) chymotrypsin (n = 5 per group), with PBS as negative control and topical PPE as positive control. Based on aneurysm incidence, aortic diameter progression, and mortality, 0.25% chymotrypsin was selected for the main study. The chymotrypsin group was directly compared with the PPE positive control group to benchmark the pathological features of this novel model. Serial Doppler ultrasonography confirmed a 100% aneurysm induction rate at day 14 in chymotrypsin-treated mice, whereas no dilation occurred in PBS-injected controls. Histological analyses revealed pronounced medial thickening, elastic fiber fragmentation, and collagen deposition, together with markedly elevated immunohistochemical expression of matrix metalloproteinase (MMP)-2 and MMP-9 in aortic sections. Quantitative morphometry demonstrated significant increases in aortic wall thickness and collagen volume fraction, and a corresponding reduction in elastic fiber content in chymotrypsin-treated animals compared with controls. This protocol thus provides a technically streamlined, highly reproducible, and translationally relevant murine AAA model. Because the procedure avoids aortic dissection, arteriotomy, or specialized microsurgical training, it is well suited to laboratories investigating aneurysm pathobiology or evaluating novel pharmacological interventions.
Introduction
Abdominal aortic aneurysm (AAA) is a progressive degenerative disease of the infrarenal aorta and a leading cause of cardiovascular mortality in older adults, with a global age-standardized mortality rate exceeding 3 per 100,000 population1,2. Despite advances in endovascular repair, no pharmacological therapy has been shown to arrest or reverse aneurysm progression, largely because the mechanisms underlying human AAA remain incompletely understood3,4. Key pathobiological features include transmural inflammation, matrix metalloproteinase (MMP)-mediated degradation of elastin and collagen, vascular smooth muscle cell (VSMC) apoptosis and phenotypic switching, and adverse extracellular matrix remodeling5,6. The overall goal of this method is to establish a rapid, technically simplified, and highly reproducible murine AAA model that faithfully recapitulates the histopathological features of human disease, thereby enabling mechanistic and preclinical therapeutic studies.
Widely used murine platforms include intraluminal porcine pancreatic elastase (PPE) infusion, peri-adventitial PPE application, angiotensin II (Ang II) infusion in apolipoprotein E-deficient (ApoE⁻/⁻) mice, and periaortic calcium chloride application7,8,9,10. Although each captures selected aspects of human AAA, all bear substantial technical or biological limitations. Intraluminal PPE infusion requires microsurgical arteriotomy, temporary aortic clamping, and full separation of the aorta from the inferior vena cava, resulting in considerable procedural complexity and perioperative mortality11,12. Peri-adventitial PPE application depends on prolonged topical enzyme incubation over the exposed aortic surface, which yields variable induction efficiency and prolonged operative time13,14. The Ang II model requires a hyperlipidemic background and frequently produces suprarenal dissection rather than a true infrarenal aneurysm15,16. Collectively, these constraints highlight the need for a model that combines high induction efficiency, procedural simplicity, and translational fidelity.
Chymotrypsin is a serine protease with broad substrate specificity, capable of cleaving aromatic and hydrophobic residues in structural proteins including elastin, collagen, and fibronectin17. Notably, mast cell–derived chymase — an endogenous chymotryptic enzyme functionally analogous to pancreatic chymotrypsin — is markedly upregulated in human AAA tissue, where it contributes to angiotensin II generation, VSMC apoptosis, and MMP activation18,19,20,21. However, pancreatic chymotrypsin and mast-cell chymase are distinct proteases with different substrate-recognition profiles, cellular origins, regulation, and physiological functions; shared chymotryptic activity should therefore be interpreted as functional analogy rather than biological or mechanistic equivalence. Accordingly, the rationale for this model is the controlled induction of localized proteolytic extracellular-matrix injury within the peri-adventitial compartment, rather than direct replication of mast-cell chymase biology. Nevertheless, compared with topical enzyme incubation, perivascular sheath microinjection delivers a defined volume of active enzyme directly into the peri-adventitial space, achieving uniform circumferential exposure while preserving vessel integrity and dramatically reducing operative time. Importantly, because the injection is performed under direct vision without dissection or separation of the aorta from surrounding tissues, the technique minimizes mechanical trauma and simplifies the workflow, making it accessible to laboratories with modest surgical expertise.
The present protocol is applicable to laboratories investigating AAA pathogenesis, inflammatory and proteolytic cascades, extracellular matrix remodeling, or novel pharmacological interventions. The model may not be suitable for studies specifically targeting hyperlipidemia-driven mechanisms or aortic dissection, for which the Ang II–ApoE⁻/⁻ model may be more appropriate. Also, it should not be assumed to model advanced atherosclerotic AAA or rupture without additional validation.
Protocol
All animal experiments described here were approved by the Institutional Animal Care and Use Committee of Fujian Medical University (approval number: IACUC FJMU 2024-Y-0907, approval date: March 8, 2024) and performed in accordance with the ARRIVE 2.0 guidelines (see Supplementary File 1).
1. Preparation of reagents and animals
- Purchase male C57BL/6J mice (8–12 weeks, 20–25 g). Acclimatize the animals for at least 7 days under specific pathogen–free conditions.
- Prepare the chymotrypsin working solution fresh on the day of surgery by dissolving chymotrypsin in sterile PBS to a final concentration of 0.25% (w/v; 2.5 mg/mL).
NOTE: The chymotrypsin preparation used had a specific activity of 1100 U/mg, yielding a final working activity of 2750 U/mL. - Filter the solution through a 0.22 µm syringe filter.
NOTE: Chymotrypsin is a proteolytic enzyme. Wear nitrile gloves, laboratory coat, and eye protection when handling. - Autoclave the surgical instruments including microscissors, tissue forceps, needle holder, and cotton applicators.
- Fast the mouse for 12 h with free access to water prior to surgery.
- Randomization, allocation concealment, and blinding
- Assign the animals to coded cages to conceal treatment allocation.
- Perform ultrasonographic examinations, ex vivo aortic measurements, histological staining, and image quantification with investigators blinded to group assignment.
- Retain the coding key until completion of the prespecified analyses.
- Pilot dose-finding study (n = 5 per group)
- Administer 100 µL of sterile PBS (perivascular sheath microinjection) as the negative control.
- Weigh chymotrypsin powder and dissolve it in sterile PBS to prepare a 0.375% (w/v; 3.75 mg/mL) stock solution. Mix 2 volumes of the 0.375% (w/v; 3.75 mg/mL) solution with 1 volume of sterile PBS to obtain the 0.25% (w/v; 2.5 mg/mL) working solution. Mix 1 volume of the 0.375% (w/v; 3.75 mg/mL) solution with 2 volumes of sterile PBS to obtain the 0.125% (w/v; 1.25 mg/mL) working solution. Administer 0.125% (w/v; 1.25 mg/mL), 0.25% (w/v; 2.5 mg/mL), or 0.375% (w/v; 3.75 mg/mL) chymotrypsin (100 µL, microinjection) for chymotrypsin dose-finding.
- Apply PPE-soaked gauze to the infrarenal aorta as the positive control. Soak a sterile cotton patch (3.0 × 5.0 mm) thoroughly with 100 µL of 9.7 mg/mL PPE. Gently wrap the PPE-soaked cotton patch circumferentially around the 1-cm segment of the infrarenal aorta proximal to the bifurcation, ensuring uniform contact with the vascular adventitia for 30 min. After incubation, rinse the abdominal cavity twice with sterile saline to remove any residual PPE.
- Main study (n = 25 per group)
- Administer 100 µL of sterile PBS by perivascular sheath microinjection to animals in the PBS control group.
- Chymotrypsin group: 100 µL 0.25% (w/v; 2.5 mg/mL) chymotrypsin working solution, prepared by dissolving chymotrypsin powder in sterile PBS (perivascular sheath microinjection).
- Apply PPE-soaked gauze topically to the infrarenal aorta in animals in the PPE positive-control group, following the conventional PPE application procedure8. Perform this procedure exactly as detailed in section 1.7.3.
- Use a prespecified procedural record sheet for each animal to document treatment code, surgical start and end times, injection success/bleb formation, any leakage, vascular or organ injury, bleeding, thrombosis, rupture, anesthesia-related complications, postoperative recovery, and survival through day 28.
2. Anesthesia and surgical preparation (corresponds to Figure 1A)
- Anesthetize the mouse by intraperitoneal injection of ketamine (100 mg/kg) and xylazine (10 mg/kg). Confirm anesthetic depth by absence of the toe-pinch reflex.
- Apply ophthalmic ointment to both eyes to prevent corneal desiccation.
- Shave the abdominal hair and disinfect the abdominal skin sequentially with povidone-iodine and 70% ethanol, repeating three times.
- Place the mouse in the supine position on a heated surgical pad maintained at 37 °C. Secure all four limbs with tape.
3. Exposure of the infrarenal abdominal aorta (corresponds to Figure 1B)
- Make a 2.0–2.5 cm midline laparotomy from the xiphoid toward the pubis using microscissors.
- Gently retract the intestines to both sides of the abdominal cavity using a retractor to fully expose the retroperitoneal tissues.
- Under direct vision, identify the infrarenal abdominal aorta between the left renal vein and the iliac bifurcation.
NOTE: Do not dissect or separate the aorta from the inferior vena cava or surrounding tissues. The aorta only needs to be clearly visualized in situ for subsequent injection. Avoiding dissection preserves the perivascular sheath and minimizes mechanical injury.
4. Preparation of the microsyringe (corresponds to Figure 1C)
- Before injection, shape the distal needle segment so that the needle tip is oriented upward and forms approximately 60° relative to the main needle/syringe axis. This approximately 60° value describes the pre-bent needle-tip geometry, not the angle at which the needle enters the peri-adventitial tissue.
- Load a 1 mL syringe fitted with a 32-gauge microscale needle with 100 µL of freshly prepared chymotrypsin working solution (or an equal volume of sterile PBS for control animals). The intended administered volume is 100 µL per mouse.
- Expel any air bubbles and confirm smooth plunger movement.
5. Perivascular sheath microinjection (corresponds to Figure 1D,E)
- Under direct vision, hold the syringe so that the terminal needle segment enters the loose peri-adventitial connective tissue at a shallow insertion angle of approximately 15° relative to the local aortic surface/long axis.
NOTE: The needle tip must remain within the loose connective tissue enveloping the aorta. Do not puncture the aortic wall or the inferior vena cava. - Slowly deliver the chymotrypsin working solution over 15–20 s to allow local circumferential distribution around the vessel, forming a visible peri-aortic bleb.
NOTE: A uniform circumferential bleb confirms successful delivery into the perivascular sheath space. If solution leaks into the retroperitoneum, gently reposition the needle to complete the injection. In the current protocol, 100 µL is the standardized administered volume. The maximum allowable supplemental volume is 20 µL, and the maximum total administration volume per animal must not exceed 120 µL. The maximal tolerable capacity of the murine perivascular sheath was not formally established. - Wait 30 s to allow enzyme distribution, then slowly withdraw the needle.
6. Abdominal closure and postoperative care (corresponds to Figure 1F)
- Following removal of the retractor, gently reposition the intestines to their native anatomical position within the abdominal cavity. Close the abdominal wall layer by layer using appropriate suture material. Figure 1G presents a schematic illustration of the surgical procedure for perivascular sheath injection.
- Administer analgesia (e.g., carprofen, 5 mg/kg, subcutaneous) and prophylactic antibiotics per institutional guidelines.
- Place the mouse on a warm recovery pad until it regains full consciousness and ambulation. House individually for 24 h before returning to group housing.
7. Conventional peri-adventitial PPE model
- Perform anesthesia and aortic exposure as described for the perivascular sheath microinjection procedure. Under an operating microscope, expose a 1-cm aortic segment proximal to the bifurcation.
- Soak a sterile cotton patch (3.0 × 5.0 mm) thoroughly with 100 µL of 9.7 mg/mL PPE. Gently wrap the PPE-soaked cotton patch circumferentially around the 1-cm segment of the infrarenal aorta proximal to the bifurcation, ensuring uniform contact with the vascular adventitia for 30 min. Keep the cotton patch moist throughout the incubation, and replenish a small volume of PPE solution if signs of drying appear.
- Thoroughly rinse the peri-aortic tissue with sterile saline to remove any residual enzyme. Close the abdominal incision in layers.
8. Doppler ultrasonography (supports Figure 2A–C)
- At days 0 (baseline), 7, 14, and 28 after surgery, anesthetize the mouse with 1.5% isoflurane.
- Perform B-mode imaging of the infrarenal abdominal aorta using a high-frequency linear-array ultrasound transducer.
- Measure the maximal aortic luminal diameter in the long-axis view using a consistent inner-edge-to-inner-edge method. Define AAA formation as an increase of at least 50% in maximal aortic diameter relative to the preoperative baseline.
9. Tissue harvest and histopathological evaluation (supports Figure 3 and Figure 4)
- At day 14, euthanize the mouse under deep anesthesia.
NOTE: Briefly, administer an overdose of 0.3% sodium pentobarbital via tail vein injection at a volume of 0.03 mL/g body weight (equivalent to 90 mg/kg, approximately 2.3-fold of the standard surgical anesthetic dose of 39 mg/kg) to induce deep anesthesia. After the complete disappearance of corneal reflex and spontaneous respiration lasting over 3 min, bilateral thoracotomy was performed as secondary physical euthanasia confirmation to guarantee permanent cardiac arrest before aortic dissection. All euthanasia procedures were strictly in accordance with ARRIVE 2.0 guidelines and institutional animal welfare regulations. Perfuse the mouse sequentially with PBS followed by 4% paraformaldehyde via the left ventricle, to remove intravascular blood and adequately fix vascular tissue for clear morphological visualization. - Harvest the infrarenal abdominal aorta and post-fix in 4% paraformaldehyde overnight.
- Process tissues for paraffin embedding and section at 4–5 µm thickness.
- Perform hematoxylin and eosin (HE), Masson’s trichrome, and Verhoeff–Van Gieson (EVG) staining according to standard protocols22 to evaluate aortic wall structure, collagen deposition, and elastic fiber integrity.
- For immunohistochemistry22, perform heat-induced antigen retrieval on deparaffinized sections using 10 mM citrate buffer. Block non-specific binding with 5% bovine serum albumin for 30 min at room temperature, then incubate the sections with primary antibodies against CD45, CD68, MMP-2, MMP-9, and α-SMA at a 1:200 dilution overnight at 4 °C. After rewarming at room temperature for 30 min, incubate sections with horseradish peroxidase-conjugated secondary antibodies for 1 h at room temperature. Visualize immunoreactivity using 3,3′-diaminobenzidine as the chromogen, followed by hematoxylin counterstaining. Isotype-matched IgG is included as the negative control.
- Measure medial thickness as the perpendicular distance between the internal and external elastic laminae.
- Perform Masson’s trichrome staining to assess collagen deposition. Calculate the collagen volume fraction as (blue-stained collagen area / total vessel-wall ROI area) × 100%.
- Perform EVG staining to evaluate elastic fiber preservation. Calculate the relative elastic fiber content (%) = (medial elastic fiber positive area / total medial ROI area) × 100%.
- For immunohistochemical analysis, quantify the positive staining area fraction within pre‑defined vascular‑wall ROIs. Scan the stained slides using a whole‑slide scanner.
- Analyze the integrated optical density (IOD) and positive staining area using the image-analysis software listed in the Table of Materials. Restrict the ROIs to artifact‑free medial zones.
NOTE: For each animal, three non-adjacent cross-sections ( ≥50 µm apart) spanning the aneurysm sac were analyzed, and five random × 400 fields per section were quantified. The experimental unit was the individual animal; mean values across sections and fields were used per animal.
10. Waste disposal and biosafety
- Collect unused chymotrypsin solution and contaminated disposable materials as enzyme/biological laboratory waste according to institutional biosafety procedures.
- Collect paraformaldehyde solutions, rinses containing paraformaldehyde, and grossly contaminated materials as hazardous chemical waste in a labeled, compatible, closed container.
- Discard needles and scalpel blades into approved puncture-resistant sharps containers.
- Dispose of animal carcasses and harvested tissues as regulated animal/pathological biohazard waste according to institutional animal-facility and biosafety procedures.
11. Statistical analysis
- Data distribution and variance assessment
- Test the normality of continuous variables using the Shapiro–Wilk test and homogeneity of variance using Levene’s test.
- Present normally distributed data as mean ± standard deviation (SD); presented mixed-effects model-derived estimates as estimated marginal mean ± standard error (SE).
- Log-transform non-normally distributed data prior to parametric analysis; applied non-parametric methods when normalization was not achieved.
- Cross-sectional group comparisons
- Perform two-group comparisons using Student’s t-test, with Welch’s correction applied for datasets with unequal variances.
- Analyze multi-group cross-sectional data at single time points using one-way ANOVA followed by Tukey’s HSD post hoc test.
- Use Welch’s ANOVA with Games-Howell post hoc test for comparisons with unequal variance.
- Longitudinal data analysis
- Analyze longitudinal aortic diameter data across postoperative days 0, 7, 14, and 28 using a linear mixed-effects model (LMM).
- Specify group, time, and their interaction as fixed effects, and individual mouse as a random intercept.
- Perform simple main effect analyses with Bonferroni adjustment for multiple comparisons when a significant group × time interaction was detected.
- Categorical variable analysis
- Compare categorical variables using Fisher’s exact test.
- Apply Bonferroni correction for post hoc pairwise comparisons across groups.
- Sample size and power calculation
- Conduct an a priori power calculation for sample size determination based on the primary endpoint (maximal abdominal aortic diameter at day 28).
- Specify a Cohen’s d effect size of 1.0, two-tailed α = 0.05, and statistical power of 0.8.
- Set a target sample size of 25 mice per group to account for an expected 20% postoperative attrition rate. No outliers were removed a priori; all measurements from surviving animals were included in the final statistical analysis.
- Interobserver reliability assessment
- Evaluate interobserver reliability for blinded histological and immunohistochemical quantification using the intraclass correlation coefficient (ICC).
- Apply a two-way mixed-effects model with absolute agreement definition (single measurement) and 95% confidence intervals.
- Software and significance threshold
- Perform all statistical analyses using statistical analysis software; assembled all figures using vector graphics editing software. Detailed information on all software was provided in the Table of Materials.
- Set a two-tailed P < 0.05 as the threshold for statistical significance.
Results
Determination of 0.25% chymotrypsin as the optimal modeling concentration
Aortic diameters at different time points, cumulative aneurysm incidence and mortality across all pilot groups were shown in Supplementary Table 1. In the PBS group, no aortic dilation or AAA formation was observed at days 7, 14, or 28. The PPE group achieved AAA formation rates of 20% (1/5), 60% (3/5), and 60% (3/5) at days 7, 14, and 28, respectively.
All chymotrypsin concentrations induced aortic dilation. The 0.125% subgroup produced AAA in 40% (2/5) of mice at day 7 and 100% (5/5) at days 14 and 28. The 0.25% subgroup achieved AAA rates of 60% (3/5) at day 7 and 100% (5/5) at both days 14 and 28, with mean aortic diameters of 2.01 ± 0.41 mm and 2.01 ± 0.45 mm at days 14 and 28, respectively. Although 0.375% chymotrypsin also achieved 100% modeling at days 14 and 28, it was associated with 40% (2/5) mortality. Balancing modeling efficiency, dilation magnitude, and animal welfare, 0.25% chymotrypsin was selected for the main study.
Perivascular sheath injection of 0.25% chymotrypsin stably and efficiently induces AAA
In the main study, a total of 75 mice were included and randomly assigned: 25 in the PBS group, 25 in the PPE group and 25 in the chymotrypsin group, respectively. AAA was defined as a ≥50% increase in maximal aortic diameter relative to baseline. Baseline aortic diameters showed no significant inter-group differences prior to intervention (PBS: 0.59 ± 0.09 mm; PPE: 0.60 ± 0.06 mm; chymotrypsin: 0.59 ± 0.05 mm; all P > 0.05). Serial Doppler ultrasonography revealed progressive aortic dilation in PPE group and chymotrypsin group, whereas the aortic diameter remained unchanged in the PBS group throughout the observation period (Figure 2A). At day 7, both the PPE and chymotrypsin groups developed significant aortic dilation relative to PBS controls (0.89 ± 0.16 mm and 0.92 ± 0.22 mm vs. 0.63 ± 0.11 mm; both P < 0.001), whereas aortic diameter was comparable between the two model groups (P = 0.851). At day 14, aortic dilation was substantially greater in the chymotrypsin group (2.37 ± 0.36 mm) than in the PPE group (1.47 ± 0.58 mm) and PBS controls (0.66 ± 0.08 mm; both P < 0.001). At day 28, the chymotrypsin group maintained markedly enlarged aortic diameters (2.14 ± 0.32 mm) compared with the PPE group (1.32 ± 0.56 mm) and PBS group (0.66 ± 0.05 mm; both P < 0.001; Figure 2B). Representative gross images of aortas harvested at day 14 confirmed the pronounced focal dilation in the chymotrypsin group, consistent with the ultrasound findings (Figure 2A). At day 7, AAA formation rates were 40% (10/25) in the PPE group and 44% (11/25) in the chymotrypsin group (P = 0.774). At day 14 and 28, all evaluable mice receiving chymotrypsin developed AAA, yielding a 100% (25/25) AAA formation rate, which was significantly higher than the 64% (16/25) observed in the PPE group (P = 0.003; Figure 2C).
Chymotrypsin injection shortens operative time while yielding comparable intraluminal thrombus formation
At day 28, intraluminal thrombus formation was observed in 37.5% (6/16) of the PPE group and 36% (9/25) of the chymotrypsin group (P = 0.920; Figure 2D). Operative time was significantly shorter for chymotrypsin injection than for PPE application (8.32 ± 0.95 min vs. 35.00 ± 1.58 min; P < 0.001; Figure 2E), demonstrating substantial procedural efficiency without compromising modeling outcomes.
Chymotrypsin-induced AAA exhibits pronounced histological remodeling
H&E staining revealed prominent aortic wall thickening, structural disorganization, and inflammatory infiltration in both PPE- and chymotrypsin-treated aortas relative to PBS controls, with the most severe lesions observed in the chymotrypsin group (Figure 3A). Quantitatively, medial thickness was significantly increased in both modeling groups compared with PBS, without statistical difference between the PPE and chymotrypsin groups (Figure 3B).
Masson’s trichrome staining demonstrated increased collagen deposition in both modeling groups, with the chymotrypsin group exhibiting a significantly higher collagen volume fraction (CVF) than the PPE group (Figure 3C), indicating enhanced fibrotic remodeling. EVG staining revealed intact, continuous medial elastic laminae in PBS controls, whereas both modeling groups showed extensive elastin fragmentation and rarefaction. Quantitatively, elastin content was significantly reduced in both modeling groups compared with PBS, with no significant difference between PPE and chymotrypsin groups (Figure 3D).
Chymotrypsin modeling enhances inflammatory infiltration and ECM-degrading enzyme expression
Immunohistochemical staining was performed to evaluate inflammatory cell infiltration, matrix‑remodeling-related protein expression, and vascular smooth muscle cell phenotype in aortic tissues across the PBS, PPE, and chymotrypsin groups (Figure 4A–F).
The positive area fraction of CD45 was markedly elevated in both the PPE and chymotrypsin groups compared with the PBS group. Moreover, CD45 positive inflammatory cell infiltration was significantly greater in the chymotrypsin group than in the PPE group (P < 0.05; Figure 4B). The positive area fraction of CD68 was substantially increased in the PPE and chymotrypsin groups relative to PBS controls. No statistically significant difference in CD68 positive area fraction was detected between the PPE and chymotrypsin groups (Figure 4C).
Both PPE and chymotrypsin treatment led to robust up-regulation of MMP2 positive area fraction versus PBS. MMP-2 levels were comparable between the two model groups (Figure 4D). For MMP-9, positive staining was significantly higher in the PPE group than in PBS controls, and further increased in the chymotrypsin group compared with the PPE group (P < 0.05; Figure 4E). The α-SMA positive area fraction was high in the PBS group. By contrast, both PPE and chymotrypsin groups exhibited obvious loss of α-SMA signal. There was no significant difference in α-SMA positive area fraction between the PPE and chymotrypsin groups (Figure 4F).
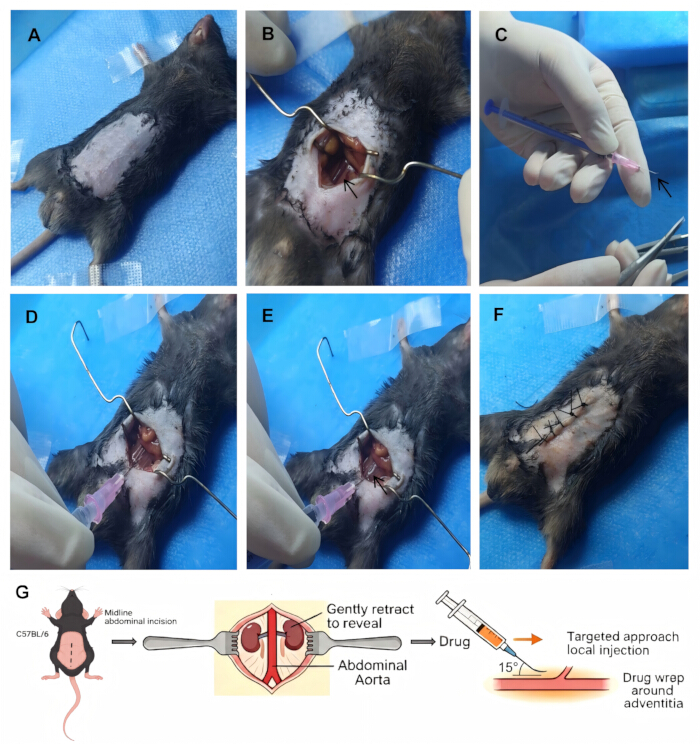
Figure 1: Key surgical procedures for establishing a mouse abdominal aortic aneurysm model by perivascular sheath microinjection of chymotrypsin. (A) The mouse was fixed after abdominal hair removal and skin disinfection. (B) The infrarenal abdominal aorta was exposed through a midline laparotomy; the arrow indicates the target vascular segment. (C) A syringe with a microscale needle was prepared; the arrow indicates the needle tip. (D) Under direct vision, the needle was inserted into the peri-adventitial space surrounding the abdominal aorta. (E) Chymotrypsin working solution was slowly injected to allow local circumferential distribution around the vessel; the arrow indicates the injection site. (F) The abdominal wall was closed layer by layer to complete the procedure. (G) Schematic illustration of the surgical procedure for peri-adventitial sheath injection. This technique enables targeted local delivery via peri-adventitial sheath injection and avoids the prolonged incubation step required in the conventional topical application method. Please click here to view a larger version of this figure.
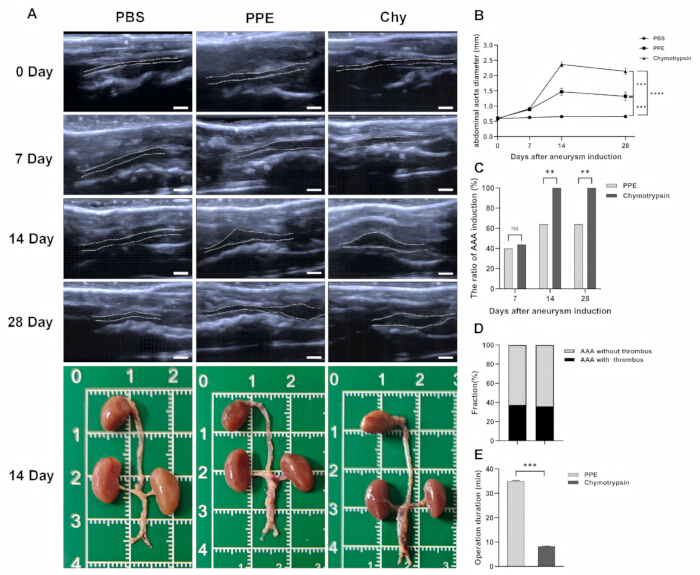
Figure 2: Morphological development of abdominal aortic aneurysm in the experimental groups. (A) Representative Doppler ultrasound images of the abdominal aorta in the PBS, PPE and chymotrypsin groups at 0, 7, 14, and 28 days after aneurysm induction, together with representative gross images of isolated aortas harvested at day 14. Scale bar = 1 mm. (B) Time-course changes in abdominal aortic diameter in the three groups at 0, 7, 14, and 28 days after aneurysm induction (n = 25/group). Data are estimated marginal means ± SE from a linear mixed-effects model with group, time, and group×time as fixed effects and mouse as a random intercept. Bonferroni-adjusted simple-effects comparisons were performed after a significant group × time interaction. (C) Comparison of AAA incidence at days 7, 14, and 28 after aneurysm induction. AAA was defined as an abdominal aortic diameter increase of at least 50% relative to the preoperative baseline. The difference in AAA formation rate between groups was analyzed by Fisher’s exact test. (D) Proportion of aneurysms with mural thrombus at day 28 in the PPE and chymotrypsin groups. The incidence of intraluminal thrombus was compared between the two groups using Fisher’s exact test. (E) Comparison of operation duration between the two modeling procedures. Operation duration was defined as the time from the first skin incision to completion of the final skin suture, recorded with a stopwatch by a blinded assistant. Differences in operation duration between groups were assessed by the independent samples t-test. ns, not significant; *P < 0.05; **P < 0.01; ***P < 0.001. Abbreviations: AAA, abdominal aortic aneurysm; PBS, phosphate-buffered saline; PPE, porcine pancreatic elastase; Chy, chymotrypsin. Please click here to view a larger version of this figure.
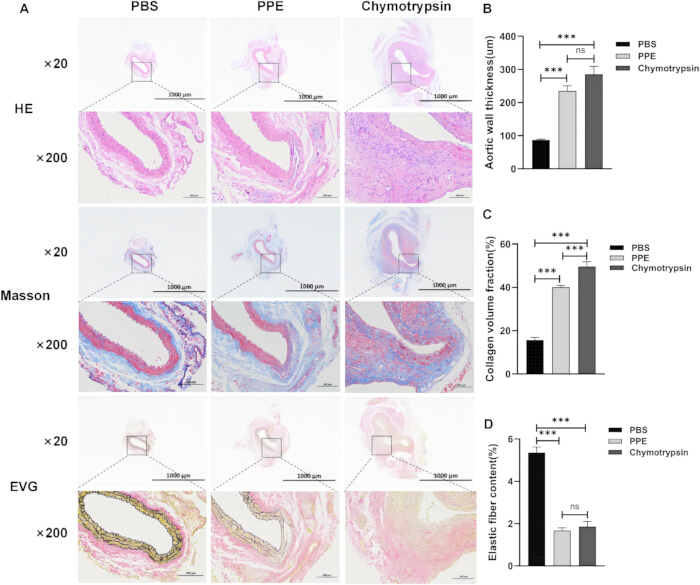
Figure 3: Histopathological evaluation of aortic wall remodeling. (A) Representative histological images of abdominal aortic sections stained with hematoxylin and eosin (HE), Masson’s trichrome, and Verhoeff-Van Gieson (EVG). Low magnification ( ×20, scale bar = 1000 µm) and high magnification (×200, scale bar = 100 µm) views are shown. (B) Quantitative analysis of aortic wall thickness. (C) Quantitative analysis of collagen volume fraction. (D) Quantitative analysis of elastic fiber content. Pathological and immunohistochemical examinations were performed using 5 mice per group. Data are presented as mean ± SD. Multi-group comparisons were analyzed by one-way ANOVA with Tukey post hoc testing. ns, not significant; *P < 0.05; **P < 0.01; ***P < 0.001. Please click here to view a larger version of this figure.
Abbreviations: EVG, Verhoeff-Van Gieson; HE, hematoxylin and eosin; PBS, phosphate-buffered saline; Chy, chymotrypsin; PPE, porcine pancreatic elastase.
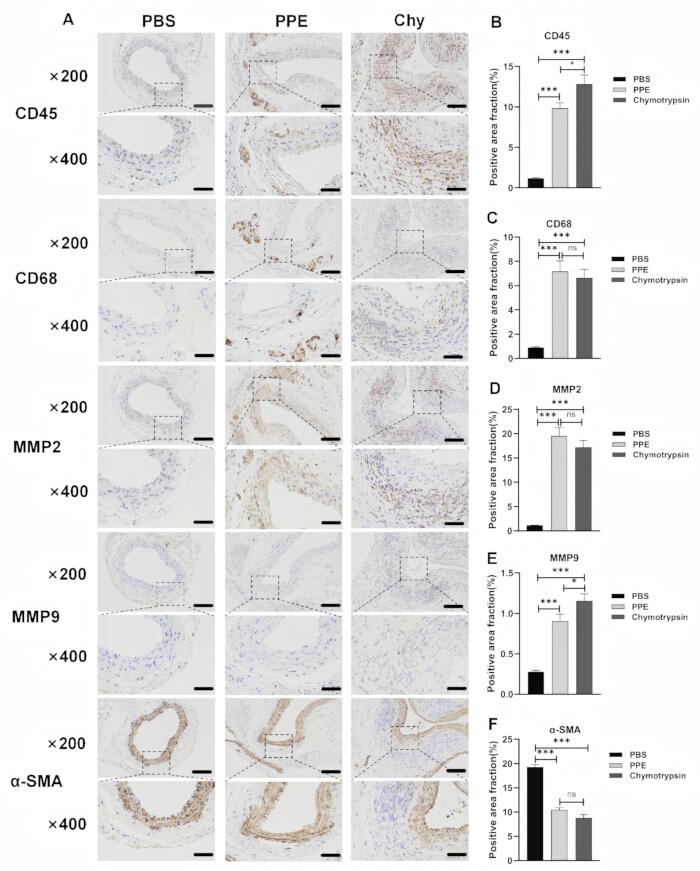
Figure 4: Immunohistochemical characterization of inflammatory infiltration and matrix remodeling. (A) Representative immunohistochemical staining for CD45, CD68, MMP-2, MMP-9, and α-SMA at ×200 (scale bar = 100 µm) and ×400 (scale bar = 50 µm). (B–F) Quantification of the positive staining area for each marker. Five mice per group were analyzed. Data are shown as mean ± SD. Multi-group comparisons were analyzed by one-way ANOVA with Tukey post hoc testing. ns, not significant; *P < 0.05; **P < 0.01; ***P < 0.001. Please click here to view a larger version of this figure.
Abbreviations: PBS, phosphate-buffered saline; PPE, porcine pancreatic elastase; Chy, chymotrypsin.
Supplementary Table 1: Pilot study data for screening the optimal chymotrypsin concentration for aneurysm induction. Data for aortic diameter are presented as mean ± SD. AAA incidence and mortality are expressed as percentage (number of animals/total number of animals assessed). Abdominal aortic diameters were measured by ultrasound before surgery and at 7, 14, and 28 days after aneurysm induction. AAA incidence is reported as cumulative incidence by each postoperative time point and is calculated using the original group size (n = 5). Animals that fulfilled the AAA criterion before death were retained in the cumulative incidence numerator. These data were used to determine the optimal concentration of chymotrypsin for the formal experiments.Please click here to download this file.
NOTE: Data for aortic diameter are presented as mean ± SD. AAA incidence and mortality are expressed as percentage (number of animals/total number of animals assessed). Abdominal aortic diameters were measured by ultrasound before surgery and at 7, 14, and 28 days after aneurysm induction. AAA incidence is reported as cumulative incidence by each postoperative time point and is calculated using the original group size (n = 5). Animals that fulfilled the AAA criterion before death were retained in the cumulative incidence numerator. These data were used to determine the optimal concentration of chymotrypsin for the formal experiments.
Abbreviations: PBS, phosphate-buffered saline; PPE, porcine pancreatic elastase; Chy, chymotrypsin.
Supplementary File 1: Ethical approval document. This file contains the official animal ethics approval issued by the Institutional Animal Care and Use Committee of Fujian Medical University for the experimental procedures described in this study.Please click here to download this file.
Discussion
Reliable animal models are the cornerstone of mechanistic investigations and preclinical drug evaluation in abdominal aortic aneurysm (AAA) research1,2,3,4. Over the past two decades, several murine platforms have been developed, including intraluminal porcine pancreatic elastase (PPE) infusion, peri-adventitial PPE application, periaortic calcium chloride (CaCl₂) application, and angiotensin II (Ang II) infusion in ApoE⁻/⁻ mice7,8,9,10. However, each approach presents intrinsic technical bottlenecks: intraluminal PPE infusion demands microsurgical arteriotomy and aortic clamping with substantial perioperative mortality11,12; peri-adventitial PPE application requires prolonged topical incubation with variable induction efficiency13,14; CaCl₂ application produces predominantly medial calcification rather than progressive dilation23; and the Ang II model relies on a hyperlipidemic genetic background and frequently generates suprarenal dissection instead of a true infrarenal aneurysm15,16. Growing evidence indicates that mast cell infiltration and the release of endogenous chymase — a chymotryptic serine protease functionally analogous to pancreatic chymotrypsin — represent a central pathobiological axis in human AAA, driving angiotensin II generation, VSMC apoptosis, and MMP activation18,19,20,21,24. This mechanistic convergence provides the theoretical basis for using pancreatic chymotrypsin as a physiologically relevant inducer of experimental AAA. The study emphasizes that pancreatic chymotrypsin and mast cell-derived chymase, although sharing chymotryptic cleavage preference for aromatic residues, are not biologically equivalent. Chymase exhibits stringent substrate specificity, distinct cellular origin (mast cells), tight regulatory mechanisms, and physiological roles in angiotensin II generation and matrix remodeling. Pancreatic chymotrypsin is a broad-specificity digestive protease25,26. The use of chymotrypsin therefore represents a functional analog that reproduces chymotryptic proteolytic injury within the peri-adventitial compartment, but does not recapitulate the full biology of endogenous mast cell-chymase signaling. This distinction should be considered when extrapolating findings to human AAA pathobiology. Reproducibility of the model depends critically on how a few key operative details are handled. Chief among these is preservation of the perivascular sheath. An intact peri-adventitial sheath forms a natural, semi-closed compartment that retains the injected chymotrypsin and allows uniform circumferential exposure of the aortic adventitia. Excessive dissection or stripping of this sheath disrupts the confined space, allowing enzyme leakage into the retroperitoneum; this results in reduced aneurysm induction efficiency, non-uniform luminal dilation, and a markedly increased risk of hemorrhage from injury to the aorta or the closely apposed inferior vena cava12,13. Equally important is precise control of injection depth and angle. Insertion at a shallow angle (~15°) with the needle tip remaining within the loose peri-adventitial connective tissue ensures targeted delivery. If the needle is inserted too deeply and penetrates the aortic wall into the lumen, endothelial injury, acute thrombosis, or intraoperative death may occur27; conversely, if the needle is too superficial and fails to enter the perivascular space, the enzyme solution leaks into the peritoneal cavity and cannot effectively induce vascular remodeling. The formation of a uniform circumferential translucent bleb around the aorta serves as the direct visual confirmation of successful intra-sheath retention and is a key determinant of intra-group reproducibility. A third, often underestimated factor is enzyme freshness. Chymotrypsin activity declines in a time-dependent manner after reconstitution in aqueous solution17, and this decay is one of the principal sources of inter-batch variability in aneurysm induction rates. Preparation immediately before use, storage on ice throughout the surgical session, and consistent enzyme concentration across animals minimize such variability and constitute an essential quality-control step to reduce experimental bias.
In practice, a limited number of intraoperative and postoperative complications tend to recur, and awareness of their typical causes is helpful for troubleshooting. Suboptimal induction most commonly reflects reduced enzyme activity, imprecise needle placement, or unrecognized leakage during injection; verifying chymotrypsin activity, performing the injection strictly under direct vision within the peri-adventitial space, and confirming the formation of a full circumferential bleb generally resolve the issue, and a small supplementary aliquot can be gently injected at any deficient site. Intraoperative bleeding is usually caused by inadvertent puncture of the aortic wall or the inferior vena cava; minor bleeding can be controlled by gentle compression with a sterile cotton applicator, whereas animals with substantial hemorrhage should be excluded from the study, and prevention relies on strict visual guidance and avoidance of excessive needle depth. Postoperative mortality is most often attributable to delayed hemorrhage from vascular injury, peritoneal infection, intestinal adhesion, or anesthetic overdose, and can be minimized by aseptic technique, appropriate perioperative analgesia and antibiotic prophylaxis, minimization of intestinal exposure, and careful anesthetic dose titration. Animals experiencing major intraoperative hemorrhage or death within 24 h postoperatively should be excluded from statistical analysis. Operators new to the technique may benefit from performing three to five preliminary surgeries before initiating formal experiments, using reliable formation of a uniform peri-aortic bleb, absence of major intraoperative bleeding, and ultrasonographically detectable aortic dilation by postoperative day 7 as practical benchmarks of procedural competence.
In this study, the perivascular sheath chymotrypsin microinjection technique was directly benchmarked against the widely used topical PPE model. Three important distinctions emerged. First, the chymotrypsin approach achieved a 100% AAA incidence on day 14 versus 64% with topical PPE, with significantly greater aortic dilation. Second, chymotrypsin induced significantly greater CD45⁺ leukocyte infiltration and collagen deposition, suggesting a more pronounced inflammatory-fibrotic remodeling phenotype. Third, the procedure eliminates the 30-min in situ incubation and repeated saline rinsing required by topical PPE, substantially shortening operative time and reducing tissue manipulation. Collectively, these features position the chymotrypsin microinjection model as a technically streamlined and pathologically robust alternative for early-phase mechanistic studies. These features together suggest a broad range of research applications. The model is particularly well suited to mechanistic investigations of mast cell–mediated vascular remodeling, chymase-driven extracellular matrix degradation, VSMC phenotypic switching, and MMP-dependent proteolytic pathways in aneurysm formation. Its operational simplicity, high induction efficiency, and wild-type background also make it a convenient platform for large-scale primary screening and preclinical validation of anti-AAA therapeutics, including chymase inhibitors, MMP inhibitors, and anti-inflammatory agents. Because the protocol does not require a high-fat diet or a hyperlipidemic genetic background, it can be directly applied to genetically engineered mice, allowing rapid assessment of the contribution of individual genes to AAA susceptibility and progression. It can, moreover, be used alongside the Ang II and CaCl₂ models to interrogate distinct pathological dimensions of AAA in parallel, providing cross-model validation and strengthening the reliability of mechanistic conclusions.
The study emphasizes that the current model was established on a normolipidemic wild-type C57BL/6J background and does not recapitulate the atherosclerotic environment that frequently coexists with human AAA. This limits its translational relevance for studies of plaque-related pathobiology or advanced-stage disease. Future adaptations of this technique to ApoE⁻/⁻ or LDLR⁻/⁻ backgrounds, potentially combined with high-fat diet feeding, would broaden its applicability. Despite its reproducibility and operational simplicity, the protocol has several limitations that should be considered when interpreting results and designing follow-up studies. Only male C57BL/6J mice were evaluated, so sex- and strain-dependent responses remain uncharacterized and induction efficiency in female mice or other genetic backgrounds will require independent validation; the present conclusions therefore apply strictly to male C57BL/6J animals. As with other chemically induced AAA models, aneurysms are generated on a wild-type, normolipidemic background and thus do not recapitulate the atherosclerotic milieu that commonly coexists with human AAA28. This limits its translational relevance for studies of plaque-related pathobiology or advanced-stage disease. Future adaptations of this technique to ApoE⁻/⁻ or LDLR⁻/⁻ backgrounds, potentially combined with high-fat diet feeding, would broaden its applicability. From a translational perspective, it should also be recognized that exogenous pancreatic chymotrypsin only partially mimics the biology of endogenous mast cell–derived chymase and does not reproduce its precise spatiotemporal regulation within human AAA tissue18⁻21, so extrapolation to human disease should be undertaken with appropriate caution. Overall, the 28-day observation window is best suited to studies of aneurysm initiation and early vascular remodeling, whereas investigations targeting chronic thrombus maturation, long-term wall degeneration, or rupture will be better served by complementary models with extended observation periods.
In summary, perivascular sheath microinjection of chymotrypsin provides a technically streamlined and pathologically relevant murine AAA model. Standardization of key operational steps substantially improves inter-experimental consistency. This protocol offers a reliable and readily transferable experimental platform for investigating AAA pathogenesis and developing targeted therapeutic strategies, and is expected to find broad application in cardiovascular disease research.
Disclosures
The authors declare no conflicts of interest. The authors acknowledge the use of ChatGPT (OpenAI) for language polishing and grammatical refinement of the manuscript.
Acknowledgements
The authors thank all colleagues in the Department of Biochemistry and Molecular Biology, School of Basic Medical Sciences, Fujian Medical University, and in the Department of Vascular Surgery, First Affiliated Hospital of Fujian Medical University, for helpful discussions. This study was supported by grants from the Joint Funds for the Innovation of Science and Technology (Grant No. 2023Y9105), and the Startup Fund for Scientific Research (2023QH1089).
Materials
| Name | Company | Catalog Number | Comments |
|---|---|---|---|
| 0.22 µm sterile syringe filter | Millipore | SLGP033RB | Filtration of enzyme solution |
| 1-mL syringe | Hamilton | 81000 | Precision delivery of 100 μL chymotrypsin/PBS solution |
| 32-gauge microscale needle | CONPUVON | CP-32130 | Attached to 1-mL syringe |
| 4% paraformaldehyde | EMS | 15710-S | Tissue fixation |
| 5-0 nylon suture (skin) | Ethicon | W1617T | Skin closure |
| 6-0 silk suture (muscle) | Ethicon | W6977G | Muscle layer closure |
| 70% ethanol | Sinopharm | 80109208 | Skin disinfection |
| Adobe Illustrator | Adobe Inc. | Version 2024 | Figure assembly/vector graphics editing |
| Anti-CD45 antibody | Abcam | ab10558 | Pan-leukocyte marker for immunohistochemistry |
| Anti-CD68 antibody | Abcam | ab125212 | Macrophage marker for immunohistochemistry |
| Anti-MMP-2 antibody | Abcam | ab86607 | Immunohistochemistry |
| Anti-MMP-2 antibody | Abcam | ab92536 | Matrix metalloproteinase-2 for immunohistochemistry |
| Anti-MMP-9 antibody | Abcam | ab38898 | Immunohistochemistry |
| Anti-MMP-9 antibody | Abcam | ab76003 | Matrix metalloproteinase-9 for immunohistochemistry |
| Anti-α-SMA antibody | Abcam | ab7817 | Vascular smooth muscle cell marker for immunohistochemistry |
| Carprofen | GLPBio | GC17341 | 5 mg/kg s.c., postoperative analgesia |
| Chymotrypsin | MCE | HY-108910 | Working solution in sterile PBS |
| Color Doppler ultrasound system | Siemens Healthineers | ACUSON Sequoia ultrasound system | Aortic imaging |
| GraphPad Prism | GraphPad Software Inc. | Version 10.0 | Statistical analysis |
| Heated surgical pad | RWD Life Science | 69026 | Maintenance of core body temperature during surgery and recovery |
| Hematoxylin and eosin staining kit | Abcam | ab24588 | Routine histology |
| HRP-conjugated secondary antibody (anti-mouse) | Cell Signaling | 7076 | Detection of mouse-derived primary antibodies |
| Image-Pro Plus | Media Cybernetics | v6.0 | Positive area quantification |
| ImageJ | NIH | v1.53t | Ultrasound and histology quantification |
| Isoflurane | RWD | RWD-Iso-100 | Ultrasound anesthesia |
| Ketamine hydrochloride | VetOne | NDC 13985-584-10 | 100 mg/kg, i.p. |
| Male C57BL/6J mice | Genepax Biotechnology Co., Ltd. | — | 8–12 weeks, 20–25 g |
| Masson’s trichrome staining kit | Abcam | ab15068 | Collagen visualization |
| Micro-retractor set | — | — | Hand-fabricated from standard stainless steel paper clips; sterilized by autoclaving prior to surgery. Used for gentle retraction of abdominal intestines to expose the retroperitoneal infrarenal aortic segment. |
| Microsurgical scissors | Fine Science Tools | 14090-09 | Laparotomy |
| Needle holder | Fine Science Tools | 12500-12 | Suturing |
| Ophthalmic ointment | Sinopharm | H31020521 | Prevention of corneal desiccation during anesthesia |
| Porcine pancreatic elastase (PPE) | Sigma-Aldrich | E1250 | Positive control AAA inducer; 9.7 mg/mL for topical application (specific activity ≥4.0 U/mg) |
| Povidone-iodine solution | Macklin | P816188 | Skin disinfection |
| Sodium pentobarbital | Sigma-Aldrich | P3761 | Euthanasia agent; 0.3% solution, 0.03 mL/g via tail vein injection |
| SPSS | IBM Corporation | Version 29.0 | Statistical analysis |
| Sterile cotton applicators | Fine Science Tools | 14001-05 | Intraoperative hemostasis and tissue cleaning |
| Sterile cotton patch | Fine Science Tools | 14040-01 | Topical PPE incubation in positive control group |
| Sterile phosphate-buffered saline | Thermo Fisher | 10010023 | Solvent and vehicle control |
| Tissue forceps | Fine Science Tools | 11051-10 | Tissue handling |
| Verhoeff–Van Gieson (EVG) staining kit | Abcam | ab150667 | Elastic fiber visualization |
| Whole-slide scanner/digital pathology system | Olympus | VS200 | Image acquisition |
| Xylazine hydrochloride | Lloyd Laboratories | NDC 139-236 | 10 mg/kg, i.p. |
References
- Sakalihasan N, et al. Abdominal aortic aneurysms. Nat Rev Dis Primers. 2018;4(1):34.
- Golledge J. Abdominal aortic aneurysm: update on pathogenesis and medical treatments. Nat Rev Cardiol. 2019;16(4):225–242.
- Wanhainen A, et al. Editor’s Choice — European Society for Vascular Surgery (ESVS) 2019 Clinical Practice Guidelines on the Management of Abdominal Aorto-iliac Artery Aneurysms. Eur J Vasc Endovasc Surg. 2019;57(1):8–93.
- Chaikof EL, et al. The Society for Vascular Surgery practice guidelines on the care of patients with an abdominal aortic aneurysm. J Vasc Surg. 2018;67(1):2–77.e2.
- Raffort J, et al. Monocytes and macrophages in abdominal aortic aneurysm. Nat Rev Cardiol. 2017;14(8):457–471.
- Klaus V, et al. Association of matrix metalloproteinase levels with collagen degradation in the context of abdominal aortic aneurysm. Eur J Vasc Endovasc Surg. 2017;53(4):549–558.
- Anidjar S, et al. Elastase-induced experimental aneurysms in rats. Circulation. 1990;82(3):973–981.
- Bhamidipati CM, et al. Development of a novel murine model of aortic aneurysms using peri-adventitial elastase. Surgery. 2012;152(2):238–246.
- Daugherty A, Manning MW, Cassis LA. Angiotensin II promotes atherosclerotic lesions and aneurysms in apolipoprotein E-deficient mice. J Clin Invest. 2000;105(11):1605–1612.
- Chiou AC, Chiu B, Pearce WH. Murine aortic aneurysm produced by periarterial application of calcium chloride. J Surg Res. 2001;99(2):371–376.
- Pyo R, et al. Targeted gene disruption of matrix metalloproteinase-9 (gelatinase B) suppresses development of experimental abdominal aortic aneurysms. J Clin Invest. 2000;105(11):1641–1649.
- Trollope A, Moxon JV, Moran CS, Golledge J. Animal models of abdominal aortic aneurysm and their role in furthering management of human disease. Cardiovasc Pathol. 2011;20(2):114–123.
- Busch A, et al. Translating mouse models of abdominal aortic aneurysm to the translational needs of vascular surgery. JVS Vasc Sci. 2021;2:219–234.
- Lu G, et al. A novel chronic advanced stage abdominal aortic aneurysm murine model. J Vasc Surg. 2017;66(1):232–242.e4.
- Daugherty A, Cassis LA. Mouse models of abdominal aortic aneurysms. Arterioscler Thromb Vasc Biol. 2004;24(3):429–434.
- Trachet B, et al. Ascending aortic aneurysm in angiotensin II–infused mice: formation, progression, and the role of focal dissections. Arterioscler Thromb Vasc Biol. 2016;36(4):673–681.
- Appel W. Chymotrypsin: molecular and catalytic properties. Clin Biochem. 1986;19(6):317–322.
- Mayranpaa MI, et al. Mast cells associate with neovessels in the media and adventitia of abdominal aortic aneurysms. J Vasc Surg. 2009;50(2):388–395.
- Sun J, et al. Mast cells modulate the pathogenesis of elastase-induced abdominal aortic aneurysms in mice. J Clin Invest. 2007;117(11):3359–3368.
- Tsuruda T, et al. Adventitial mast cells contribute to pathogenesis in the progression of abdominal aortic aneurysm. Circ Res. 2008;102(11):1368–1377.
- Furubayashi K, et al. The significance of chymase in the progression of abdominal aortic aneurysms in dogs. Hypertens Res. 2007;30(4):349–357.
- Suvarna SK, Layton C, Bancroft JD, editors. Bancroft's Theory and Practice of Histological Techniques. 7th ed. Churchill Livingstone Elsevier; 2013.
- Yamanouchi D, et al. Accelerated aneurysmal dilation associated with apoptosis and inflammation in a newly developed calcium phosphate rodent abdominal aortic aneurysm model. J Vasc Surg. 2012;56(2):455–461.
- Sun J, et al. Critical role of mast cell chymase in mouse abdominal aortic aneurysm formation. Circulation. 2009;120(11):973–982.
- Andersson MK, Enoksson M, et al. The extended substrate specificity of the human mast cell chymase reveals a serine protease with well-defined substrate recognition profile. Int Immunol. 2009;21(1):95–104.
- Pejler G. Novel insight into the in vivo function of mast cell chymase: lessons from knockouts and inhibitors. J Innate Immun. 2020;12(5):369–376.
- Azuma J, Asagami T, Dalman R, Tsao PS. Creation of murine experimental abdominal aortic aneurysms with elastase. J Vis Exp. 2009;(29):1280.
- Senemaud J, et al. Translational relevance and recent advances of animal models of abdominal aortic aneurysm. Arterioscler Thromb Vasc Biol. 2017;37(3):401–410.