This protocol describes microfluidics-based lifespan analysis by time-lapse microscopy of Saccharomyces cerevisiae gametes obtained from young or aged precursor cells.
Method Article
A Microfluidics-Based Assay for the Discovery of Gametogenic Rejuvenation Factors in Saccharomyces cerevisiae
In This Article
Summary
Abstract
Saccharomyces cerevisiae progressively ages through asymmetrical cell divisions, retaining age-associated damage in the mother cell while producing young daughter cells. Gametogenesis completely resets the replicative lifespan of aged cells, thus rewinding the aging clock for the next generation. Although gametogenic rejuvenation in yeast has been described before, techniques to quantify the resetting of replicative lifespan at high throughput have been lacking. Previous methods for quantifying rejuvenation following gametogenesis were limited to low-throughput, labor-intensive approaches that relied on repeated manual micromanipulation of individual cells. Here, we describe in detail a high-throughput microfluidics-based microscopy assay that enables systematic characterization of the factors required for gametogenic rejuvenation in S. cerevisiae. This method leverages two inert genetic modifications that enable microfluidics-based assessment of gamete replicative lifespan. Upon age sorting and tetrad dissociation, conditionally sterile gametes are loaded into microfluidics-based imaging devices and identified using a gamete-specific marker. Long-term time-lapse imaging enables robust tracing and comparison of replicative lifespans of gametes derived from young and aged precursor cells. Here, we provide a step-by-step protocol that enables systematic quantification of gamete lifespan and high-throughput identification of molecular factors mediating gametogenic cellular rejuvenation in S. cerevisiae.
Introduction
Saccharomyces cerevisiae cells age replicatively during mitosis by dividing asymmetrically, retaining age-associated damage in the mother cell while producing young daughter cells1,2,3,4. The replicative lifespan of yeast is therefore limited, defined as the number of daughter cells that a given mother cell produces before its terminal division, followed by senescence and ultimately, death. Strikingly, if an aged S. cerevisiae cell completes gametogenesis, the replicative lifespan of all resultant gametes is completely reset, rendering them indistinguishable from gametes derived from young precursor cells5,6,7,8,9 (Figure 1A). Since the initial discovery of gametogenic rejuvenation in yeast, multiple important factors that clear age-associated damage during gametogenesis have been identified, but the absence of high-throughput techniques has made it challenging to investigate the impact these pathways have on the lifespan of gametes6. Quantification of the replicative lifespan of gametes has historically relied on scoring cell divisions manually using a fluorescent microdissection microscope, whereby the replicative lifespan of gametes is scored over several days by continuous counting and manual removal of generated daughter cells7. Although the replicative lifespan of gametes can be analyzed with this technique, its laborious and time-consuming nature has resulted in marginal implementation in the field over the last decade10,11. The fact that no specific molecular pathways have been shown to directly contribute to gametogenic rejuvenation since its initial discovery7 underlines the limitations of the current technique and the need for an automated and high-throughput assay.
In recent years, new microfluidics-based approaches have replaced quantification of replicative lifespan by micromanipulation, which obviate the need for manual separation of daughter cells12. Different traps have been engineered to capture and retain mother cells in imaging chambers, with a constant flow of fresh media over their complete replicative lifespan, washing away newly formed daughter cells. Parallelization of several imaging chambers further allows acquisition of replicative lifespan from hundreds of cells across different genetic backgrounds over several days in a single experiment13,14,15,16,17,18,19. While these microfluidics-based approaches are now favored for vegetatively growing haploid yeast cells, the application of this technique to measuring the replicative lifespan of yeast gametes has not been reported to date.
Three major technical and biological obstacles impede the assessment of S. cerevisiae gamete replicate lifespan using microfluidic devices. First, during gametogenesis, a diploid yeast cell undergoes two meiotic divisions and forms a tightly packed tetrad containing four haploid gametes with a 2:2 segregation of the two mating types, MATa and MATα (Figure 1A). Thus, when loading MATa and MATα gametes into microfluidic devices, secreted mating pheromones will induce mating response in nearby cells, leading to growth arrest, abnormal cell morphologies, and clogging of the microfluidic devices. Second, the four gametes within a tetrad ascus do not separate naturally during germination. Thus, without manual separation, only whole tetrads can be trapped in microfluidic chambers. Reduced trap retention of unseparated tetrads and intractability of individual divisions of the four still-connected gametes render assessment of the replicative lifespan of each individual gamete impossible. Third, if tetrads are separated into individual gametes before loading into microfluidic devices, they are significantly smaller than vegetatively growing cells and are not captured by standard traps (Figure 2A–C).
To overcome these limitations, Spiri et al. 20269 combined inert genetic modifications, tetrad separation and gamete outgrowth, and a gamete-specific marker to enable microfluidic-based high-throughput quantification of gamete replicative lifespan and characterization of factors required for gametogenic rejuvenation in S. cerevisiae (Figure 1B–F). First, to prevent post-germination mating without interfering with standard genetic crosses, a conditionally sterile allele was engineered (Figure 3A). Second, to separate tetrads into single gametes, Zymolyase treatment, which weakens the outer spore wall, was combined with mechanical manipulation. Third, to enable efficient identification of gametes, even after separation and the brief outgrowth required for use of standard microfluidic traps, a long-lived, retained gamete-specific fluorescent reporter was introduced. Using this approach, single gametes derived from previously sorted young and aged precursor cells can be isolated and loaded into microfluidic devices to perform continuous time-lapse imaging over 72 h, allowing quantitative analysis and comparison of gamete replicative lifespan from young and aged precursor cells9. The detailed protocol described here substantially enhances the feasibility and throughput of gamete lifespan analysis in both aged and young precursor cells, enabling direct identification of the molecular pathways that mediate cellular rejuvenation during gametogenesis.
Protocol
A detailed list of reagents and equipment used in this protocol is listed in the Table of Materials.
1. Replicative aging of founder cells
NOTE: All experiments using the protocol below are performed in diploid S. cerevisiae cells of the SK1 strain background containing the following minimal genetic background: pPMA2-PMA2-eGFP, ste5::NATR-pTet07.1-STE5, pRNR2-TetR-TUP1, pTetO7.1-TetR, flo8Δ, amn1D368V. For all cultures incubated in glass flasks, the culture volume should not exceed 1/5 of the flask volume to ensure proper aeration.
- Thaw diploid cells on yeast extract peptone (YP) glycerol plates, incubate at 30 °C overnight. Transfer diploid cells to YP dextrose (YPD) plates, incubate at 30 °C (>8 h).
- Inoculate freshly thawed diploids in 5 mL liquid YPD (2% dextrose). Shake cultures (300 rpm) at room temperature overnight (>12 h).
- Re-dilute the starter culture to an optical density at 600 nm (OD600) = 0.2 in 30 mL YPD (2% dextrose). Shake cultures (300 rpm) at 30 °C for 3–4 h until cultures reach density OD600 = 0.6–1.
- Make sure to start with enough culture to have 16 OD600 units of cells to label per genotype. Transfer 2 x 8 OD600 units of cells for each genotype into a 50 mL conical tube.
- Recommended: split 16 OD600 units into two samples (8 OD600 units each) to set up two independent founder cell cultures for every genotype. After age sorting (step 2.16), combine the aged cells from the two founder cell cultures to increase the total yield of aged cells.
- Centrifuge 50 mL conical tube for 2 min at 1,900 x g and decant supernatant. Resuspend pellet with 20 mL phosphate-buffered saline (PBS) (pH 8).
- Repeat step 1.6 two more times for a total of three washes in PBS (pH 8). Prepare an 8 mg/mL biotin solution (500 μL needed per 8 OD600 units of cells).
- Weigh out biotin (4 mg/sample) and suspend powder completely in PBS (pH 8) to reach a final concentration of 8 mg/mL (500 μL needed per sample). After the third wash, resuspend cells in 1 mL PBS (pH 8).
- Distribute 500 μL of cell suspension into two low-adhesion centrifuge tubes, splitting the initial 2 x 8 OD600 units. Add 500 μL biotin solution (8 mg/mL) to each centrifuge tube for a total volume of 1 mL (Figure 1B).
- Seal the lid with parafilm and vortex for 1 minute. Aged cells are sensitive to mechanical stress; this is the last time the cells are vortexed. Resuspend cell pellets by gently pipetting up and down from now on.
- Transfer the centrifuge tubes to a rotating rack and incubate for 30 min at 4 °C. Centrifuge for 2 min at 1,900 x g, then pipette off supernatant. Resuspend pellet in 1 mL PBS (pH 8 + 100 mM glycine) to chemically quench excess biotin.
- Repeat step 1.11 three more times for a total of 3 washes with PBS (pH 8 + 100 mM glycine). Resuspend cells in 1 mL YPD (2% dextrose).
- Centrifuge for 2 min at 1,900 x g and pipette off supernatant. Prepare 50 mL YPD (2% dextrose) + ampicillin (100 µg/mL) cultures in 500 mL flasks for each biotin-labeled sample.
- Resuspend the biotin-labeled cells in 1 mL YPD (2% dextrose) and add to the 500 mL flask. Measure the optical density (OD600) of the founder culture to estimate the number of generations the next day.
- Shake the founder cultures (300 rpm) at 30 °C overnight (16–18 h) to achieve replicative aging (Figure 1B). This will result in approximately 6–7 divisions of each biotin-labeled founder cell.
2. Isolation of aged founder cells
NOTE: Store PBS (pH 7.4) + BSA (5 g/L) at 4 °C and keep on ice during the experiment.
When re-diluting cell pellets, ensure they are fully resuspended and mixed to avoid column clogging and maximize sorting efficiency. To enhance the purity of the aged cell population, two consecutive sorts are performed by re-applying the eluate from the first sorting column to a fresh second sorting column. This procedure yields aged cell populations with minimal contamination from young cells (90–98% purity). Aged cells are sensitive to mechanical stress; resuspend cell pellets by gently pipetting up and down using a serological pipette.
- After 16–18 h of incubation, record the optical density (OD600) of each founder culture. Calculate the estimated number of generations (mean age = log2(OD600End / OD600Start)).
- Centrifuge each culture for 2 min at 1,900 x g in 50 mL conical tubes and decant supernatant. Resuspend pellet with 20 mL PBS (pH 7.4 + BSA (5 g/L)) by pipetting up and down using a serological 25 mL pipette.
- Repeat step 2.2 once. Mix the vial of Anti-Biotin MicroBeads suspension by inversion. Using a cut tip, add 100 μL of Anti-Biotin MicroBeads to the cell suspension.
- Mix by inversion. Incubate at 4 °C for 15 min. Incubate on a rotating rack or invert the tube at least 3–4 times every 5 min (Figure 1C).
- Set up the QuadroMACS magnetic stand, columns, and pre-separation filters (30 µm). Add a container beneath the column to collect all waste that flows through.
- Prime each filter/column with 3 mL of PBS (pH 7.4 + BSA (5 g/L)). Label two 15 mL conical tubes for each column and condition (one for “aged cell eluate” and one for “young cell flow-through”).
- Centrifuge cell suspensions for 2 min at 1,900 x g and decant supernatant. Resuspend pellet with 20 mL PBS (pH 7.4 + BSA (5 g/L)) and spin down again.
NOTE: This step is important to remove excess free Anti-Biotin MicroBeads, which would otherwise saturate the column. - Completely resuspend the cell pellet in 5 mL PBS (pH 7.4 + BSA (5 g/L)) and apply to the first sorting column (Figure 1C). Label columns with the applied genotype to keep track.
- Collect the first flow-through in the 15 mL conical tubes labeled as “young cell flow-through”. Exchange the 15 mL conical tubes with a waste flow-through container once the cell suspension has flown through the column.
- Combine the two young cell flow-through suspensions from the same genotype into one 15 mL conical tube. Dilute 250 μL of combined young cell flow-through with 9.75 mL PBS (pH 7.4 + BSA (5 g/L)) in a new 15 mL conical tube. Set aside labeled as “diluted young cells” for later steps.
- Wash each column 4x with 3 mL PBS (pH 7.4 + BSA (5 g/L)). For the first wash, aliquot 3 mL of PBS (pH 7.4 + BSA (5 g/L)) back into the 50 mL conical tube that contained the cell suspension. Transfer to the corresponding column to apply any remaining cells to the column. Wash the column 3 times with fresh 3 mL PBS (pH 7.4) + BSA (5 g/L).
- Set up fresh columns and pre-separation filters (30 µm) for second sorting. Prime each filter/column with 3 mL of PBS (pH 7.4 + BSA (5 g/L)).
- Remove the first column from the magnet and hold it over the second column for the second sort. Add 5 mL of PBS (pH 7.4 + BSA (5 g/L)) to the first column and push steadily (gently but firmly) with the provided plunger to elute aged cells
- Apply the eluted aged cells to the second column. Label columns with the applied genotype to keep track.
- Wash each column 3 times with 3 mL PBS (pH 7.4) + BSA (5 g/L). Remove the column from the magnet and place it in a 15 mL conical tube labeled aged cell eluate. Add 5 mL of PBS (pH 7.4) + BSA (5 g/L) to the columns and push steadily (gently but firmly) with the provided plunger to elute aged cells.
- Combine two eluates from the two independent founder cultures of the same genotype to increase the total yield of aged cells (see step 1.5).
3. Fluorescent labeling of bud scars and biotin
NOTE: When labeled with fluorescent dyes, cells should be protected from light during incubation. Conditioned gametogenesis-inducing media is obtained by filter-sterilizing a gametogenesis-inducing culture in standard gametogenesis-inducing media 5 h after induction of gametogenesis. Store conditioned gametogenesis-inducing media sealed with parafilm at 4 °C.
- Centrifuge the combined aged and diluted young cell suspension for 2 min at 1,900 x g and decant the supernatant. Resuspend cells in 12 mL PBS (pH 7).
- Repeat step 3.1 twice and then resuspend cells in 4 mL PBS (pH 7) the second time. Add 4 μL of fluorescently labeled wheat germ agglutinin (1 µg/mL) and 4 μL of fluorescently labeled streptavidin (1 µg/mL) to each tube (Figure 1C).
- Incubate for 15 min in the dark at room temperature. Invert 3–4 times every 5 min. Centrifuge cells for 2 min at 1,900 x g, then decant supernatant.
- Resuspend in 12 mL gametogenesis-inducing media. Repeat the centrifugation and resuspension wash three times; after the final wash, resuspend the cells in 2 mL of conditioned gametogenesis-inducing medium containing ampicillin (100 µg/mL).
4. Induction of gametogenesis and analysis of age sorting
CAUTION: Formaldehyde is toxic and irritating; handle it in a chemical fume hood while wearing appropriate personal protective equipment (PPE).
- Measure density (OD600) of re-suspended cell suspension (from step 3.4). Dilute cultures to an OD600 of 0.8 with conditioned gametogenesis-inducing medium containing ampicillin (100 µg/mL), then transfer to a glass flask.
NOTE: Volume depends on total yield of aged cells; a final culture volume of 10 mL is sufficient for downstream applications. - Aliquot 135 μl diluted pre-gametogenic culture to 1.5 mL centrifuge tubes containing 15 μl formaldehyde (37%). Rotate and incubate at room temperature for 15 min. Store at 4 °C.
- Shake cultures (300 rpm) at 30 °C for 24 h to complete gametogenesis (Figure 1C).
PAUSE POINT: Imaging of formaldehyde-fixed cells can be done at any time most convenient. However, it is recommended to verify the sorting efficiency of aged cells before proceeding with the rest of the protocol. Cells can be stored for up to 48 h in formaldehyde fixation media at 4 °C. For long-term storage, exchange the formaldehyde-containing solution with sorbitol (1.2 M) and store at -20 °C. - Before imaging, centrifuge formaldehyde-fixed cells for 2 min at 1,900 x g. Pipette off supernatant into a dedicated formaldehyde waste container.
- Resuspend in 20 μL of sorbitol (1.2 M). Add 3.3 μL of cell suspension to a standard slide and apply a 22 x 22 mm coverslip.
- Acquire a z-stack including the complete volume of cells in DAPI, mCherry, FITC, and differential interference contrast (DIC) channels to assess the number of bud scars, biotin label, and Pma2-GFP (Figure 1C and Figure 4A; shown in magenta, yellow, and cyan, respectively).
- Continue to acquire at least 50 cells per condition.
5. Image analysis to assess biotin labeling efficiency and the number of bud scars
PAUSE POINT: Image analysis to verify age separation can be done at any point most convenient. However, it is recommended to verify sorting efficiency before proceeding with the rest of the protocol.
NOTE: Images are quantified using custom semi-automated Fiji/ImageJ (ImageJ2, V. 2.14.0/1.54m)20,21 macros. Specific notes on macro inputs are noted in the header of each macro and need to be adapted to individual input data.
- Open Fiji/ImageJ. Drag and drop the macro Manual ROI Selection and TIFF Export (Supplementary File 1) into Fiji/ImageJ to open.
- Click Run in the macro window. Choose the input and output folders as prompted and click OK.
- Draw a rectangle around cells of interest and add each rectangle to the region of interest (ROI) manager either manually or by using the shortcut t. Include the entire cell within the rectangle and leave a margin of approximately one cell diameter on each side.
- Once all ROI`s are added to ROI manager from the first image, click OK on the prompt window: Action Required (all ROI selected and saved to ROI manager (t)?) (Supplementary Figure 1). All chosen ROI´s will be cropped and saved automatically. The next image in the input folder will be opened automatically.
- Repeat steps 5.3–5.4 for all images in the input folder. Macro stops once it cycles through all images in the input folder. Drag and drop the macro Single-Cell 3D and Z Projection (Supplementary File 2) into Fiji/ImageJ to open.
- Adapt slice spacing in the 3D Project… command if required. Click Run in the macro window. Choose the input and output folders as prompted and click OK.
NOTE: Macro will run automatically, no input from the user needed. Macro stops once it cycled through all images in the folder. - Move all images called Y_projection… into a new input folder for counting. Drag and drop the macro Manual Budscar and Biotin Annotation (Supplementary File 3) into Fiji/ImageJ to open.
- Click Run in the macro window. Choose the input and output folders as prompted and click OK. Count bud scars by rotating the cell in 3D.
NOTE: Each DAPI and mCherry-positive ring-like structure is counted as one bud scar unless they overlap and represent the same bud scar event. The large filled circular biotin-positive (mCherry) mark on each cell from its birth is not counted towards total bud scar numbers (Figure 4A). - Click OK on the prompt window: Action Required (Number of bud scars?). Choose the counted number of bud scars on the prompt window, then click OK (Supplementary Figure 2).
- Determine whether the cell is biotin-labeled by examining the mCherry signal. If a cell was present during biotin labeling, the entire cell is mCherry-positive (Figure 4A).
- Click OK on the prompt window: Action Required (Biotin label: No = 0/ Yes = 1?). Choose 0 if the cell has no biotin label and 1 if the cell has a biotin label. In the Other prompt window, click OK (Supplementary Figure 3).
- Results will be automatically recorded in the Log window and saved as a .txt file in the output folder. Do not close the Log window during counting.
- The next image will be opened automatically. Repeat steps 5.9–5.13 for all images in the input folder. Macro stops once it cycled through all images in the input folder.
6. Assess the efficiency of gametogenesis and analyze the age of tetrads
NOTE: It is important to re-verify the tetrad age separation to exclude gametogenesis-specific de-enrichment of aged cells. Use the same analysis pipeline as for pre-gametogenic cells described in step 5 (Image analysis to assess biotin labeling efficiency and number of bud scars), with the difference that only tetrads are cropped and used for analysis for post-gametogenic conditions, as only gametes within tetrads will survive Zymolyase treatment and thus contribute to the gamete population. Images are quantified using custom semi-automated Fiji/ImageJ (ImageJ2, V. 2.14.0/1.54m)20,21 macros. Specific notes on macro inputs are noted in the header of each macro and need to be adapted to individual input data.
PAUSE POINT: Counting of sporulation efficiency can be done after setting up spore separation by setting aside an aliquot (100 μl) of the initial culture in a centrifuge tube for counting.
- Count sporulation efficiency by determining the number of monads, dyads, and tetrads for 300 cells from each culture using a light microscope.
- After 24 h in gametogenesis-inducing media, aliquot 135 μL of diluted post-gametogenesis culture (from step 4.3) to tubes containing 15 μL of formaldehyde (37%).
- Rotate and incubate at room temperature for 15 min. Store at 4 °C.
PAUSE POINT: If age sorting has been assessed for pre-gametogenic cells, imaging of formaldehyde-fixed tetrads can be done at any time most convenient. Cells can be stored for up to 48 h in formaldehyde fixation media at 4 °C. For long-term storage, exchange the formaldehyde-containing solution with sorbitol (1.2 M) and store at -20 °C. - Before imaging, centrifuge formaldehyde-fixed cells for 2 min at 1,900 x g. Pipette off supernatant into a dedicated formaldehyde waste container.
- Resuspend in 20 μL of sorbitol (1.2 M). Add 3.3 μL of cell suspension to a standard slide and apply a 22 x 22 mm coverslip.
- Acquire a z-stack including the complete volume of cells in DAPI, mCherry, FITC, and DIC channels to assess the number of bud scars, biotin label, and PMA2-GFP (Figure 1D and Figure 4A; shown in magenta, yellow, and cyan, respectively).
- Continue to acquire for at least 50 tetrads per condition.
PAUSE POINT: If age sorting has been assessed for pre-gametogenic cells, analysis of biotin labeling efficiency and the number of bud scars on tetrads can be done at any time that is most convenient. - Analyze the biotin labeling efficiency and number of bud scars of post-gametogenic tetrads as described in step 5.
7. Separation of tetrads into single gametes
NOTE: After Zymolyase treatment, cells are very sticky; take care when resuspending cell pellets to avoid aspirating or losing them. Prepare YPD (2% dextrose) + ampicillin (100 µg/mL) fresh and filter-sterilized on the day of the experiment to eliminate any unwanted debris or precipitation.
CAUTION: β-mercaptoethanol is toxic and volatile; handle it in a fume hood wearing appropriate PPE.
- After 24h in gametogenesis-inducing media, transfer cultures (from step 4.3) to 15 mL conical tubes. Centrifuge for 2 min at 1,900 x g decant the supernatant.
- Resuspend in 900 μl sterile deionized H2O and transfer to 1.5 mL low adhesion tubes. Add 100 μL of Zymolyase (1 mg/mL).
- In a fume hood, add 2 μL of β-mercaptoethanol. Seal tubes with parafilm, transfer to a rotating rack, and incubate for 3 h at 30 °C (Figure 1D).
- After 3 h of incubation, transfer the suspension to a 15 mL conical tube. Pipette carefully: cells are very sticky. Centrifuge samples for 2 min at 1,900 x g. Pipette off the supernatant completely and carefully, avoiding the sticky pellet, then resuspend in 1 mL of sterile deionized H2O.
- Repeat step 7.4 once. Sonicate samples with a hand sonicator (Figure 1D). Sonicate samples for 20 seconds at 1 pulse/second and 50% duty cycle. Put samples on ice for 1 minute between each sonication cycle.
- Wash the sonicator with 70% ethanol between samples. Repeat the sonication procedure described in step 7.5 five more times for a total of six sonication cycles.
- Verify tetrad separation using a light microscope (Figure 3B). Add 1 mL of YPD (2% dextrose) + ampicillin (100 µg/mL) (filter sterilized on the day of the experiment) to each sample.
- Re-dilute to OD600 = 0.8 with YPD (2% dextrose) + ampicillin (100 µg/mL). Volume depends on the total yield of separated cells.
NOTE: The maximum volume is 12 mL if 15 mL conical tubes are used. - Filter cultures through a pre-separation filter into a fresh 15 mL conical tube. Transfer to a rotating rack, incubate at 30 °C for 3 h before loading into microfluidic devices (Figure 1D).
8. Microfluidic device preparation
NOTE: This section describes the setup of microfluidic devices (Figure 2A–C) according to the manufacturer’s recommendations, using an inverted fluorescence microscope with an environmental control chamber. Use 70% Ethanol to sterilize the work area, scissors, tubing, and gloves throughout setup to reduce the risk of introducing contamination. To decrease the risk of cell clumping and clogging during the experiment, Pluronic F-127 is added to the growth media. Dissolve 5 g of Pluronic F-127 powder (10 g/L) in 500 mL of YPD (2% dextrose) media one day before the experiment, add ampicillin (100 µg/mL), and filter-sterilize 1–2 h before use. Make sure no air bubbles remain in media syringes and tubing during microfluidic device setup.
- Dissolve 5 g of Pluronic F-127 powder (10 g/L) in 500 mL of YPD (2% dextrose). Prepare one day prior to the experiment and let it dissolve overnight. On the day of the experiment, add ampicillin (100 µg/mL) to YPD (2% dextrose), Pluronic F-127 (10 g/L).
- Filter sterilize YPD (2% dextrose) + ampicillin (100 µg/mL) + Pluronic F-127 (10 g/L). Let it sit for 1–2 h before loading the media pumps to remove air bubbles introduced during filtration.
- Inspect the microfluidic device for any damage, such as cracked cover glass. Plug the cell loading inlet ports with solid stainless-steel pins (Figure 2A,D,E).
NOTE: Care must be taken not to insert solid stainless-steel pins too deeply into cell loading ports, as this can make removal difficult during cell loading. - Cut tubing for media outlet at necessary length to connect media outlet port to waste collection container, allowing slack for stage movement during imaging (Figure 2A,G).
- Connect hollow stainless-steel pins to media outlet tubing. Plug hollow stainless-steel pins and tubing into media outlet ports (Figure 2D–F). Add oil to the microscope objective and the cover glass on the microfluidic device.
- Mount the microfluidic device onto the microscope (Figure 2G). Find the focal plane of imaging units and inspect the integrity of polydimethylsiloxane (PDMS) U-trap structures (Figure 2C).
- Direct tubing from media outlet port into a waste container (Figure 2G). Tape media outlet tubing to the microscope stage (Figure 2G, green tape).
- Make sure the media outlet tubing is well above the bottom of the waste container to avoid tubing being submerged in waste media that will accumulate during the experiment, creating back pressure.
- Shorten media outlet tubing if necessary. Cut the media inlet tubing to the necessary length to connect the media inlet port to the media syringes placed on the micropumps. Allow slack for stage movement during imaging.
- Connect hollow stainless-steel pins to the media inlet tubing. Open the 20 mL syringe package and expel air completely.
- Take up 20 mL of YPD (2% dextrose) + ampicillin (100 µg/mL) + Pluronic F-127 (10 g/L) into 20 mL syringes. Connect a syringe adapter to the media syringe head.
- Ensure the syringe adapter is screwed on tightly. Connect the media inlet tubing to the media syringe adapter. Tape the other end of the media inlet tubing to a waste collection container so that the hollow stainless-steel pin faces the container.
- Carefully expel remaining air bubbles from the media syringe. Hold the media syringe vertically, letting air bubbles rise towards the syringe head. Apply pressure to expel air bubbles and media through the tubing into the waste container.
- Gently tap the syringe side against a table while holding it upright to release any remaining air bubbles, then reapply pressure until all air bubbles are expelled. Check the tubing and syringe carefully for any remaining air bubbles.
- Mount the media syringe onto the micropump. If using a micropump with multiple slots, repeat the syringe preparation described in steps 8.10–8.14 for each additional syringe and mount each prepared syringe onto the micropump until all desired slots are filled. Move the micropump plunger forward until it engages with the syringe plungers, and media starts to be expelled through the tubing of all syringes.
- Insert the hollow stainless-steel pins, connected to tubing and a media syringe, into the media inlet port of the mounted microfluidic device (Figure 2A,H,I).
- Start the pump with a flow rate of 2.4 µL/min once all syringes mounted on the micropump are plugged into the microfluidic device. Tape tubing connected to the media inlet port to the microscope stage (Figure 2I, green tape in the background).
- Ensure slack in tubing lines to allow for stage movement during imaging. Turn on the environmental chamber and set it to 30 °C. Run media pumps for at least 2 h before loading cells, to prime imaging units with media.
- Take test images of ROI after approximately 1 h of media flow to test focal plane differences across a single imaging unit.
- Depending on the microscope and magnification, acquire for each chamber, 2 x 27 images and three z-slices per position with 3–8 µm spacing, to compensate for focal plane differences across a single imaging unit.
- Stop the pumps 1 h before cell loading to reduce pressure and make loading easier.
9. Loading of gametes into microfluidics devices
NOTE: Cell loading for all conditions must be completed in less than 1 h to avoid premature cell divisions of gametes. Failure to do so will lead to dilution of gametes by newly generated daughter cells and imprecise assessment of total replicative lifespan. For each condition and genotype, two imaging units are loaded to acquire two technical replicas for analysis.
- Cut tubing for cell loading at the necessary length to connect the cell loading inlet with the syringe. Connect hollow stainless-steel pins to cell loading tubing. Connect a syringe adapter to the head of a 5 mL syringe.
- Connect the cell loading tubing to the syringe adapter on the 5 mL syringe. After 3 h of re-growth (step 7.9), check if most gametes have initiated growth. Check for enlarged gametes and emerging buds using a light microscope.
- Aliquot 2 mL of the first condition to be loaded into a 2 mL centrifuge tube. For each condition, do steps 9.3–9.15 one by one. Remove the solid stainless-steel pin from the two imaging units that will be loaded with cells from a specific condition to release pressure.
- Sonicate aliquoted cells with a hand sonicator (five pulses at 1 pulse/second and 50% duty cycle) right before taking up into a syringe. Pass sonicated cell suspension through pre-separation filter (30 µm) into a new 2 mL centrifuge tube.
- Load the cell suspension into the prepared 5 mL syringe through the hollow stainless-steel pin and connected tubing. Expel air from the syringe containing the cell suspension, ensuring no air remains in the syringe and tubing.
- Push the syringe plunger until a small drop of liquid appears on the hollow stainless-steel pin. Insert a hollow stainless-steel pin into the cell-loading inlet of the microfluidic device.
- Ensure no air is introduced by connecting a liquid drop from a stainless-steel pin directly to the cell loading inlet. Use a rolled-up lint-free laboratory wipe to dab excess liquid off the microfluidic device.
- Load cells manually by applying pressure carefully to the syringe plunger while observing the imaging unit directly on the microscope with live view. Apply pressure to the plunger until PDMS U-trap structures begin to warp slightly.
- Maintain pressure continuously and wait until cells start to flow into the imaging area. Do not apply excessive pressure, as this can lead to overloading and/or detachment of PDMS structures from the cover glass, rendering the imaging unit useless.
- Release pressure once cells start to load into traps and monitor loading efficiency across the imaging unit. Reapply pressure to repeat the loading cycle until enough cells are trapped.
- Repeat loading cycle if fewer than 200 traps are occupied. Optimally loaded units will have cells occupying 2/3 of the traps, balancing sufficient loading and the risk of overloading, which increases the risk of clogging during the experiment.
- If shared pumps are used for different imaging units and one imaging unit becomes overloaded, the tubing of the affected unit is disconnected from the media pump to prevent the pump from stalling due to clogging and to avoid loss of additional experimental conditions (Figure 2J).
- Remove the hollow stainless-steel pins from the cell loading inlet once sufficient cells have been loaded. Carefully re-plug the solid stainless-steel pin slowly into the cell loading inlet port.
- Avoid inserting the solid stainless-steel pin too deeply or too quickly into the loading port, as this can cause a sudden increase in pressure in the imaging unit, leading to the loss of trapped cells. Load the second channel for the same condition, starting over at step 9.6.
- Remove the solid stainless-steel pin from the imaging units to be loaded next, then start over at step 9.3 to load the next condition. Repeat until all conditions are loaded.
- Using live view on the microscope, inspect all loaded imaging units, assuring sufficient and stable loading and confirming that the unit is not overloaded. Once all imaging units connected to the micropump are loaded and appropriate cell loading is confirmed, start the micropump at a constant flow rate of 2.4 µL/min.
- Inspect the microfluidic device carefully for any leakage from re-plugged loading ports once media flow is resumed. If leaking is observed: unplug and carefully re-plug the solid stainless-steel pin.
- If the leak cannot be stopped, disconnect the affected imaging unit from the media pump by removing the tubing from the 20 mL media syringe adapter (Figure 2J). If the imaging unit is overloaded, unplug the imaging unit from the media pump by unplugging the tubing from the syringe adapter at the 20 mL media syringe head.
10. Image acquisition
NOTE: Once pumps are running and quality control has been completed, gametes are identified by imaging the entire field of view (areas containing trapped cells) for each chamber in the FITC and brightfield channels at the t0 timepoint (Figure 1E and Figure 3D,E). Imaging conditions depend on the specific system and experimental need and can be adapted accordingly. For example, using a 40x objective, 2 x 27 images and three z-slices per position with 3–8 µm spacing, to compensate for variable focal plane differences across a single unit, are acquired in FITC and brightfield channels. After acquisition of t0, time-lapse imaging of the same field of view is performed at 15–20 min intervals for 72 h to cover the complete replicative lifespan of gametes (Figure 3D,E). Time-lapse imaging is performed only in the DIC channel to avoid cumulative phototoxicity by repeated imaging in the FITC channel.
- Once micropumps are running, re-verify all ROIs and focal planes for all loaded imaging units. Acquire the first timepoint (t0) in the FITC and DIC channels for all ROIs to identify gametes (GFP-positive) (Figure 1D and Figure 3C).
- After acquisition of t0, start time-lapse imaging with intervals of 15–20 min for a total of 72 h, acquiring only in the DIC channel (Figure 1E and Figure 3D,E). Monitor the device sporadically during the experiment for any spontaneous leaks. If leaks are observed, unplug the corresponding syringe to prevent large-scale pump failures or media spillage into the microscope.
- Once the timelapse is completed, transfer data and proceed with cleanup.
11. Cleanup
- Stop pumps 30 min prior to cleaning up after time-lapse acquisition is completed. Remove media syringes from micropumps and shut off pumps. Unplug hollow stainless-steel pins connected to the tubing and media syringe.
- Remove the microfluidic device from the microscope and unplug all stainless-steel pins. Clean off the oil from the microscope objective.
- Discard the microfluidic device and stainless-steel pins into dedicated waste containers. Transfer data and shut down the microscope.
12. Replicative lifespan analysis of gametes
NOTE: To quantify gamete replicative lifespan upon completion of a time-lapse experiment, images are processed, and gamete replicative lifespan is counted (Figure 1F). Processing depends on the microscope setup and needs. Briefly, brightfield time-lapse images from each condition (same imaging unit) are stitched together to form a hyper-stack. If necessary, the brightfield time-lapse hyper stack and t0 FITC images are cropped and resized so that the X-Y coordinates of a specific point are the same across images. Images are quantified using custom semi-automated Fiji/ImageJ (ImageJ2, V. 2.14.0/1.54m)20,21 macros. Specific notes on macro inputs are noted in the header of each macro and need to be adapted to individual input data. Replicative lifespan is measured for 200 cells per technical replicate for each genotype and condition. Counts from two technical replicas are concatenated to obtain robust replicative lifespan measurements. The experiment is repeated to obtain an individual biological replica.
PAUSE POINT: Image analysis to assess the replicative lifespan of gametes can be performed at any convenient point once the experimental part of the protocol is completed.
- Open t0 FITC image for a specific microfluidics unit. Choose the input and output folders as prompted and click OK.
- Draw a rectangle around FITC-positive gamete loaded into microfluidic trap and add the rectangle to ROI manager (shortcut t). Do not crop tightly around the cell; leave a margin of approximately one trap width on each side. (Figure 1D, Figure 3C, and Supplementary Figure 4).
- Continue until all FITC-positive gametes are added to the ROI manager (Supplementary Figure 5). Go to the ROI manager and select all points. Click on More and Save.
- Save ROI list to output folder. Drag and drop the macro Manual ROI Crop and TIFF Export - Open Images (Supplementary File 4) into FIJI/ImageJ to open.
- Select the last ROI in the list and click Run in the macro window: Manual ROI Crop and TIFF Export - Open Images (Supplementary File 4). Choose the output folder following the prompts to start the macro.
- Macro starts duplicating and saving all chosen ROI`s to the specified output folder. Macro stops once it duplicates and saves all ROI´s.
- Close t0 FITC image. Open brightfield time-lapse hyper stack for the same microfluidics unit. If not already open, drag and drop the macro Manual ROI Crop and TIFF Export - Open Images (Supplementary File 4) into Fiji/ImageJ to open.
- If not already open, drag and drop the saved ROI list from the t0 FITC image into Fiji/ImageJ to open. Select the last ROI in the list and click Run on macro: Manual ROI Crop and TIFF Export - Open Images (Supplementary File 4).
- Choose the output folder following the prompts to start the macro and click OK. Macro starts duplicating and saving all chosen ROI`s to the specified output folder.
- Macro stops once it duplicates and saves all chosen ROIs. Close brightfield time-lapse hyper stack.
- Drag and drop the macro Manual GFP, RLS, and Terminal Phenotype Annotation (Supplementary File 5) into Fiji/ImageJ to open. Click Run in the macro window.
- Choose the input and output folders as prompted, then click OK. Inspect t0 FITC to make sure a gamete (GFP-positive cell) is loaded. Compare t0 FITC image and t0 brightfield time-lapse to make sure the same cell is still loaded in t0 brightfield time-lapse (Figure 3C).
- Click OK on the prompt window: Action Required (GFP cell trapped Y/N?) (Supplementary Figure 6). If the t0 FITC cell is not GFP positive, choose 0 on the prompt window.
- If the cell loaded in t0 brightfield time-lapse is not the same cell as loaded in t0 FITC image, choose 0 on the prompt window. If the t0 FITC cell is GFP positive and the cell loaded in t0 brightfield time-lapse is the same cell as loaded in t0 FITC image, choose 1 on the prompt window (Supplementary Figure 7). Click OK on the prompt window once the GFP cell decision is made.
- Count replicative lifespan by assessing how many daughter cells emerge from the loaded gamete before it reaches either a terminal phenotype (ceases to divide) or ejects from the trap (is lost from ROI).
- Once replicative lifespan has been counted, click OK on the prompt window: Action Required (RLS of cell?) (Supplementary Figure 8). In the prompt window, choose how many divisions have been observed (RLS) (Figure 3D,E; Supplementary Figure 9).
- Once RLS has been reported, click OK on the prompt window. Determine if the cell has reached the terminal phenotype or has been ejected from the trap before ceasing to divide.
- Click OK on the prompt window: Action Required (Terminal?) (Supplementary Figure 10). In the prompt window, choose 0 if the cell is ejected while still dividing, before the terminal phenotype has been observed.
- In the prompt window, choose 1 if a terminal phenotype has been observed (Supplementary Figure 11). In the prompt window, choose “?” if unclear.
- Click OK in the prompt window once the terminal fate decision has been made. Click OK in the prompt window: Action Required (Reason?) (Supplementary Figure 12).
- If the cell is ejected before reaching the terminal phenotype, choose the ejection cell fate: “ejected” = cell ejected while still dividing; if the cell reached the terminal phenotype choose terminal cell fates: (a) ejected/done = cell acquired terminal morphology but ejected within 3 h of last division; (b) enlarged = cell enlarged and ceased to divide; (c) failed division and enlarged = cell failed to separate during last division and ceased to divide; (d) shriveled up = cell no longer divides and shows a shrunken, shriveled morphology (Supplementary Figure 13); (e) other = any other class that does not fit descriptions above.
- Click OK on the prompt window once the terminal cell fate decision has been made. Results from all prompts will be automatically recorded in the Log window and saved as a .txt file in the output folder.
- Do not close the Log window during counting. The next image in the input folder will open automatically. Repeat steps 12.12–12.22 until the script has cycled through all images in the input folders.
Results
Assessment of replicative age separation and efficiency of gametogenesis
To compare the replicative lifespan of gametes from precursor cells of different ages, sufficient age separation and purity of cell populations must be ensured. To increase the purity of the obtained aged cell populations to 90–100%, a critical adaptation to the standard age separation protocol was made, where the aged cell eluate from a first sort is re-applied to a new column for a second sort9. To evaluate the purity and age of double-sorted aged and young cell populations, staining against bud scars and biotin is performed, and approximately 50 cells are imaged for each condition. Wheat germ agglutinin specifically binds to bud scars, which are chitin-rich ring-like structures on the yeast cell wall, one of which is left after each budding event, thus revealing the precise replicative age of a cell (Figure 1C and Figure 4A)22. Images of pre-gametogenic cells are analyzed following the image analysis pipeline described in step 5 of the protocol.
The consecutive-sort protocol described here consistently results in young cell populations with only approximately 3.63% biotinylated cells and a mean replicative age of 1.16, and aged cell populations containing approximately 96.74% biotinylated cells with a mean replicative age of 8.55 (Figure 4B,C)9. If the purity of either the aged or the young cell population, assessed by biotin staining, is below 80%, the experiment is discontinued. In an optimal experiment, the difference in mean age between young and aged cell populations is at least 6 divisions; if the separation is lower than 4 divisions, the experiment is discontinued.
The efficiency of gametogenesis is analyzed after 24 h in gametogenesis-inducing media. Under the described conditions, 79.8% of young cells and 78.89% of aged cells successfully form visibly distinct tetrads in the control genotype (Figure 4D)9. Low gametogenesis efficiency is not a strict bottleneck for this protocol, but it will reduce gamete yield, making downstream steps more challenging and less reproducible. Therefore, if the efficiency of gametogenesis is below 30%, cell input for sorting is doubled (4 x 8 OD600) to ensure a high enough yield of gametes from aged precursor cells.
Post-gametogenic tetrad populations from young precursor cells reproducibly have a purity of 13.38% biotinylated cells and a mean replicative age of 1.31, while those from aged cells have a purity of 97.34% biotinylated cells and a mean replicative age of 8.17 (Figure 4E,F)9. Further assessments must be made if, in a specific genotype, the purity of sorted tetrad populations changes by more than 20% or the mean age of aged tetrads decreases by more than 3 divisions relative to pre-gametogenic aged cell populations (Figure 4E,F).
In summary, consecutive magnetic bead sorting enables efficient age separation of pre-meiotic cells, with comparable gametogenesis efficiencies in both young (79.8%) and aged (78.89%) cells. Replicative age and purity of cell populations are analyzed twice: before and after gametogenesis. Re-verifying the age separation of tetrads is important to exclude the possibility that a given mutation interferes with gametogenesis in an age-dependent manner, leading to gametogenesis-specific de-enrichment of aged cells.
Assessment of gametogenic rejuvenation
Pre-gametogenic wild-type cells were sorted into young and aged cell populations, and gametogenesis was induced as described here. Bud scars per tetrad were quantified to determine the replicative age of populations prior to gamete separation and gamete replicative lifespan acquisition (Figure 5A)9. Following time-lapse imaging, quantifying and comparing the replicative lifespan of gametes derived from young and aged precursor cells showed similar median replicative lifespans for gametes derived from young and aged precursor cells (21 and 22 divisions, respectively; p = 0.982; Figure 5B), confirming that the protocol described here captures gametogenic rejuvenation.
Using this approach, we identify that degradation of damaged cellular components via selective autophagy is necessary for gametogenic rejuvenation9. Autophagy pathways, which mediate the degradation of damaged components via the vacuole, decline with age, leading to an increase in damaged cellular components23,24. Atg11, the main selective autophagy scaffold protein required for recruitment of the core autophagy machinery to selective autophagy receptors marking specific cargos, is dynamically upregulated during gametogenesis9. To test if clearance of damage via selective autophagy is important for gametogenic rejuvenation, pre-gametogenic atg11Δ cells were sorted into young and aged cell populations, and gametogenesis was induced following the protocol described here. After the replicative age of the tetrad population was confirmed by quantifying bud scars per tetrad (Figure 5C)9, tetrads were separated, and the gamete replicative lifespan was acquired. Quantifying median replicative lifespan of atg11Δ gametes from young and aged precursors revealed that gametes from aged precursor cells had a significantly and reproducibly shorter replicative lifespan than gametes from young atg11Δ precursor cells (Figure 5D, Rep.1, p = 2 x 10⁻⁶, Rep.2, p = 3 x 10⁻⁶ compared to Figure 5B)9. This result suggests that selective autophagy via Atg11 plays a crucial role in the full rejuvenation of gametes derived from aged precursor cells and shows that the workflow described here can reveal components necessary to produce fully rejuvenated gametes.
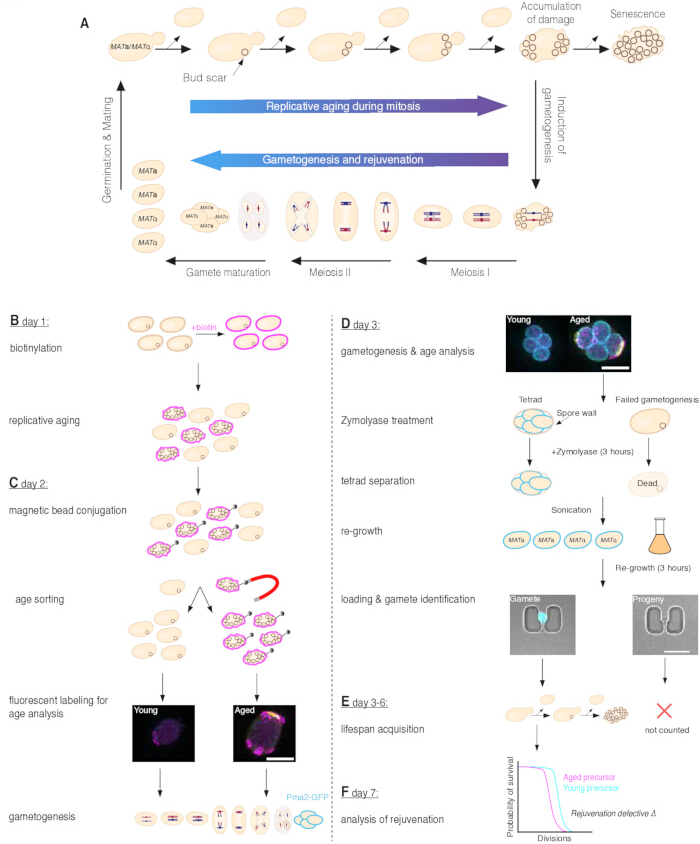
Figure 1. Gametogenic rejuvenation and a pipeline to assess the replicative lifespan of gametes. (A) During vegetative growth, budding yeast divides asymmetrically. Newly formed daughter cells are born young, whereas mother cells progressively accumulate age-associated damage and eventually become senescent. The replicative age of an individual yeast cell is indicated by the number of bud scars, which form after each division and remain on the mother cell wall (top panel). Gametogenesis is induced by nutrient depletion (downward arrow, right). During this process, diploid yeast divides symmetrically, producing tetrads containing four equally young haploid gametes of two mating types. Gamete replicative lifespan is fully reset even in gametes derived from replicatively aged precursor cells (bottom panel). Upon addition of nutrients, gametes germinate, resume mitotic growth, and form diploid cells upon mating of the two mating types (upward arrow, left). (B) Founder cells are labeled with biotin on day 1 and cultured overnight in rich medium at the optimal growth temperature to generate replicatively aged founder cells and young daughter cells. (C) On day 2, biotin-labeled founder cells are conjugated to magnetic beads, followed by magnetic age sorting to separate aged founder cells from young daughter cells. Biotin and bud-scar fluorescence are subsequently assessed to determine sorting efficiency and verify the replicative ages of the separated populations. The cells are then incubated overnight in gametogenesis-inducing medium to generate tetrads expressing Pma2-GFP. (D) On day 3, gametogenesis efficiency, biotin labeling, and bud scars are assessed to verify gametogenesis and the age distributions of the populations. Tetrads are treated with Zymolyase for 3 h to digest the spore wall and lyse cells that failed to progress through gametogenesis, followed by mechanical separation by sonication. Separated gametes are allowed to regrow to facilitate retention in the microfluidic U-traps and are subsequently loaded into the microfluidic device. Representative images show a Pma2-GFP-positive gamete (left) and Pma2-GFP-negative gamete progeny (right) trapped in the U-trap and visualized by brightfield and Pma2-GFP fluorescence (cyan). (E) Gamete replicative lifespan is measured using microfluidics-based long-term time-lapse imaging during days 3–6 of the protocol. (F) Hypothetical outcome after analysis of gamete replicative lifespan in a rejuvenation-defective background on day 7 of the protocol. Scale bars = 5 µm. This figure is adapted from Spiri et al.9. Please click here to view a larger version of this figure.
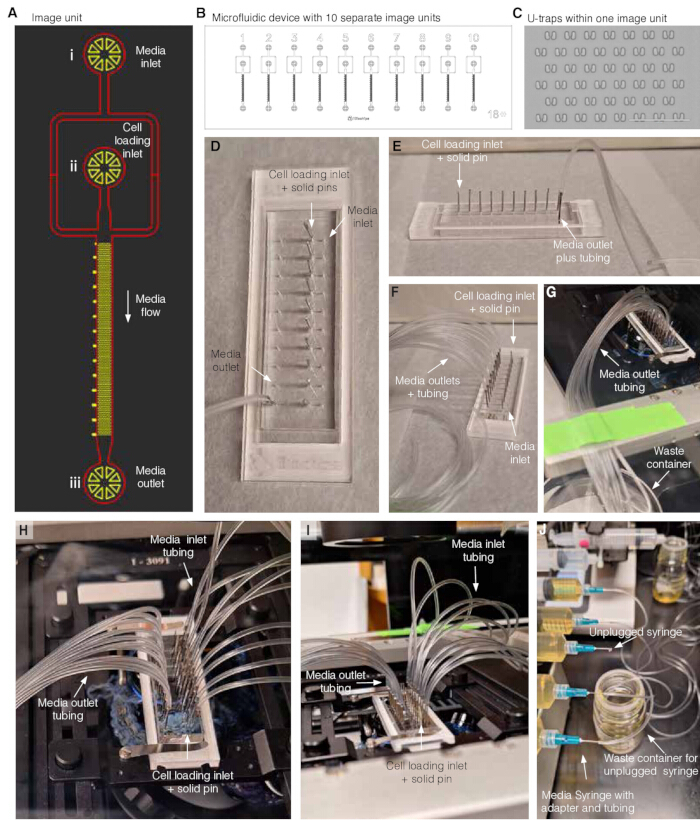
Figure 2. Microfluidic device preparation. (A) Schematic overview of one imaging unit. (i) Media inlet; (ii) cell loading inlet, and (iii) media outlet. During the experiment, fresh media flows from the media inlet (i) to the media outlet (iii) while the cell loading inlet (ii) is plugged with a solid stainless-steel pin. (B) Schematic overview of one microfluidic device containing 10 separate imaging units. (C) Image of PDMS U-traps and spacing in one imaging unit, scale bar is 100 µm. (D) Top view of microfluidic device with solid stainless-steel pins plugged into all cell loading inlets and hollow stainless-steel pin plus tubing plugged into one media outlet for media flow-through collection. (E) Side view of microfluidic device with solid stainless-steel pins plugged into all cell loading inlets and a hollow stainless-steel pin plus tubing plugged into one media outlet for media flow-through collection. (F) Microfluidic device with solid stainless-steel pins plugged into all cell loading inlets and hollow stainless-steel pins plus tubing plugged into all media outlets for media flow-through collection. (G) Microfluidic device with solid stainless-steel pins plugged into all cell loading inlets and hollow stainless-steel pins plus tubing plugged into all media outlets for media flow-through collection mounted on a microscope. Tubing for media flow-through collection is taped (green tape) to the microscope stage and directed into the waste collection container. (H) Microfluidic device with solid stainless-steel pins plugged into all cell loading inlets, hollow stainless-steel pins plus tubing plugged into all media outlets, and hollow stainless-steel pins plus tubing connected to media syringes plugged into all media inlets mounted on a microscope. (I) Microfluidic device with solid stainless-steel pins plugged into all cell loading inlets, hollow stainless-steel pin plus tubing plugged into all media outlets, and hollow stainless-steel pin plus tubing connected to media syringes plugged into all media inlets mounted on a microscope. Tubing from media syringes is taped to the microscope stage (green tape in background). (J) Example of how to unplug the media syringe from the microfluidic device in case of a leakage or an overloaded imaging unit. Figure 2A–C are adapted from Jo et al.15. Figure D–J are adapted from Spiri et al.9. Please click here to view a larger version of this figure.
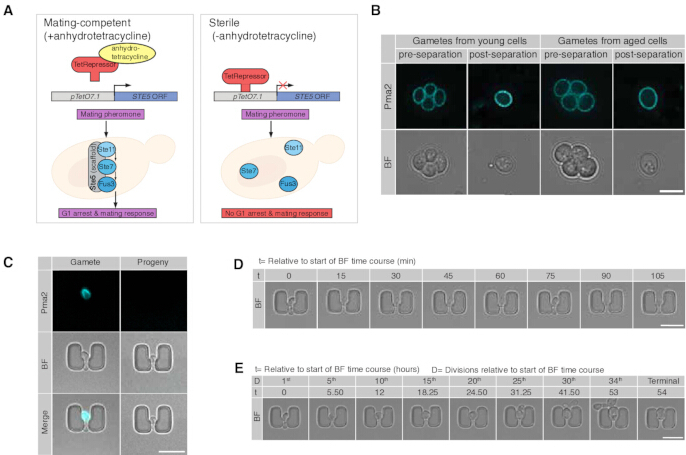
Figure 3. Gamete preparation for microfluidics-based acquisition of gamete replicative lifespan. (A) Schematic depiction of the genetic system to achieve conditional sterility. The endogenous promoter of STE5, a scaffold protein necessary for signal transduction upon mating pheromone sensing, is replaced with pTetO7.1 promoter fragment. In the baseline state, the Tet Repressor protein (TetR), expressed under a constitutive promoter, binds pTetO7.1 and represses transcription from this promoter. Addition and binding of anhydrotetracycline induce a conformational change in the Tet Repressor, reducing its affinity to pTet07.1 and thus, de-repressing transcription of STE5. (B) Representative single z-slices of pre- and post-separated young (left panel) and aged (right panel) tetrads and gametes, respectively, visualizing brightfield and Pma2-GFP (cyan). (C) Representative Pma2-GFP positive gamete (left panel) and Pma2-GFP negative gamete progeny (right panel) trapped in microfluidics-based devices, visualizing brightfield and Pma2-GFP (cyan). (D) Representative trapped gamete divides twice over a period of 2 h. (E) Representative gamete trapped in a microfluidics imaging unit, visualizing every 5th division until the terminal 34th division over the timespan of 54 h. Scale bars = 5 µm. This figure is adapted from Spiri et al.9. Please click here to view a larger version of this figure.
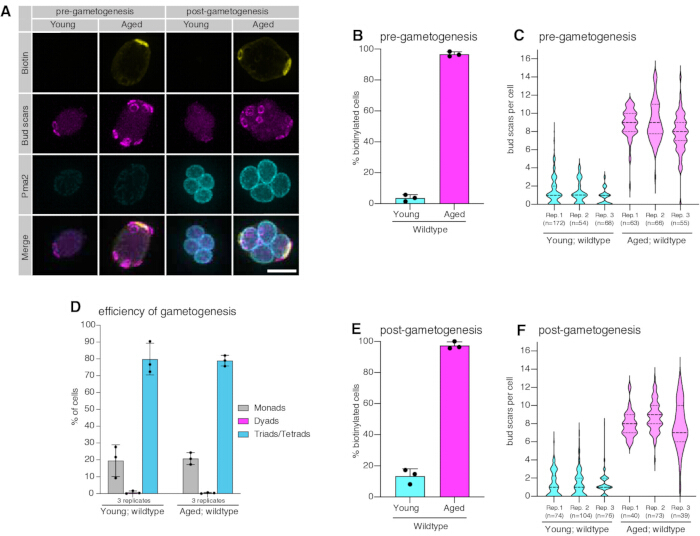
Figure 4. Quantification of replicative age and gametogenesis efficiency. (A) Representative age sorted pre-gametogenic max-intensity projected cells (left panel) and post-gametogenic tetrads (right panel) visualizing biotin using fluorescently labeled streptavidin (yellow), chitin-rich bud scars visualized with fluorescently labeled wheat germ agglutinin (magenta), and Pma2-GFP (cyan). (B) Quantification of the fraction of biotinylated cells in young (3.63 ± 2.12 %, mean ± standard deviation (SD), 3 replicas, n = 172, 54, and 68, respectively) and aged (96.74 ± 1.58 %, mean ± SD, 3 replicas, n = 63, 66, and 55, respectively) wildtype cell populations, error bars represent SD. (C) Quantification of replicative age by assessing the number of bud scars in young (1.16 ± 0.41, mean ± SD, n = 3 replicas, n = 172, 54, and 68, respectively) and aged (8.55 ± 0.66, mean ± SD, 3 replicas, n = 63, 66, and 55, respectively) wildtype cell populations. (D) Quantification of the fraction of tetrads in young (79.8 ± 9.43%; mean ± SD, 3 replicas, Rep.1 and 3 n = 300, Rep. 2 n = 281) and aged (78.89 ± 3.17 %, mean ± SD, 3 replicas n = 300 each) post-gametogenic wildtype cell populations, error bars represent SD. (E) Quantification of the fraction of biotinylated tetrads in young (13.38 ± 4.74%, mean ± SD, n = 3 replicas, n = 74, 104, and 76, respectively) and aged (97.34 ± 2.33%, mean ± SD, 3 replicas, n = 40, 73, and 39, respectively) wildtype populations after completion of gametogenesis, error bars represent SD. (F) Quantification of replicative age by assessing the number of bud scars in young (1.31 ± 0.04, mean ± SD, 3 replicas, n = 74, 104, and 76 respectively) and aged (8.17 ± 0.54, mean ± SD, 3 replicas, n = 40, 73, and 39 respectively) wildtype tetrad populations. Scale bars = 5 µm. Confidence intervals were calculated using the Wilson score method. Violin plots indicate median (solid lines), 25th and 75th percentiles (dotted lines). This figure is adapted from Spiri et al.9. Please click here to view a larger version of this figure.
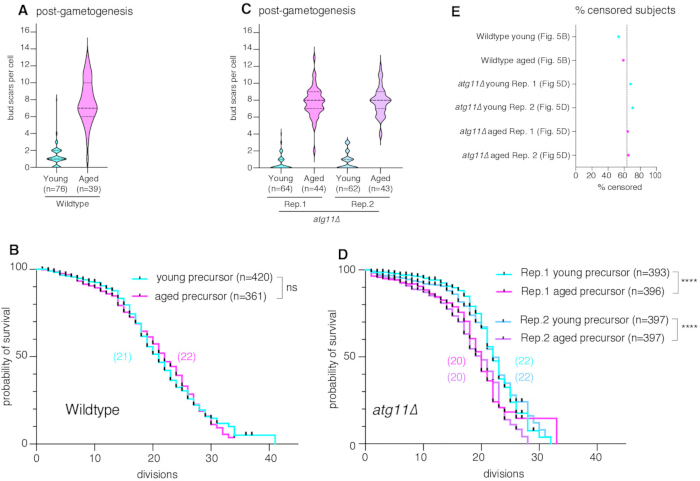
Figure 5. Quantification of replicative lifespan. (A) Quantification of replicative age by assessing the number of bud scars in young (1.3 ± 1.2, mean ± SD, n =76) and aged (7.8 ± 2.6, mean ± SD, n = 39) wildtype gamete populations, same data as shown in Figure 4F for Rep. 3. (B) Quantification of replicative lifespan of young (median lifespan = 21, n = 420, 223 censored subjects) and aged (median lifespan = 22, n = 361, 213 censored subjects, p = 0.982 compared to young) wildtype gametes. Counts from two technical replicates were concatenated. (C) Quantification of replicative age by assessing the number of bud scars in atg11Δ tetrad populations: Rep. 1 young (0.53 ± 0.91, mean ± SD, n = 64) and aged (7.8 ± 1.8, mean ± SD, n = 44); Rep. 2 young (0.82 ± 1, mean ± SD, n = 62) and aged (7.9 ± 1.7, mean ± SD, n = 43). (D) Quantification of replicative lifespan of atg11Δ gametes for two independent biological replicas: Rep.1 young (median lifespan = 22, n = 393, 267 censored subjects) and aged (median lifespan = 20, n = 396, 255 censored subjects, p = 2 x 10⁻⁶); Rep. 2 young (median lifespan = 22, n = 397, 280 censored subjects) and aged (median lifespan = 20, n = 397, 259 censored subjects, p = 3 x 10⁻⁶ compared to young). For each independent biological replica, counts from two technical replicates were concatenated. (E) Percentage of censored events over all lifespan experiments. Dashed line indicates mean (63.4% ± 6.2 mean ± SD) of censored subjects from n = 6 experiments. Statistical significance of differences in replicative lifespans was assessed using the Log-rank (Mantel-Cox) test; tick marks on survival curves represent censored events. Violin plots indicate median (solid lines), 25th and 75th percentiles (dotted lines). p values are indicated (ns = p > 0.05, * = p ≤ 0.05, ** = p ≤ 0.01, *** = p ≤ 0.001, **** = p ≤ 0.0001). This figure is adapted from Spiri et al.9. Please click here to view a larger version of this figure.
Supplementary Figure 1: Selection of regions of interest for bud scar analysis. Representative ImageJ screenshot showing individual cells selected using rectangular regions of interest (ROIs) and added to the ROI Manager for subsequent analysis. The selected ROIs are displayed as yellow boxes. Please click here to download this file.
Supplementary Figure 2: Manual entry of bud scar number. Representative ImageJ screenshot showing the dialog box used to manually enter the number of bud scars identified for each selected cell. Bud scars are counted by rotating the Y-projection and examining the wheat germ agglutinin signal. Please click here to download this file.
Supplementary Figure 3: Manual classification of biotin labeling. Representative ImageJ screenshot showing the dialog box used to record whether a selected cell is positive or negative for biotin labeling. A value of 1 indicates a biotin-positive cell, and a value of 0 indicates a biotin-negative cell. Please click here to download this file.
Supplementary Figure 4: Selection of regions of interest in a microfluidic device. Representative ImageJ screenshot showing individual microfluidic U-traps selected using rectangular ROIs and added to the ROI Manager. Each ROI encompasses a single U-trap for subsequent analysis. Please click here to download this file.
Supplementary Figure 5: Visualization of selected microfluidic U-trap ROIs. Representative ImageJ screenshot showing multiple rectangular ROIs overlaid on the microfluidic device after selection of individual U-traps. The ROIs are displayed simultaneously using the “Show All” function in the ROI Manager. Please click here to download this file.
Supplementary Figure 6: Identification of GFP-positive cells in microfluidic U-traps. Representative ImageJ screenshot showing the prompt used to determine whether a GFP-positive cell is trapped within the selected U-trap. A fluorescence image is displayed alongside the brightfield image to facilitate identification. Please click here to download this file.
Supplementary Figure 7: Manual classification of GFP-positive cells. Representative ImageJ screenshot showing the dialog box used to record GFP status for a cell within a selected U-trap. A value of 1 indicates a GFP-positive cell, whereas a value of 0 indicates a GFP-negative cell. Please click here to download this file.
Supplementary Figure 8: Manual entry of replicative lifespan. Representative ImageJ screenshot showing the dialog box used to enter the replicative lifespan (RLS) of an individual cell after reviewing the time-lapse image stack. RLS is determined as the total number of cell divisions observed. Please click here to download this file.
Supplementary Figure 9: Manual entry of replicative lifespan. Representative Fiji/ImageJ screenshot showing the dialog box used to enter the replicative lifespan (RLS) of an individual cell after reviewing the brightfield time-lapse image stack. RLS is recorded as the total number of observed cell divisions. Please click here to download this file.
Supplementary Figure 10: Assessment of terminal status during replicative lifespan analysis. Representative Fiji/ImageJ screenshot showing the “Terminal?” prompt used to determine whether the analyzed cell reached a terminal phenotype or was ejected from the trap before terminal arrest. Please click here to download this file.
Supplementary Figure 11: Recording of terminal status during replicative lifespan analysis. Representative Fiji screenshot showing selection of the terminal-status value after determining whether a terminal phenotype was observed. Please click here to download this file.
Supplementary Figure 12: Selection of terminal cell fate. Representative Fiji screenshot showing the prompt used to assign the reason for censoring or the terminal fate of an analyzed cell. Please click here to download this file.
Supplementary Figure 13: Classification of terminal cell morphology. Representative Fiji screenshot showing selection of the terminal phenotype, including the “shriveled up” classification for a cell that ceased dividing and exhibited a shrunken morphology. Please click here to download this file.
Supplementary File 1. Manual ROI Selection and TIFF Export Fiji macro. Custom Fiji/ImageJ macro used to manually select individual cells as regions of interest (ROIs), crop the selected ROIs, and export the cropped images as TIFF files for subsequent analysis. Please click here to download this file.
Supplementary File 2. Single-Cell 3D and Z Projection Fiji macro. Custom Fiji/ImageJ macro used to generate three-dimensional projections and Z-projection images of individual cropped cells for subsequent bud-scar and biotin-labeling analysis. Please click here to download this file.
Supplementary File 3. Manual Budscar and Biotin Annotation Fiji macro. Custom Fiji/ImageJ macro used to manually record the number of bud scars and classify individual cells according to biotin-labeling status. Please click here to download this file.
Supplementary File 4. Manual ROI Crop and TIFF Export – Open Images Fiji macro. Custom Fiji/ImageJ macro used to crop and export corresponding regions of interest from the t0 FITC images and brightfield time-lapse hyper-stacks for subsequent gamete replicative lifespan analysis. Please click here to download this file.
Supplementary File 5. Manual GFP, RLS, and Terminal Phenotype Annotation Fiji macro. Custom Fiji/ImageJ macro used to identify GFP-positive gametes, manually record replicative lifespan (RLS), determine terminal status, and classify terminal or ejection phenotypes during gamete replicative lifespan analysis. Please click here to download this file.
Discussion
Here, we provide a detailed protocol to measure the replicative lifespan of yeast gametes derived from differentially aged precursor cells, using a high-throughput microfluidics-based workflow introduced by Spiri et al9. This technique accelerates the investigation of the efficiency of gametogenic rejuvenation across diverse genetic backgrounds and can be leveraged to generate mechanistic insights into the conserved process of gametogenic rejuvenation. The discovery that gametogenesis resets replicative lifespan in yeast was initially made in the W303 and A364 strain backgrounds, using microdissection assays as readouts7. Resetting of replicative lifespan upon gametogenesis could not be assessed for the SK1 strain, despite its prominent use for the study of gametogenesis, due to difficulties in separating the first few daughter cells from the gamete7. During development of this protocol, we circumvented this limitation by engineering the SK1 strain background, introducing the D368V point mutation into the AMN1 locus to modulate cell separation and deleting FLO8 to eliminate flocculation25,26. Further, expression of STE5, a signaling scaffold protein that is essential to trigger the mating response, was conditionally restricted by implementation of an anhydrotetracycline-inducible Tet-OFF system at the endogenous locus (Figure 3A)27,28,29. This results in a complete conditional mating deficiency between MATa and MATα cells, thereby enabling genetic crosses while avoiding the triggering of mating responses between MATa and MATα gametes during experiments. Finally, to identify gametes and distinguish them from vegetative cells after a brief outgrowth, a transgenic reporter carrying a Pma2-GFP fusion protein under its endogenous promoter was introduced. Pma2-GFP is specifically expressed late in gametogenesis, localizes to the gamete plasma membrane, and is retained for several rounds of cell division after germination (Figure 1D, Figure 3B,C, and Figure 4A)9. The microfluidics-based assay described here significantly increases the throughput and feasibility of investigations into the gametogenic rejuvenation program compared with laborious, multi-day microdissection assays, which were the only previously available method for quantifying gametogenic rejuvenation. In agreement with the results obtained in W303 and A364 by microdissection7, we demonstrate that replicative lifespan completely resets after gametogenesis in the SK1 strain background. In addition, applying this method, we revealed that Atg11-dependent selective autophagy is essential for full rejuvenation of gametes (Figure 5B,D) (data derived from Spiri et al)9.
Microfluidic devices (Figure 2A–D) are set up and mounted according to the described protocol (step 8). Before mounting the microfluidic device onto the microscope, the cover glass is carefully inspected for cracks. Care must be taken to avoid damaging the cover glass when handling the microfluidic device. If cracks are detected, the affected imaging unit will not be used to prevent media spillage into the microscope and pressure inconsistencies during the experiment. Although unaffected imaging units of the same microfluidic device can still be used in theory, it is advised to switch to a new microfluidic device, as the structurally compromised cover glass carries a high risk of further crack propagation during the experiment. Next, each imaging unit must be inspected under the microscope to verify the integrity of PDMS structures and their proper bonding to the cover glass. To reduce the risk of cell clumping and clogging during the experiment, Pluronic F-127 is added to the growth media, and the media is filter-sterilized to remove debris before the experiment. Media is run through the microfluidic imaging units for at least 2 h prior to loading cells to ensure the imaging units are sufficiently primed with media. If a substantial amount of debris accumulates at the top of the U-trap region in a specific imaging unit, hindering cell loading and media flow, it is advised to remove this unit from the experiment by disconnecting it from the media pump (Figure 2J). Once the media is fully distributed throughout the imaging units, a test image of the ROIs is acquired to control for focal-plane differences within a single imaging unit and across the entire microfluidic device. If the microfluidic device has an internal tilt, micro-adjustments of the stage tilt can mitigate this issue. Alternatively, image three z-slices per position and timepoint with 3–8 µm z-spacing to compensate for focal plane differences across a single imaging unit.
To separate tetrads into single gametes, post-gametogenic age-sorted cultures are incubated with Zymolyase for 3 h (Figure 1D). This enzyme specifically digests the cell wall of yeast, weakening the tetrad ascus protecting gametes and lysing non-gametes (Figure 1D). Separated gametes are protected by their own cell walls, which are more resistant to digestion and thus prevent lysis. After tetrad separation, inspect the separated gametes to confirm sufficient tetrad dissociation and preservation of gamete integrity. If more than 30% of cells remain intact tetrads, additional sonication cycles can help to break them apart further (Figure 3B). It is advised to discontinue the experiment and start from scratch with a fresh batch of Zymolyase if more than 30% of tetrads remain intact, as they may form cell clumps during outgrowth, which can cause problems during loading and operation of the microfluidic system. Upon separation, gamete cultures are outgrown for 3 h at 30 °C in rich media, long enough to allow gametes to increase in size so they can be easily trapped in microfluidic devices, but brief enough that most cells have not completed their first division (Figure 1D). After outgrowth, cells are inspected under a light microscope to verify increased size and the emergence of the first bud. If a specific genotype takes significantly longer for gametes to increase in size and begin dividing, the timing should be adjusted accordingly to ensure efficient trapping of gametes.
Outgrown cells are then manually loaded into microfluidic imaging units by carefully applying pressure to the syringe while observing the unit via the microscope’s live view. Care must be taken not to apply excessive pressure, as it can cause PDMS structures to detach from the cover glass, thereby damaging the imaging unit. Pressure is applied continuously until the PDMS structures begin to warp slightly and cells start flowing into the imaging area. Once cells begin to flow into the imaging device, pressure is reduced as they pass through the unit, populating individual traps. If fewer than 200 cells are trapped in the first round, pressure is reapplied to repeat the loading cycle. Optimally loaded units will have cells populating at least 66% of traps, balancing between sufficient loading and overloading, which increases the risk of clogging during the experiment. Overloaded imaging units have excessive amounts of cells and debris above and within the U-trap area, which can obstruct media flow throughout the imaging unit. If shared pumps are used for different imaging units and one imaging unit is accidentally overloaded, the affected unit is unplugged from the media pump to prevent the pump from stalling due to clogging, thereby preventing disruption of additional experimental groups (Figure 2J). Loading of all conditions is completed within 1 h to avoid premature cell divisions of gametes leading to dilution of gametes by generated daughter cells and imprecise assessment of replicative lifespan. When loading for all conditions is completed, and media flow is resumed, the microfluidic device is carefully inspected for any leaking of media from re-plugged loading ports. If leakage is observed, carefully remove the solid stainless-steel pin and re-plug it into the loading ports to resolve the issue. Alternatively, if leakage cannot be stopped, the imaging unit is unplugged from the media pump to prevent liquid spillage into the microscope during the experiment (Figure 2J). If the imaging unit is overloaded, as indicated by cell numbers and debris around the first few traps, it is also unplugged from the media pump to prevent the pump from stalling during the experiment due to increased backpressure from reduced media flow (Figure 2J).
The customized open U-trap microfluidic devices used here, tailored for use with SK1, can capture a wide dynamic range of replicative lifespan with lower confinement of cells in space compared to other trap designs, minimizing the chance of previously reported effects on longevity30. However, this open design presents the drawback that cells may eject prematurely before senescence can be observed, mostly due to a significant increase in cell size during the last few divisions of replicative life (specifically observed for SK1 and unavoidable) or due to minor pressure aberrations in the fluidics system over time. Thus, special care must be taken to avoid introducing any air into the microfluidic system during device preparation and cell loading. To avoid bias when evaluating the replicative lifespan of gametes, every gamete loaded at the start of our time-lapse is counted until 200 gametes have been analyzed. Cells that are ejected before senescence are strictly classified as censored subjects for analysis purposes. We found that censoring rates are comparable between genotypes (Figure 5E, censored subjects = 63.4% ± 6.2, mean ± SD), with no systematic relationship between ejection frequency and observed lifespan phenotypes. Although this has not been observed thus far, we recommend repeating the experiment if ejection rates exceed 80% among analyzed cells. Thus, although cell ejection represents a substantial source of censoring inherent to the assay, partly because we count every loaded gamete even if they eject within the first few divisions, we see no evidence that differential ejection between genotypes accounts for the reported lifespan differences. Following this approach, replicative lifespan can be measured consistently and robustly. To reduce ejection events in future experiments, devices with novel trap designs are currently being developed and tested.
Although the throughput for quantifying the gametogenic reset of lifespan is significantly higher than that of the previously existing method, cell divisions in each gamete must be counted manually by a trained scientist, thereby making data analysis a current limitation of the presented method. Recent advances in machine-learning approaches for automating yeast replicative lifespan analysis offer a promising strategy to overcome the aforementioned limitation31. Particularly promising is a recently published approach called BudFinder, which employs a Masked Autoencoder pretrained in a self-supervised manner on large-scale yeast imaging data, then uses it to refine a transformer model to directly detect cell division events32. This approach significantly reduces the number of manually annotated division events required for model refinements compared to previous methods. Excitingly, the vast amount of data already generated and annotated using the protocol described here is well-suited to a similar approach that could automate replicative lifespan analysis of gametes in the future and overcome the current limitation. Furthermore, for future applications, this protocol can be readily combined with established biomarkers and sophisticated expression systems to identify molecular mechanisms and factors that mediate cellular rejuvenation during gametogenesis in S. cerevisiae, thereby enabling new insights into this conserved process.
Disclosures
The authors declare no competing interests.
Acknowledgements
We thank the current and former members of the Brar and Ünal laboratory for critical discussion and comments on the manuscript. This work is supported by the Swiss National Science Foundation mobility fellowship P500PB_214421 to S.S., G.A.B. is supported by funding from the National Institutes of Health (R01AG071869), T.L.S. was supported by a Longevity Impetus Grant from the Norn Group, Hevolution Foundation, and Rosenkranz Foundation. E.Ü. is supported by funding from the National Institutes of Health (R01AG071801) and the Astera Institute.
Materials
| Name | Company | Catalog Number | Comments |
|---|---|---|---|
| 1000 mL Vacuum filter/Storage bottle system | Corning | 431098 | 0.22 µm pore 54.5 cm2 PES Membrane, sterile. Store at room temperature. |
| 20 mL syringe | Becton, Dickinson and Company (BD) | 302830 | 20 mL Luer-Lok Syringe. Store at room temperature. |
| 5 mL syringe | Becton, Dickinson and Company (BD) | 14-829-45 | 5mL Luer-Lok Syringe, store at room temperature. |
| Ampicillin | Alpha Teknova | A9510 | Store at -20 °C after reconstitution in water. |
| Anti-biotin magnetic beads | Miltenyi Biotechnology | 130-097-046 | Store at 4 °C. |
| β-mercaptoethanol | MilliPORE SIGMA | M625-250mL | Store at 4 °C. |
| BSA | MilliPORE SIGMA | A4503-100G | Store at 4 °C. |
| Clay Adams Intramedic Luer-Stub Adapter | Becton, Dickinson and Company (BD) | 427565 | 23 Gauge, store at room temperature. |
| Cuvettes | Bio Rad | 2239955 | Semimicrovolume disposable polystyrene cuvettes. Store at room temperature. |
| Ethanol | NA | various | |
| EZ-Link Sulfo-NHS-LC-biotin | ThermoFisher Scientific | 21335 | Biotin to label founder cells for replicative aging |
| Fiji software | https://fiji.sc/ | NA | version: Fiji/ImageJ (ImageJ2, V. 2.14.0/1.54m) |
| Fluorescently labeled Streptavidin | ThermoFisher Scientific | S11225 | Alexa Fluor 546 conjugate, store at -20 °C in aliquots. |
| Fluorescently labeled wheat germ agglutinin | ThermoFisher Scientific | W11263 | Alexa Fluor 350 conjugate, store at -20 °C in aliquots. |
| Formaldehyde | ThermoFisher Scientific | F79-1 | 37%, Store at 4 °C. |
| Gametogenesis inducing media | NA | Prepared in house following standard recipe | 2% potassium acetate, amino acid supplements and ampicillin (40 mg/L adenine, 40 mg/L uracil, 10 mg/L histidine, 10 mg/L leucine and 10 mg/L tryptophan, 100 μg/mL ampicillin) |
| Glycine | ThermoFisher Scientific | BP381-1 | 100%, 200 proof. Store at room temperature. |
| Hollow stainless-steel pin | iBiochips | HSP-100 | P/N: 0.28”, OD, 0.016”, ID, 0.500” Long, store at room temperature. |
| Inverted fluorescent microscope | NA | NA | |
| Legato 200 syringe pumps | kdScientific | 788200 | Store at room temperature. |
| Legato 200/210 plastic or glass 6/10 multi rack | kdScientific | 788300 | Store at room temperature. |
| Light microscope | NA | NA | |
| Low-adhesion tubes | USA Scientific | 1415-2600 | Store at room temperature. |
| LS Columns | Miltenyi Biotechnology | 130-042-401 | Store at room temperature. |
| Microfluidic devices | iBiochips | ADU-10, (AD-Chips of the #18++) | Store at room temperature. |
| Non-DEHP medical grade tubing | iBiochips | MTB-100 | ID = 0.202”, OD = 0.060”, wall = 0.20”, store at room temperature. |
| PBS | NA | Prepared in house following standard recipe | Prepare 1L of: PBS pH 7; PBS pH8, PBS pH 8 + 100 mM glycine, PBS pH 7.4 + 0.5% BSA |
| Pluronic F-127 | MilliPORE SIGMA | P2443 | Store at room temperature. |
| Pre-separation filter | Miltenyi Biotechnology | 130-041-407 | Pore size 30 µm |
| QuadroMACS separator and starting kits | Miltenyi Biotechnology | 130-091-051 | Store at room temperature. |
| Solid stainless-steel pin | iBiochips | SSP-200 | OD, 0.027”, ID, 0.500”, store at room temperature. |
| Sonicator | Branson | 100-132-1623R & 101-135-066R | |
| Spectrophotometer | NA | NA | |
| Tube-rotator | NA | NA | |
| Y+A8+2:29+2:31+A8+2+2:33 | Brar-Ünal yeast strain database | pÜB42275 | trp1::pPma2-Pma2-eGFP::TRP1, ste5::NatR-pTet07.1-STE5, ura3::pRNR2-TetR-Tup1, pTetO7.1-TetR::URA3, flo8Δ, Amn1D368V |
| Yeast strain 2 | Brar-Ünal yeast strain database | pÜB48561 | atg11Δ::KanMX, trp1::pPma2-Pma2-eGFP::TRP1, ste5::NatR-pTet07.1-STE5, ura3::pRNR2-TetR-Tup1, pTetO7.1-TetR::URA3, flo8Δ, Amn1D368V |
| YPD (YEP + 2% glucose, supplemented with Trp and Ura) | NA | Prepared in house following standard recipe | YPD (1% yeast extract, 2% peptone, 2% glucose, 22.4 mg/L uracil, and 80 mg/L tryptophan). |
| Zymolyase 100T | MP Biomedicals | 8320932 | Store at -20 °C in aliquots after reconstitution in water. |
References
- Denoth Lippuner A, Julou T, Barral Y. Budding yeast as a model organism to study the effects of age. FEMS Microbiol Rev. 2014;38(2):300-25.
- Higuchi-Sanabria R et al. Role of asymmetric cell division in lifespan control in Saccharomyces cerevisiae. FEMS Yeast Res. 2014;14(8):1133-46.
- Hughes AL, Gottschling DE. An early age increase in vacuolar pH limits mitochondrial function and lifespan in yeast. Nature. 2012;492(7428):261-5.
- Nyström T, Liu B. Protein quality control in time and space—links to cellular aging. FEMS Yeast Res. 2014;14(1):40-8.
- Neiman AM. Sporulation in the budding yeast Saccharomyces cerevisiae. Genetics. 2011;189(3):737-65.
- Sing TL, Brar GA, Ünal E. Gametogenesis: exploring an endogenous rejuvenation program to understand cellular aging and quality control. Annu Rev Genet. 2022;56(1):89-112.
- Ünal E, Kinde B, Amon A. Gametogenesis eliminates age-induced cellular damage and resets life span in yeast. Science. 2011;332(6037):1554-7.
- Ünal E, Amon A. Gamete formation resets the aging clock in yeast. Cold Spring Harb Symp Quant Biol. 2011;76:73-80.
- Spiri S et al. A role for selective ER autophagy in gametogenic rejuvenation revealed by high-throughput lifespan profiling. Nat Commun. 2026. doi:10.1038/s41467-026-77993-0.
- Koch BA, Staley E, Jin H, Yu HG. The ESCRT-III complex is required for nuclear pore complex sequestration and regulates gamete replicative lifespan in budding yeast meiosis. Nucleus. 2020;11(1):219-36.
- Lee MB et al. Defining the impact of mutation accumulation on replicative lifespan in yeast using cancer-associated mutator phenotypes. Proc Natl Acad Sci U S A. 2019;116(8):3062-71.
- Mortimer RK, Johnston JR. Life span of individual yeast cells. Nature. 1959;183(4677):1751-2.
- Chen KL, Crane MM, Kaeberlein M. Microfluidic technologies for yeast replicative lifespan studies. Mech Ageing Dev. 2017;161(Pt B):262-9.
- Jin M et al. Divergent aging of isogenic yeast cells revealed through single-cell phenotypic dynamics. Cell Syst. 2019;8(3):242-53.e3.
- Jo MC et al. High-throughput analysis of yeast replicative aging using a microfluidic system. Proc Natl Acad Sci U S A. 2015;112(30):9364-9.
- Li Y et al. A programmable fate decision landscape underlies single-cell aging in yeast. Science. 2020;369(6501):325-9.
- Li Y et al. Multigenerational silencing dynamics control cell aging. Proc Natl Acad Sci U S A. 2017;114(42):11253-8.
- Liu P, Young TZ, Acar M. Yeast Replicator: a high-throughput multiplexed microfluidics platform for automated measurements of single-cell aging. Cell Rep. 2015;13(3):634-44.
- Thayer NH et al. The Yeast Lifespan Machine: a microfluidic platform for automated replicative lifespan measurements. bioRxiv. 2022;2022.02.14.480146.
- Schindelin J et al. Fiji: an open-source platform for biological-image analysis. Nat Methods. 2012;9(7):676-82.
- Spiri S. Fiji macros for microscopy analysis of gametogenic rejuvenation [Internet]. Zenodo; 2026. Available from: [https://doi.org/10.5281/zenodo.22004193](https://doi.org/10.5281/zenodo.22004193)
- Cabib E, Bowers B. Chitin and yeast budding: localization of chitin in yeast bud scars. J Biol Chem. 1971;246(1):152-9.
- Mizushima N, Levine B, Cuervo AM, Klionsky DJ. Autophagy fights disease through cellular self-digestion. Nature. 2008;451(7182):1069-75.
- Rubinsztein DC, Mariño G, Kroemer G. Autophagy and aging. Cell. 2011;146(5):682-95.
- Kobayashi O, Suda H, Ohtani T, Sone H. Molecular cloning and analysis of the dominant flocculation gene FLO8 from Saccharomyces cerevisiae. Mol Gen Genet. 1996;251(6):707-15.
- Fang O et al. Amn1 governs post-mitotic cell separation in Saccharomyces cerevisiae. PLoS Genet. 2018;14(10):e1007691.
- Azizoglu A, Brent R, Rudolf F. A precisely adjustable, variation-suppressed eukaryotic transcriptional controller to enable genetic discovery. eLife. 2021;10:e69549.
- Choi KY, Satterberg B, Lyons DM, Elion EA. Ste5 tethers multiple protein kinases in the MAP kinase cascade required for mating in S. cerevisiae. Cell. 1994;78(3):499-512.
- Bellí G et al. An activator/repressor dual system allows tight tetracycline-regulated gene expression in budding yeast. Nucleic Acids Res. 1998;26(4):942-7.
- Gao Z et al. Comparative analysis of yeast replicative lifespan in different trapping structures using an integrated microfluidic system. Adv Mater Technol. 2020;5(12):2000655.
- Aspert T, Hentsch D, Charvin G. DetecDiv, a generalist deep-learning platform for automated cell division tracking and survival analysis. eLife. 2022;11:e79519.
- Nguyen P et al. BudFinder: a masked auto-encoder vision transformer framework for yeast budding detection and lifespan quantification. PLoS Comput Biol. 2026;22(5):e1013700.
Reprints and Permissions
This article has been published
Video Coming Soon