This article presents a protocol for formalin-fixed, paraffin-embedded cleavage under targeted accessible chromatin (FFPE-CUTAC), a chromatin mapping method for profiling active regulatory elements in archival FFPE sections using an antibody against RNA Polymerase II to mark the regulatory step prior to transcriptional elongation.
Method Article
Profiling Active Regulatory Elements in Archival Mouse Tissue by Formalin-Fixed Paraffin-Embedded Cleavage Under Targeted Accessible Chromatin
In This Article
Summary
Abstract
The standard for long-term storage of tissue samples is formalin fixation and paraffin embedding (FFPE), a method that allows samples to be archived at room temperature for decades. However, RNA degrades during storage, and prolonged exposure to ~4% formaldehyde damages RNA and DNA, limiting the utility of RNA sequencing for expression profiling. Our Cleavage Under Targeted Accessible Chromatin (CUTAC) adaptation of CUT&Tag for in situ open chromatin mapping provides high-resolution, genome-wide profiling of FFPE samples, including sections from decades-old tissue blocks. Here, we demonstrate a step-by-step on-slide FFPE-CUTAC protocol, using an antibody to RNA Polymerase II Serine-5 phosphate (RNAPII-S5p), which marks the transcriptional machinery at active regulatory elements when it is paused just before productive elongation, thereby capturing a proxy for active transcription. This workflow makes epigenomic profiling simple and affordable, opening the door to profiling archival samples for clinical applications, retrospective studies, basic transcriptome research, and broader translational research.
Introduction
Formalin fixation and paraffin embedding (FFPE) is a standard method of preserving tissue specimens. More than a billion of these tissue samples have been accumulating in hospitals and biorepositories around the world for decades1, providing an ample source of metadata for DNA or protein analyses. To analyze FFPE tissue, the paraffin block is sectioned on a microtome, and thin sections are transferred to microscope slides for staining and examination. A chromatin profiling method, Cleavage Under Targeted Accessible Chromatin (CUTAC), uses RNA Polymerase II (RNAPII) as a target to identify DNA sequences actively undergoing transcription2. Most types of RNA and all mRNAs in an organism are produced by RNAPII3, making it useful to map this machinery.
CUTAC tethers RNAPII with two antibodies and uses a Tn5 transposase to cut and tagment surrounding DNA, enriching libraries for next-generation sequencing4 (Figure 1). These sequenced fragments can be analyzed using peak callers or differential analysis and visualized in a genomic browser. The procedure is simple in practice and can be performed directly on microscope slides with FFPE tissue, hence the name FFPE-CUTAC5. Standard chromatin profiling has been used in FFPE samples, but with varying degrees of success.
Methods like ChIP-seq are not well-suited to the low input available in patient samples6, and FFPE-derived chromatin is difficult to extract and profile by ChIP-seq7. Additionally, the process of de-crosslinking formalin degrades RNA8, making RNA-seq a relatively poor method of measuring the FFPE transcriptome. FFPE-CUTAC yields < 120 bp fragments, which are generally shielded against DNA degradation5, and is experimentally straightforward9. This article presents a visualized, step-by-step protocol for FFPE-CUTAC, providing detailed procedural guidance to complement previously published descriptions of the method5,9.
FFPE-CUTAC has now been used in a variety of applications, including profiling cancer transcriptional signatures from tumor biopsies5,10, determining changes between young and aged tissues, and comparing tissues from mouse brain, colon, and liver, as well as human tumor and normal tissue samples. The next steps are to optimize FFPE-CUTAC in a single-cell context.
Protocol
This protocol uses formalin-fixed, paraffin-embedded tissue sections derived from animal subjects. All animal husbandry, tissue collection, and downstream tissue handling were performed in compliance with the guidelines of the researcher's institutional Animal Care and Use Committee (IACUC) or equivalent institutional animal ethics body, and approval was obtained under an active institutional protocol before beginning work. No tissues of human origin were used.
1. Preparation of stock solutions and working buffers
NOTE: Prepare all stock solutions in advance and store as indicated. Prepare all working-wash-plus-detergent buffers and antibody or enzyme dilutions fresh, immediately before use, unless otherwise noted.
- Stock wash buffers
- Prepare 500 mL of 150 mM NaCl base wash buffer (20 mM HEPES pH 7.5, 150 mM NaCl) by combining 475 mL of deionized water, 10 mL of 1 M HEPES pH 7.5, and 15 mL of 5 M NaCl. Store at 4 °C for up to 1 month.
- Prepare 500 mL of 300 mM NaCl base wash buffer (20 mM HEPES pH 7.5, 300 mM NaCl) by combining 460 mL of deionized water, 10 mL of 1 M HEPES pH 7.5, and 30 mL of 5 M NaCl. Store at 4 °C for up to 1 month.
- Working wash-plus-detergent buffers
- On the day of use, prepare the working low-salt wash buffer by adding 250 µL of 10% Triton X-100, 12.5 µL of 2 M spermidine, and one EDTA-free protease inhibitor tablet to 50 mL of the 150 mM NaCl base wash buffer (final concentrations: 0.05% Triton X-100, 0.5 mM spermidine).
- Prepare the working high-salt wash buffer identically to step 1.2.1, substituting 50 mL of the 300 mM NaCl base wash buffer in place of the 150 mM NaCl base wash buffer.
NOTE: Prepare only the volume needed for the current experiment. Do not store working buffers containing protease inhibitor beyond the day of preparation.
- Antibody dilution buffer
- Prepare antibody dilution buffer by adding 40 µL of 0.5 M EDTA and 40 µL of 30% bovine serum albumin to 10 mL of the working low-salt wash buffer (final concentrations: 2 mM EDTA, approximately 0.12% bovine serum albumin). BSA is intended to reduce non-specific binding during incubation.
- Tagmentation buffer
CAUTION: N,N-dimethylformamide (DMF) is a reproductive and developmental toxicant and penetrates skin readily. Prepare and handle all solutions containing N,N-dimethylformamide in a certified chemical fume hood. Wear nitrile gloves and safety glasses, and avoid any direct skin contact.- Prepare 50 mL of tagmentation buffer (10 mM TAPS pH 8.5, 5 mM magnesium chloride, 20% N,N-dimethylformamide) in the fume hood by combining 39.3 mL of deionized water, 10 mL of N,N-dimethylformamide, 500 µL of 1 M TAPS pH 8.5, and 250 µL of 1 M magnesium chloride. Store the tagmentation buffer at 4 °C for up to 1 week.
- Crosslink-reversal and wash buffers
- Prepare 100 mL of 800 mM Tris-HCl pH 8 by combining 80 mL of 1 M Tris-HCl pH 8 with 20 mL of deionized water.
- Prepare 50 mL of 10 mM TAPS pH 8.5 by combining 500 µL of 1 M TAPS pH 8.5 with 49.5 mL of deionized water.
- Antibody and enzyme dilutions
- Immediately before use, prepare the primary antibody dilution by diluting the anti-RNA Polymerase II Ser5-phosphate (RNAPII-S5p) antibody 1:100 in antibody dilution buffer. Prepare 150 µL per tissue section.
- Immediately before use, prepare the secondary antibody dilution by diluting the guinea pig anti-rabbit antibody 1:100 in antibody dilution buffer. Prepare 150 µL per tissue section.
- Immediately before use, prepare the Protein aG-Tn5 (pAg-Tn5) dilution by diluting the enzyme 1:20 in the working high-salt wash buffer. Prepare 150 µL per tissue section.
CAUTION: Sodium dodecyl sulfate (SDS) is an irritant to skin, eyes, and the respiratory tract. Wear gloves and avoid generating aerosols when handling powder or concentrated solution.
- Release and quench solutions
- Prepare release buffer immediately before use by combining 80 µL of 10 mM TAPS pH 8.5, 10 µL of 10% sodium dodecyl sulfate, and 10 µL of thermolabile proteinase K (final concentrations: 8 mM TAPS, 1% sodium dodecyl sulfate). Scale proportionally for the number of samples being processed.
- Prepare the 5% Triton X-100 quenching solution by combining 500 µL of 10% Triton X-100 with 500 µL of deionized water.
2. Deparaffinization and reversal of formaldehyde crosslinks
NOTE: The examples presented in this protocol were prepared using 5 µm-thick FFPE tissue sections mounted on charged glass microscope slides. Sections were cut from mouse colon tissue blocks (12-week-old and 90-week-old animals) using the Fred Hutch Cancer Center’s Experimental Histopathology Shared Resource. One tissue section per slide was used per reaction. Tissue area varied across samples; steps to standardize input by tissue area or cell density are described in the Discussion.
CAUTION: The xylene substitute clearing agent used for deparaffinization is a skin and respiratory irritant and is flammable. Perform all clearing-reagent and ethanol incubation steps inside a certified chemical fume hood, and wear nitrile gloves and safety glasses throughout.
- Place the FFPE tissue slide in a Coplin jar containing the xylene substitute clearing agent and incubate for 10 min at room temperature.
- Transfer the slide sequentially through a descending ethanol series, incubating for 5 min at each step: 95% ethanol (47.5 mL of ethanol plus 2.5 mL of deionized water), 50% ethanol (25 mL of ethanol plus 25 mL of deionized water), and 10% ethanol (5 mL of ethanol plus 45 mL of deionized water).
- Rinse the slide in a Coplin jar of deionized water for 5 min.
- Submerge the slide in a Coplin jar containing 800 mM Tris-HCl, pH 8. Seal the jar lid securely and incubate at 85 °C in a water bath overnight to reverse formaldehyde crosslinks.
- The following day, remove the Coplin jar from the water bath and allow it to cool to room temperature before proceeding to antibody incubation.
3. Antibody Incubation
- Remove the slide from the crosslink-reversal buffer and gently blot the edge of the slide with an absorbent wipe to remove excess liquid, taking care not to touch the tissue section directly.
- Place a gene frame (a self-adhesive barrier used to keep the reagents on the slide) over the tissue section.
- (OPTIONAL) Pipette 150 µL of low-salt wash buffer over the tissue section. Place the slide in a box lined with a moistened, rolled paper towel and incubate at room temperature for 1 h.
- (OPTIONAL) Tilt the slide over an absorbent surface and rinse the tissue section by pipetting 1,000 µL of working low-salt wash buffer twice across the tissue.
- Pipette 150 µL of primary antibody dilution into the gene frame over the tissue section. Place the slide in a box lined with a moistened, rolled paper towel and incubate at room temperature for 1 h.
- Tilt the slide over an absorbent surface and rinse the tissue section by pipetting 1,000 µL of working low-salt wash buffer twice across the tissue.
- Pipette 150 µL of secondary antibody dilution onto the tissue section. Return the slide to the humidified chamber and incubate at room temperature for 1 h.
- Rinse the tissue section with working low-salt wash buffer as in step 3.3.
4. Tethering of Protein AG-Tn5
- Pipette 150 µL of the pAg-Tn5 dilution onto the tissue section. Return the slide to the humidified chamber and incubate at room temperature for 1 h.
- Rinse the tissue section with working high-salt wash buffer.
NOTE: The high-salt conditions reduce non-specific binding of pAg-Tn5. - Transfer the slide to a Coplin jar containing 10 mM TAPS (pH 8.5) and incubate for 10 min at room temperature to remove unbound enzyme.
5. Tagmentation
NOTE: Tagmentation buffer with and without DMF was tested and found to produce comparable results (see Discussion). If DMF-free tagmentation is preferred, the DMF may be omitted and the volume replaced with deionized water. In this case, use of a fume hood during tagmentation is not required.
CAUTION: Handle the tagmentation buffer within a certified chemical fume hood, per the caution in step 1.4, because it contains N,N-dimethylformamide.
- In the fume hood, transfer the slide to a glass Coplin jar containing tagmentation buffer. Incubate the sealed jar in a 55 °C water bath for 1 h.
- Transfer the slide to a Coplin jar containing 10 mM TAPS (pH 8.5) and hold at this stage until proceeding to tissue release.
PAUSE POINT: Slides may be held in 10 mM TAPS (pH 8.5) at 4 °C overnight before proceeding to fragment release. Cover the jar to prevent evaporation.
6. Tissue scraping and fragment release
CAUTION: Handle the razor blade with care. Dispose of used blades immediately into an approved sharps container.
- Aliquot 7 µL of release buffer into an 8-tube PCR strip, one tube per sample.
- Pipette 3 µL of release buffer directly onto the tissue section. Scrape the tissue from the slide using a razor blade and consolidate it into a single spot. Transfer the entire scraped tissue and buffer to the corresponding PCR strip tube using a 10 µL pipette tip.
- Centrifuge the tube strip briefly (approximately 5 s at low speed, ~1,000 × g) to collect the liquid at the bottom of each tube.
- Place the tube strip in a thermal cycler and incubate at 37 °C for 30 min, followed by 58 °C for 10 min.
- Add 30 µL of the 5% Triton X-100 quenching solution to each tube and incubate at 37 °C for 30 min in the thermal cycler.
PAUSE POINT: Released and quenched DNA may be stored at 4 °C for short-term use or at -20 °C for longer-term storage before proceeding to purification.
7. Column-based purification of released DNA
- Place the 40 µL released sample in a 1.5 mL microcentrifuge tube. Add DNA binding buffer at a 5:1 buffer-to-sample volume ratio according to the cleanup kit instructions. For a 40 µL sample, add 200 µL of binding buffer, then vortex to mix thoroughly.
- Load the entire sample-binding buffer mixture onto a silica-membrane spin column positioned in a collection tube. Centrifuge at 10,000 × g for 30 s, then discard the flowthrough.
- Apply 200 µL of DNA wash buffer to the column and centrifuge at 10,000 × g for 30 s. Discard the flowthrough and repeat this wash step once more.
NOTE: Confirm the recommended centrifugation speed against the specific column manufacturer's instructions, as this value varies slightly between commercial kits. - Add 21 µL of DNA elution buffer to the center of the silica membrane and let the column stand at room temperature for 1 min. Move the column to a fresh 1.5 mL microcentrifuge tube and centrifuge at 10,000 × g for 30 s to recover the purified DNA.
PAUSE POINT: Purified DNA may be stored at 4 °C for short-term use or at -20 °C for longer-term storage before library amplification.
8. Library amplification by PCR
- Transfer 21 µL of purified DNA to a PCR strip tube. On ice, assemble a 50 µL reaction containing 21 µL of DNA template, 2 µL of a 10 µM indexed i5 primer (final concentration: 400 nM), 2 µL of a 10 µM indexed i7 primer (final concentration: 400 nM), and 25 µL of high-fidelity PCR master mix.
- Vortex briefly and centrifuge the tube strip to collect the contents at the bottom.
- Start the thermal cycler program below and allow the block to reach 58 °C before loading the tubes: Cycle 1: 58 °C for 5 min (gap filling), Cycle 2: 72 °C for 5 min (gap filling), Cycle 3: 98 °C for 5 min, Cycle 4: 98 °C for 10 s, Cycle 5: 63 °C for 30 s, Cycle 6: 72 °C for 1 min. Repeat cycles 4–6 for a total of 12 additional cycles; hold at 8 °C.
NOTE: Previous applications of this protocol used 12–14 amplification cycles with little apparent effect on library performance; cycle number may be adjusted within this range depending on tissue input and library yield.
9. Postamplification bead-based cleanup and library quality assessment
- Add 65 µL of paramagnetic solid-phase reversible immobilization (SPRI) bead suspension to the completed PCR reaction and mix thoroughly by pipetting. Allow the sample to stand at room temperature for 10 min for DNA binding. Transfer the tube to a magnetic separation rack and leave it in place until the solution becomes clear.
- With the tube remaining on the magnetic rack, remove and discard the supernatant without disturbing the bead pellet.
- Wash the beads with two washes of 200 µL of 80% ethanol and remove all ethanol after the final wash. Resuspend the pellet in 25 µL of 10 mM Tris-HCl (pH 8).
PAUSE POINT: The eluted, amplified library may be stored at 4 °C for short-term use or at -20 °C for longer-term storage before quality assessment or sequencing. - Assess 2 µL of the eluted library on a capillary electrophoresis system using high-sensitivity DNA reagents to determine fragment size distribution and concentration.
Results
A successful FFPE-CUTAC reaction produces a DNA library of approximately 200 base pair fragments, corresponding to adapter-ligated FFPE-CUTAC fragments. This product forms a peak on the capillary electrophoresis trace, distinct from the primer-dimer region below 100 base pairs and high-molecular-weight background above 800 base pairs (Figure 2). Libraries with a visible 200 bp peak but low overall signal are often still suitable for sequencing and produce sufficient mapped reads for genome-wide analysis. Lane 3, which showed very low yield by capillary electrophoresis, nonetheless produced 18.5 million raw reads (Table 1). Lane 5, derived from a 90-week-old mouse colon with a larger tissue input, produced a stronger electrophoresis signal and higher mapped read fraction, illustrating the range of outcomes across input conditions. A library showing no detectable peak above the primer-dimer region, or one dominated by a high-molecular-weight smear without a discrete product, should be considered potentially failed; however, sequencing may still be attempted and can be successful if there were higher-yield reactions in the same experiment.
Samples were pooled according to the measured library concentrations, targeting a sequencing depth of 10–20 million fragments per sample, and subsequently submitted for sequencing on a high-throughput sequencer in dual-index paired-end mode. Sequencing reads from a successful library mapped predominantly to the reference genome, with the fraction of reads aligning to the nuclear genome typically exceeding 80% and only a small minority of reads mapping to mitochondrial DNA or to the Escherichia coli genome (Table 1). The latter derives from residual E. coli DNA carried over during pAg-Tn5 production and, because the same volume of enzyme is added to each reaction within an experiment, can serve as a proxy for sequencing normalization across samples. After alignment, mapped fragments accumulated as sharp peaks at the transcription start sites of highly expressed genes, consistent with enrichment of RNA Polymerase II at active regulatory elements rather than background (Figure 3).
Table 1 shows sequencing statistics for replicate samples. A reaction was considered unsuccessful if the corresponding sequencing data showed a low fraction of genome-mapped reads (mm10_Fraction_Mapped below approximately 0.5), a chrM_Fraction above approximately 0.1, the absence of enrichment at known active regulatory elements, or a fragment-size distribution dominated by low- or high-molecular-weight material. Libraries with Estimated Library Size (ELS) values below approximately 4 million may have limited complexity and yield few unique fragments, even with deeper sequencing. Browser tracks for these samples showed peaks in reads at the highly abundant long non-coding RNAs Malat1 and Neat1.
Further quality control can be performed post-sequencing using computational tools from open source packages to visualize and evaluate signal quality. UCSC bigWigMerge11 can be used to combine normalized coverage tracks into a single merged track. The deepTools suite12 provides a range of QC tools, including plotCorrelation for replicate correlation matrices, plotPCA for principal component analysis across samples, computeMatrix and plotHeatmap for visualizing signal enrichment around annotated features like transcription start sites, and bamCompare for generating ratio tracks between conditions. Fractions of Reads in Peaks (FRiP) scores, calculated with tools such as BEDTools13 intersect or MACS214, provide a measure of library specificity. Finally, fragment size distribution plots generated from mapped paired-end reads should confirm that fragments in the 50-200 base pair range are enriched.
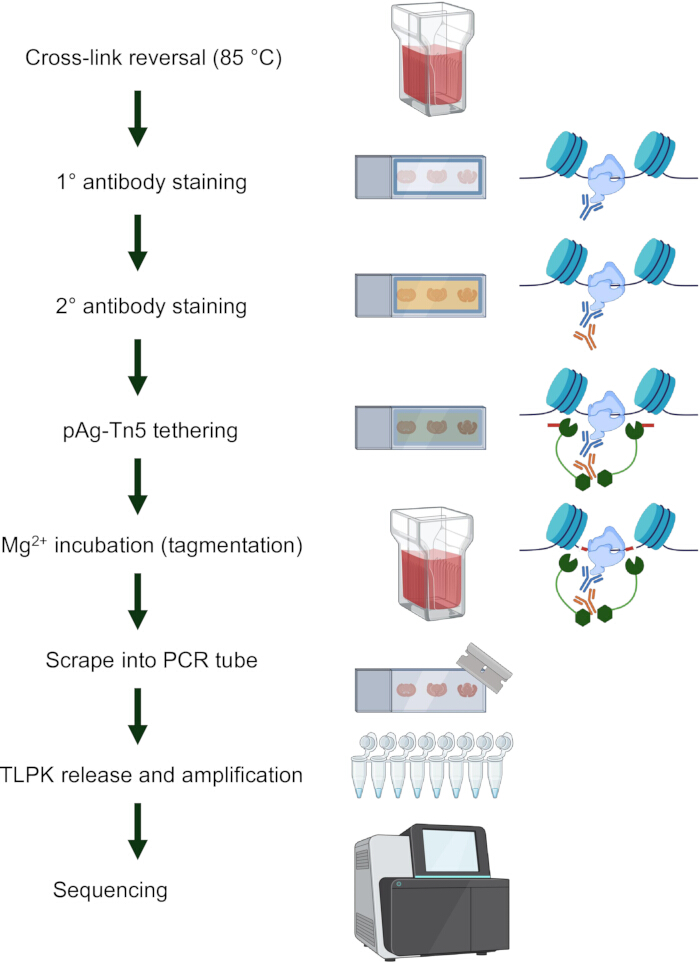
Figure 1: Overview of the protocol for FFPE-CUTAC. The workflow for Formalin-Fixed Paraffin-Embedded Cleavage Under Targeted Accessible Chromatin (FFPE-CUTAC) begins with deparaffinizing, followed by de-crosslinking of formalin-fixed, paraffin-embedded (FFPE) tissues at high heat. The protein of interest is targeted using a primary antibody and a secondary antibody, which is then conjugated to protein A-Tn5 transposase. The slide is incubated with magnesium to activate the Tn5, then the tissue is scraped into a PCR tube. The cells are incubated with Proteinase K to release DNA, then amplified and sequenced. Abbreviations: FFPE = formalin-fixed, paraffin-embedded; CUTAC = Cleavage Under Targeted Accessible Chromatin; pAg-Tn5 = protein A/G-Tn5 transposase; PCR = polymerase chain reaction; TLPK = thermolabile proteinase K. Please click here to view a larger version of this figure.
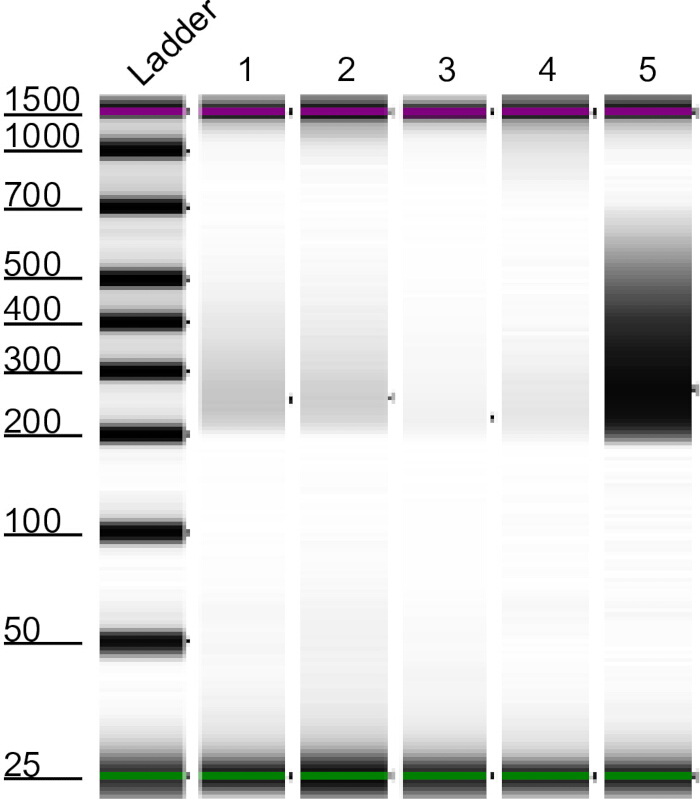
Figure 2: Representative capillary electrophoresis image. Gel analysis of libraries generated after PCR amplification and assessed by capillary electrophoresis before high-throughput sequencing. The electronic ladder on the left provides the reference for estimating fragment size, with successful reactions generally yielding a visible band at approximately 200 base pairs. Lanes 1 through 4 represent technical replicates of a 12-week-old mouse colon, with 1 having 50% of tissue input, 2 having 30%, 3, having 10%, and 4 having the remaining tissue. The library in lane 5 came from a larger tissue section of a 90-week-old mouse colon for comparison. Although occasional reactions showed little visible yield (see lane 3), they often produced sufficient sequencing for efficient genome mapping. Reactions with strong bands (see lane 5) tend to have a higher mapped fraction of reads and a larger library. Abbreviations: PCR = polymerase chain reaction; bp = base pairs. Please click here to view a larger version of this figure.
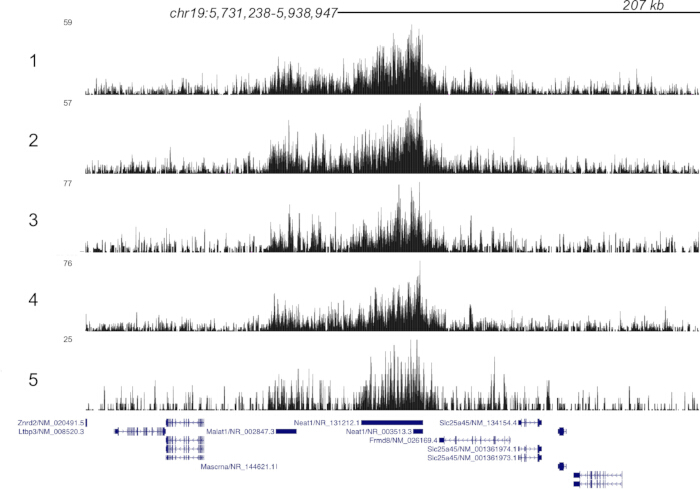
Figure 3: Genome track visualization. RNA Polymerase II (RNAPII) enrichment at promoters for highly abundant nuclear long non-coding RNA Neat1 and Malat1. Peaks form at the promoters of active genes because there is high RNAPII signal. Abbreviation: RNAPII = RNA polymerase II. Please click here to view a larger version of this figure.
| Sample | Conc. [pg/µL] | Raw_Reads | Clipped_Reads | mm10_fragments | chrM_fraction | ecoli_Fragments | mm10_Fraction_Mapped | Fraction_Duplication | estimated_Library_Size |
| 1 | 50.4 | 17022392 | 16944511 | 14106793 | 0.034 | 13157 | 0.833 | 0.423147 | 12158636 |
| 2 | 40.1 | 17652810 | 17563896 | 14618178 | 0.033 | 13414 | 0.832 | 0.513631 | 9082386 |
| 3 | 3.85 | 18471771 | 18354167 | 15240815 | 0.033 | 14311 | 0.83 | 0.755529 | 3812279 |
| 4 | No peak recorded | 17241161 | 17143339 | 14222035 | 0.033 | 12015 | 0.83 | 0.562674 | 7377301 |
| 5 | 390 | 9269872 | 9233822 | 8533086 | 0.017 | 7856 | 0.924 | 0.180875 | 26006109 |
Table 1: Representative sequencing statistics. Raw_Reads is the total number of sequencing reads produced before any processing steps. Clipped_Reads is the number of reads retained after adapter sequences are trimmed off. Mm10_Fragments is the number of read pairs that map to the mm10 mouse reference genome. ChrM_Fraction is the proportion of total mapped fragments that align to the mitochondrial chromosome. Ecoli_Fragents is the number of read pairs mapped to the Escherichia coli reference genome, generally carried along with the bacterially-produced pAg-Tn5 protein. Residual E. coli fragments associated with pAg-Tn5 production can be used as a proxy for normalization across samples processed with the same amount of enzyme. Mm10_Fraction_Mapped is the proportion of reads that map successfully to the mm10 mouse reference genome. Fraction_Duplication is duplicate reads, inferred by the MarkDuplicates (Picard) package. ELS is the estimated library size, calculated by MarkDuplicates (Picard). Abbreviations: Conc. = concentration; pg/µL = picograms per microliter; mm10 = mouse reference genome assembly mm10; chrM = mitochondrial chromosome; E. coli = Escherichia coli; ELS = estimated library size.
Discussion
This paper describes FFPE-CUTAC as a practical method for chromatin profiling of FFPE tissue. FFPE-CUTAC can be completed in 3–4 days, making it more efficient than preexisting methods such as FFPE Tissue with Antibody-Guided Chromatin Tagmentation (FACT-seq), which requires approximately 5 days15. This CUTAC technique releases relatively small fragments of DNA that can be more resistant to degradation that can occur as a result of cross-linkage, making this approach more suitable for chromatin accessibility and RNAPII occupancy profiling from FFPE material than methods relying on RNA integrity9,10. Additionally, FFPE CUTAC can map and identify regulatory markers with high accuracy and confidence, such as microRNAs that cannot be detected by standard RNA-seq5. We have previously compared our method against benchmarked data sets such as ChIP-seq from the ENCODE project and traditional CUT&Tag on frozen, unfixed tissue sections15 to identify that FFPE-CUTAC is concordant with other chromatin profiling methods. Therefore, FFPE-CUTAC enables epigenetic profiling of billions of FFPE samples worldwide, opening up previously inaccessible tissue for study.
Most steps in this protocol are critical for reliable outcomes. The deparaffinization and reversal of formaldehyde crosslinks steps must be performed completely to remove the paraffin embedding medium and restore protein accessibility without degrading the DNA within. Similarly, the antibody incubation allows the primary antibody to bind to RNAPII, and the secondary antibody to bind to the primary antibody, with the secondary antibody serving as a target for pAG-Tn5. The antibody dilution buffer contains BSA to reduce nonspecific antibody interactions during primary and secondary antibody incubation. The high-salt wash buffer applied after pAg-Tn5 incubation also reduces background by removing nonspecifically bound pAg-Tn5 and can be performed prior to staining the slides with the primary and secondary antibodies to reduce nonspecific antibody interactions that cause higher background signal. The high-salt wash buffer applied after pAg-Tn5 incubation also reduces background noise by clearing nonspecific binding of the pAG-Tn5. The tagmentation step is modifiable, as similar experimental results were obtained without N,N-dimethylformamide.
The tissue scraping and fragment release steps are critical for lysing cells and releasing tagmented fragments. Column-based DNA purification was introduced after repeated amplification failures and substantially improved library success rates across diverse tissue types and input amounts. Omitting this step is possible but reduces overall reliability. In previous studies, the PCR cycle was optimized to include a 1 min 72 oC extension step during each repeat, intended to capture larger fragments from template DNA5. For this protocol, several new optimizations were tested. First, tagmentation buffer with and without DMF produced comparable sequencing results, eliminating the need for a fume hood and broadening the range of laboratory settings in which the protocol can be performed. Second, the use of BSA in the antibody dilution buffer, together with more stringent washes between antibody incubation steps, produced stronger bands on capillary electrophoresis and reduced background signal in the sequenced product. Third, the column-based purification of released DNA was introduced to the protocol after several library amplification failures. The column cleanup protocol produced a strong library in all subsequent runs. Although strong PCR results could occasionally be obtained without this step, the overall success rate was lower and less consistent across tissue types.
This protocol has several limitations. FFPE-CUTAC has been validated across multiple tissue types, including mouse brain tumors (PDGFB-driven gliomas, ZFTA-RELA fusion-driven ependymomas, and YAP1-FAM118b fusion-driven ependymomas), normal mouse brain, mouse liver tumors and normal liver, mouse colon tissue, and human breast cancer and adjacent normal tissue. Performance with other tissue types has not been systematically characterized. FFPE blocks assessed have been stored between one month and approximately 2 years before processing, and liver samples fixed for up to seven days were also successfully profiled5, suggesting the method works across a range of fixation and storage conditions. The effect of block age or storage conditions on library quality has not been formally assessed.
Tissue input is difficult to standardize because section area and cell density vary between specimens. In the studies underlying the protocol, inputs ranging from 10% to 25% of a 10 µm FFPE section (~50,000–100,000 cells) for brain tissue and 10–50% of a section (~30,000–150,000 cells) for liver tissue produced consistent results. Ongoing efforts applying machine learning to identify tissue cut sites based on cell density may improve input consistency in the future. The standard protocol does not include a dedicated negative control, which may limit the ability to formally distinguish the enriched signal from the background. FFPE-CUTAC has been tested with several antibodies with varying success. Antibodies against RNAPII-S5p, RNAPII-Ser2,5p, and H3K27ac produced high-quality data5. In contrast, the repressive mark H3K27me3 yielded a poor signal-to-noise ratio, and H3K4me3, H3K4me2, and H3K36me3 failed entirely5. These failures may be attributed to the susceptibility of lysine-rich histones to crosslinking, causing DNA to form covalent bonds to formaldehyde and leading to breaks during crosslinking reversal.
Thus far, FFPE-CUTAC has primarily been used to assess differences in transcriptional activity between tumorous and healthy tissue, and we are expanding the procedure to additional cancer types and other fields, including aging. The method currently captures bulk tissue signal, averaging across the cell types in the tissue section. Optimization of single-cell-resolution FFPE-CUTAC is ongoing but remains in preliminary stages.
Disclosures
SH has applied for a patent on related methods. The other authors declare no conflicts of interest.
Acknowledgements
EL is a Cech Fellow, and SH is an Investigator of the Howard Hughes Medical Institute. SML is funded by the National Institutes of Health Ruth L. Kirschstein National Research Service award 1F32GM153148-01. ED, MD, and SW thank the Fred Hutch Summer High School Internship Program for support.
Materials
| Name | Company | Catalog Number | Comments |
|---|---|---|---|
| 1 M HEPES pH 7.5 | |||
| 1 M MgCl2 | |||
| 10% Sodium Dodecyl Sulfate (SDS) | |||
| 2 M Spermidine | |||
| 30% Bovine Serum Albumin | Sigma-Aldrich | A9576 | |
| 4200 Tapestation Instrument | Agilent Technologies | G2991BA | |
| 5 M NaCl | |||
| 80% EtOH | |||
| 8-tube PCR Strips | |||
| AMPure XP Beads for DNA Cleanup | Beckman Coulter | A63882 | |
| Coplin jars | |||
| CUTANA pAG-Tn5 for CUT&Tag | EpiCypher | 15-1017 | |
| DNA Clean & Concentrator-5 | Zymo Research | D4004 | |
| Eppendorf tubes | |||
| Gene Frame | ThermoFisher Scientific | AB0578 | |
| Guinea Pig anti-Rabbit IgG Antibody | Antibodies Online | ABIN101961 | |
| High Sensitivity D1000 Sample Buffer | Agilent Technologies | 5067-5603 | |
| High Sensitivity D1000 ScreenTape | Agilent Technologies | 5067-5584 | |
| Ice bucket | |||
| Indexed i5 and i7 primers | EpiCypher | 14-1102 (Primer Set 1) or 14-1103 (Primer Set 2) | |
| Magnetic separation rack | |||
| N,N-dimethylformamide (DMF), anhydrous 99.8% | Sigma-Aldrich | 227056 | |
| NovaSeq X | Illumina | 20084803 | |
| Phospho-Rpb1 CTD (Ser5) Rabbit Monoclonal Antibody | Cell Signaling Technology | 13523S | |
| Picard Tools, MarkDuplicates module | Broad Institute | ||
| Protocol Safeclear 2 Xylene Substitute, Fisherbrand | Fisher Scientific | 11-002-233 | |
| Razor | |||
| Roche cOmplete EDTA-free Protease Inhibitor Cocktail | Sigma-Aldrich | 11873580001 | |
| TAPS Buffer, 0.2 M buffer soln., ph 8.5, Thermo Scientific Chemicals | ThermoFisher Scientific | J63268.AE | |
| Thermal cycler | |||
| Thermolabile protease K | New England Biolabs | P8111S | |
| Trizma hydrochloride solution | Sigma-Aldrich | T2194 | |
| Ultra II Q5 Master Mix | New England Biolabs | M0544L | |
| UltraPure 0.5 M EDTA, pH 8.0 | ThermoFisher Scientific | 15575020 | |
| Water bath |
References
- Blow N. Tissue preparation: tissue issues. Nature. 2007;448(7156):959-63.
- Kaya-Okur HS, et al. CUT&Tag for efficient epigenomic profiling of small samples and single cells. Nat Commun. 2019;10(1):1930.
- Cramer P. Organization and regulation of gene transcription. Nature. 2019;573(7772):45-54.
- Henikoff S, Henikoff JG, Kaya-Okur HS, Ahmad K. Efficient chromatin accessibility mapping in situ by nucleosome-tethered tagmentation. eLife. 2020;9:e63274.
- Henikoff S, et al. Epigenomic analysis of formalin-fixed paraffin-embedded samples by CUT&Tag. Nat Commun. 2023;14(1):5930.
- Gilfillan GD, et al. Limitations and possibilities of low cell number ChIP-seq. BMC Genomics. 2012;13:645.
- Zhong J, et al. Enhanced and controlled chromatin extraction from FFPE tissues and the application to ChIP-seq. BMC Genomics. 2019;20(1):249.
- Groelz D, et al. Impact of storage conditions on the quality of nucleic acids in paraffin embedded tissues. PLoS One. 2018;13(9):e0203608.
- Xu Y, Henikoff S, Ahmad K. Chromatin profiling for everyone: FFPE-CUTAC for the theory and practice of modern molecular biology. Front Epigenet Epigenom. 2026;3:1753710.
- Henikoff S, et al. RNA polymerase II at histone genes predicts outcome in human cancer. Science. 2025;387(6735):737-43.
- Kent WJ, et al. BigWig and BigBed: enabling browsing of large distributed datasets. Bioinformatics. 2010;26(17):2204-7.
- Ramirez F, et al. deepTools2: a next generation web server for deep-sequencing data analysis. Nucleic Acids Res. 2016;44(W1):W160-5.
- Quinlan AR. BEDTools: the Swiss-Army tool for genome feature analysis. Curr Protoc Bioinformatics. 2014;47:11.12.1-11.12.34.
- Feng J, et al. Identifying ChIP-seq enrichment using MACS. Nat Protoc. 2012;7(9):1728-40.
- Zhao L, et al. FACT-seq: profiling histone modifications in formalin-fixed paraffin-embedded samples with low cell numbers. Nucleic Acids Res. 2021;49(21):e125.
Reprints and Permissions
This article has been published
Video Coming Soon