An erratum was issued for: Exploring Mitochondrial Energy Metabolism of Single 3D Microtissue Spheroids using Extracellular Flux Analysis. The Representative Results section was updated.
Erratum: Exploring Mitochondrial Energy Metabolism of Single 3D Microtissue Spheroids using Extracellular Flux Analysis
في هذه المقالة
ملخص
الملخص
An erratum was issued for: Exploring Mitochondrial Energy Metabolism of Single 3D Microtissue Spheroids using Extracellular Flux Analysis. The Representative Results section was updated.
Figure 5 was updated from:
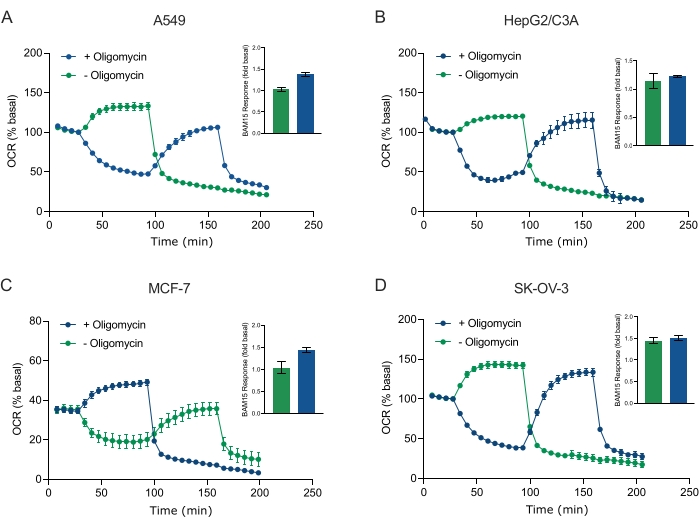
Figure 5: Single or sequential injection of mitochondrial respiratory compounds. Cancer-cell-derived spheroids of MCF-7, HEPG2/C3A, SK-OV-3, and A549 were placed into wells of an XFe96 spheroid microplate in XF RPMI and probed for OCR using the Agilent Seahorse XFe96 analyzer. OCR was measured 5x, after which 2 µg/mL oligomycin (injection Port A: green trace) or 5 µM BAM15 (injection Port A: blue trace or injection port B: green trace) to inhibit the mitochondrial ATP synthase and determine maximal respiratory capacity, respectively. Kinetic OCR data are expressed as % basal (A-D). Maximal respiratory capacity (OCRmax) was calculated as a factor of basal OCR by the equation: OCRmax = OCRBAM15 / OCRbasal. OCRmax was obtained from OCR averages across measurement cycles 8-10 post BAM15 injection with (green bars) and without (blue bars) oligomycin. Data are averages ± SEM from 3-8 individual well replicates across the spheroid assay microplate. Abbreviations: OCR = oxygen consumption rate. Please click here to view a larger version of this figure.
to:
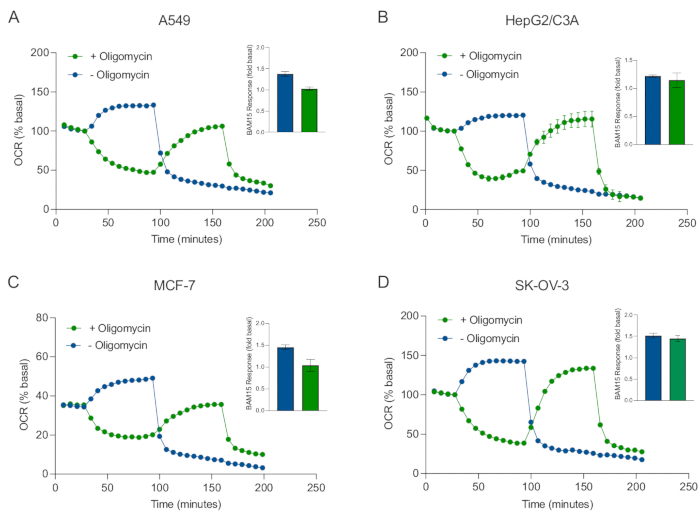
Figure 5: Single or sequential injection of mitochondrial respiratory compounds. Cancer-cell-derived spheroids of MCF-7, HEPG2/C3A, SK-OV-3, and A549 were placed into wells of an XFe96 spheroid microplate in XF RPMI and probed for OCR using the Agilent Seahorse XFe96 analyzer. OCR was measured 5x, after which 2 µg/mL oligomycin (injection Port A: green trace) or 5 µM BAM15 (injection Port A: blue trace or injection port B: green trace) to inhibit the mitochondrial ATP synthase and determine maximal respiratory capacity, respectively. Kinetic OCR data are expressed as % basal (A-D). Maximal respiratory capacity (OCRmax) was calculated as a factor of basal OCR by the equation: OCRmax = OCRBAM15 / OCRbasal. OCRmax was obtained from OCR averages across measurement cycles 8-10 post BAM15 injection with (green bars) and without (blue bars) oligomycin. Data are averages ± SEM from 3-8 individual well replicates across the spheroid assay microplate. Abbreviations: OCR = oxygen consumption rate. Please click here to view a larger version of this figure.
البروتوكول
An erratum was issued for: Exploring Mitochondrial Energy Metabolism of Single 3D Microtissue Spheroids using Extracellular Flux Analysis. The Representative Results section was updated.
Figure 5 was updated from:
Figure 5: Single or sequential injection of mitochondrial respiratory compounds. Cancer-cell-derived spheroids of MCF-7, HEPG2/C3A, SK-OV-3, and A549 were placed into wells of an XFe96 spheroid microplate in XF RPMI and probed for OCR using the Agilent Seahorse XFe96 analyzer. OCR was measured 5x, after which 2 µg/mL oligomycin (injection Port A: green trace) or 5 µM BAM15 (injection Port A: blue trace or injection port B: green trace) to inhibit the mitochondrial ATP synthase and determine maximal respiratory capacity, respectively. Kinetic OCR data are expressed as % basal (A-D). Maximal respiratory capacity (OCRmax) was calculated as a factor of basal OCR by the equation: OCRmax = OCRBAM15 / OCRbasal. OCRmax was obtained from OCR averages across measurement cycles 8-10 post BAM15 injection with (green bars) and without (blue bars) oligomycin. Data are averages ± SEM from 3-8 individual well replicates across the spheroid assay microplate. Abbreviations: OCR = oxygen consumption rate. Please click here to view a larger version of this figure.
to:
Figure 5: Single or sequential injection of mitochondrial respiratory compounds. Cancer-cell-derived spheroids of MCF-7, HEPG2/C3A, SK-OV-3, and A549 were placed into wells of an XFe96 spheroid microplate in XF RPMI and probed for OCR using the Agilent Seahorse XFe96 analyzer. OCR was measured 5x, after which 2 µg/mL oligomycin (injection Port A: green trace) or 5 µM BAM15 (injection Port A: blue trace or injection port B: green trace) to inhibit the mitochondrial ATP synthase and determine maximal respiratory capacity, respectively. Kinetic OCR data are expressed as % basal (A-D). Maximal respiratory capacity (OCRmax) was calculated as a factor of basal OCR by the equation: OCRmax = OCRBAM15 / OCRbasal. OCRmax was obtained from OCR averages across measurement cycles 8-10 post BAM15 injection with (green bars) and without (blue bars) oligomycin. Data are averages ± SEM from 3-8 individual well replicates across the spheroid assay microplate. Abbreviations: OCR = oxygen consumption rate. Please click here to view a larger version of this figure.
الإفصاحات
No conflicts of interest declared.