This study established a stable autologous transplantation model of endometriosis in SD rats and evaluated the biological activity of the GnRH antagonist Elagolix, providing a standardized platform for mechanistic research and preclinical drug assessment.
مقالة منهجية
Establishment of Rat Endometriosis Model by Autologous Endometrial Transplantation and Proof-of-Concept Pharmacological Validation with Elagolix
* These authors contributed equally
في هذه المقالة
ملخص
الملخص
Endometriosis (EM) is a common chronic gynecological disorder in women of reproductive age, yet its pathogenesis remains unclear, and current therapeutic options are limited by significant side effects. Endometriosis itself increases the risk of premature ovarian failure. Long-term lack of standardized treatment may accelerate the decline of ovarian function and prematurely trigger the aging process of the reproductive system. Reliable animal models are therefore essential for investigating disease mechanisms and evaluating novel treatments. This study presents a detailed protocol for establishing an endometriosis model in Sprague‑Dawley (SD) rats via autologous endometrial transplantation, and evaluates the therapeutic efficacy of the FDA‑approved gonadotropin‑releasing hormone (GnRH) antagonist Elagolix. The method involved excising uterine tissue, isolating endometrial fragments, and suturing them onto the peritoneal wall. At 21 days post‑surgery, ectopic lesions with typical cystic morphology had successfully formed in 18 out of 20 rats (90% success rate). Following model validation, Elagolix administration (100 mg/kg daily, oral gavage for 4 weeks) significantly reduced final lesion volume compared with the model group (inhibition rate: 86.7%), decreased serum levels of follicle‑stimulating hormone (FSH), luteinizing hormone (LH), and estradiol (E2), and suppressed peritoneal cytokine levels, including tumor necrosis factor‑α (TNF‑α), vascular endothelial growth factor (VEGF), and interleukin‑6 (IL‑6). Histopathological examination revealed glandular atrophy, reduced epithelial proliferation, and diminished inflammatory infiltration in Elagolix‑treated lesions. The model demonstrated several advantages, including operational simplicity, high stability, and avoidance of immune rejection. The pharmacological response to GnRH antagonism in this model demonstrated biological activity consistent with the known mechanism of Elagolix, although pain-related and behavioral outcomes were not evaluated. Collectively, this model provides a standardized and reliable platform for mechanistic studies and preclinical drug efficacy assessment in endometriosis.
المقدمة
Endometriosis (EM) is an estrogen-dependent disorder characterized by the presence of functional endometrial tissue (glands and stroma) outside the uterine cavity1,2. Affecting approximately 10%–15% of reproductive-aged women globally, it manifests as chronic pelvic pain, dysmenorrhea, dyspareunia, and infertility, severely compromising patients’ quality of life3. Endometriosis itself increases the risk of premature ovarian failure4. Long-term lack of standardized treatment may accelerate the decline of ovarian function and prematurely trigger the aging process of the reproductive system. Despite decades of research, the pathogenesis of EM remains elusive. Current clinical management, hormonal suppression, pain relief, and surgical resection, often yields suboptimal outcomes, marked by adverse effects and high recurrence rates5.
A major obstacle in EM research is the lack of robust disease models. EM occurs spontaneously only in humans and select non‑human primates, which restricts direct observation of early pathogenesis and limits high‑throughput intervention studies6. Although primate models closely mimic human pathophysiology, their use is constrained by ethical concerns, high costs, and limited accessibility7. In contrast, rodent models provide a practical and economical alternative for investigating ectopic lesion establishment, growth, and associated pathological processes8. The autologous endometrial transplantation technique, first established in rats by Vernon and Wilson in 19851, remains the most widely used modeling approach9. This method involves transplanting autologous uterine tissue to ectopic sites (e.g., peritoneal wall, mesentery, or ovarian vicinity), where it develops into vascularized cystic lesions that exhibit morphological and molecular parallels to human EM10,11. Importantly, rodent lesions recapitulate gene expression alterations observed in patients, further underscoring the model’s translational relevance12.
Elagolix (trade name Orilissa) is an orally active GnRH receptor antagonist approved by the FDA for mitigating moderate-to-severe endometriosis-associated pain13. By competitively binding pituitary GnRH receptors, it dose-dependently suppresses LH and FSH secretion, reducing circulating estrogen levels and inhibiting ectopic lesion growth14. In rat models, Elagolix serves as a positive control to validate post-modeling pharmacological evaluation systems15.
Although prior studies have described this modeling technique and Elagolix’s effects, critical procedural nuances, such as estrous cycle synchronization, endometrial graft preparation, and suturing precision, greatly influence modeling success and pharmacological accuracy16. The JoVE video-article format is uniquely suited to visually demonstrate these surgical and dosing protocols, enhancing inter-laboratory reproducibility17. This study provides a detailed, standardized protocol for autologous endometrial transplantation and Elagolix efficacy evaluation, offering a reference for establishing consistent models and advancing pharmacodynamic research.
البروتوكول
All experimental procedures and animal care were approved by the Ethics Review Committee for Animal Experimentation of the New Drug Evaluation Center, Hebei Yiling Medical Research Institute (Approval No. 2022144). Animals were obtained from a licensed laboratory animal supplier in Beijing, China (license No. SYXK (Jing) 2021-0011). The reagents and the equipment used are listed in the Table of Materials.
1. Experimental animals
NOTE: 30 mature, virgin female Sprague-Dawley (SD) rats (6–8 weeks old, weighing 180–220 g, specific pathogen-free [SPF] grade), were used in this study.
- House the animals under controlled environmental conditions at 20–26 °C with 40%–70% relative humidity, maintain them on a 12 h light/dark cycle, and provide food and water ad libitum. Allow all rats to acclimate to the housing conditions for one week prior to any experimental procedures to minimize stress-related variability.
2. Estrus synchronization
- To synchronize the estrous cycle and ensure uniform hormonal status among the animals, administer estradiol benzoate (100 µg/kg) to all rats by subcutaneous injection three days before the scheduled surgery.
3. Anesthesia and surgical preparation
- Anesthesia induction and maintenance: Anesthetize the rats with 5% isoflurane in air for induction in an induction chamber. Maintain anesthesia with 2.0%–2.5% isoflurane delivered via a face mask throughout the surgical procedure.
- Anesthesia monitoring: Continuously monitor the depth of anesthesia by assessing the pedal withdrawal reflex and righting reflex every 5 min. Consider the absence of both reflexes indicative of adequate surgical anesthesia.
- Eye protection: Apply ophthalmic ointment to both eyes to prevent corneal drying.
- Surgical site preparation: Shave the abdominal fur using an electric clipper, and sequentially disinfect the surgical site with iodophor (povidone-iodine, 0.5% available iodine) solution applied three times in concentric circles from the center outward.
- Temperature maintenance: Place the animal on a heating pad maintained at 37 °C to prevent hypothermia during surgery.
4. Uterine tissue harvesting
- Abdominal incision: Make a 2-cm midline longitudinal incision approximately 3 cm above the urethral orifice. Carefully dissect the subcutaneous fascia and rectus sheath to expose the abdominal cavity.
- Intestinal retraction: Use warm sterile saline (containing 2% penicillin-streptomycin) to moisten gauze pads, and gently retract the intestines to expose the bicornuate uterus located dorsal to the bladder.
- Uterine horn mobilization: Gently lift the left uterine horn, and carefully dissect any perimetrial adhesions to mobilize the horn.
- Ligation and excision: Ligate the distal end of the left uterine horn approximately 1 cm from the ovary using 4-0 silk sutures. Ligate the proximal end approximately 1 cm from the uterine bifurcation using the same suture material. Excise a 1–1.5 cm segment of the uterine horn between the two ligation points using sterile surgical scissors.
NOTE: Gentle handling is critical to avoid endometrial tearing during manipulation. - Tissue collection: Immediately place the excised uterine segment in ice-cold sterile saline supplemented with 2% penicillin-streptomycin for subsequent tissue processing.
5. Endometrial graft preparation
- Tissue opening: Longitudinally open the excised uterine segment using microsurgical scissors to expose the endometrial surface, which appears as a pink, villous layer.
- Endometrial separation: Under a dissecting microscope, hold the myometrium with forceps, and carefully separate the endometrium from the underlying muscular layer by blunt dissection. Assess the completeness of separation intraoperatively by visual inspection based on tissue appearance (endometrium as a pink, villous layer; myometrium as a white, dense layer); do not perform histological confirmation of residual myometrium.
NOTE: Gentle handling is critical to avoid endometrial tearing during separation. - Graft trimming: Trim the isolated endometrial tissue into a single fragment of approximately 4 × 4 mm and maintain it in sterile saline at room temperature until transplantation.
- Time management: Complete the entire graft preparation procedure within 30 min to minimize ischemic damage to the tissue.
NOTE: As an alternative to endometrial separation, full-thickness uterine wall transplantation (including the myometrium) has also been reported to achieve high engraftment success rates (>80%) with simplified handling.
6. Endometrial transplantation
- Surgical approach: Use a single 2-cm midline laparotomy to expose the peritoneal cavity and the uterus. Obtain the endometrial graft from and transplant it back into the same animal (autologous transplantation).
- Site selection: Select the right parietal peritoneal wall as the transplantation site, as parietal peritoneal injury is associated with less severe adhesion formation than visceral peritoneal injury.
- Graft placement: Identify a well-vascularized region on the right peritoneal wall. Place the endometrial fragment onto the peritoneal surface with the epithelial side facing outward (toward the abdominal cavity).
- Fixation: Secure the graft to the peritoneal wall using 6-0 absorbable sutures, with four anchoring stitches placed at the four corners of the fragment.
NOTE: Tie the sutures securely but not tightly, as excessive tension may compromise local blood supply and lead to ischemic necrosis—a major cause of graft failure.
7. Closure and postoperative care
- Hemostasis and irrigation: Carefully inspect the abdominal cavity for any signs of bleeding. Irrigate the surgical site with warm sterile saline, and apply penicillin sodium powder into the peritoneal cavity to reduce the risk of infection.
- Abdominal closure: Close the peritoneum and rectus sheath together using a continuous suture with 4-0 silk. Then close the rectus sheath and skin with interrupted sutures using the same suture material.
- Postoperative recovery: Place the rats on a heating pad maintained at 37 °C and allow them to recover until fully conscious.
- Postoperative care: House the animals individually in separate cages. Administer prophylactic penicillin (80,000 IU/day) intraperitoneally for 3 consecutive days to prevent postoperative infection, starting on the first day after surgery. To support graft survival, administer estradiol (100 µg/kg) intramuscularly every 4 days for a total of 3 doses, also starting on the first day after surgery.
- Monitoring: Monitor all animals daily for signs of pain or distress, including reduced mobility, piloerection, hunched posture, and reduced food intake. Humanely euthanize any animal showing severe signs according to institutional guidelines.
8. Model validation (Postoperative Day 21)
- Re-laparotomy: On postoperative day 21, re-anesthetize the rats using the same protocol described in the anesthesia section. Make a 5-mm incision parallel to the initial incision, and reopen the abdominal cavity to assess graft survival and lesion formation.
- Success evaluation: Evaluate the ectopic lesions based on the following criteria: (1) the presence of cystic structures filled with transparent or yellowish fluid; (2) visible neovascularization on the lesion surface; and (3) raised, vesicular morphology indicating active growth. Consider only animals meeting all three criteria as having successful engraftment and include them in subsequent experiments.
9. Experimental grouping
- At postoperative day 21, following confirmation of successful engraftment, randomize the 18 of the 20 rats that received endometrial transplantation and developed measurable lesions into the model (n = 9) and Elagolix (n = 9) groups. Include an additional 9 rats from the non-transplantation group that underwent sham surgery as the Sham group (n = 9).
- Define the three groups as follows:
- Sham-operated group: Subject the animals to laparotomy without endometrial transplantation and administer no drug intervention. Use this group as the normal control.
- Model group: Subject the animals to successful endometrial transplantation and administer an equivalent volume of the vehicle (Sterile Water for Injection) via oral gavage once daily. Use this group as the disease control.
- Model + Elagolix group: Subject the animals to successful endometrial transplantation and administer Elagolix suspended in the vehicle at a dose of 100 mg/kg via oral gavage once daily. Use this group as the drug intervention group.
10. Drug administration
- Initiate oral gavage in all treatment groups on postoperative day 21, which is the same day as model confirmation. Perform the procedure once daily at a fixed time (between 8:00 AM and 10:00 AM) for 4 consecutive weeks. Adjust the gavage volume weekly based on individual body weight measurements to maintain a constant dosing volume of 10 mL/kg.
- At the end of the 4-week intervention period, deeply anesthetize all animals with an intraperitoneal injection of 400 mg/kg chloral hydrate and subsequently sacrifice them. Collect ectopic lesions, peritoneal lavage fluid, and blood samples for subsequent histopathological and biochemical analyses.
11. Sample collection and analysis
- Collection of peritoneal lavage fluid for cytokine detection
- Following anesthesia with an intraperitoneal injection of 400 mg/kg chloral hydrate, suspend each rat in an inverted position. Inject 10 mL of serum-free DMEM medium into the peritoneal cavity from the lower portion of one side of the abdomen using a sterile syringe.
- Place the animal in a supine position, and gently massage the abdomen for 2–3 min to ensure even distribution of the medium. After a 5 min static period, aspirate approximately 8–9 mL of peritoneal lavage fluid using a syringe.
- Centrifuge the collected fluid at 4 °C and 3,000 x g for 10 min. Aliquot the supernatant and store it at −80 °C until further analysis.
- Determine the concentrations of tumor necrosis factor-alpha (TNF-α), interleukin-1 beta (IL-1β), interleukin-6 (IL-6), and vascular endothelial growth factor (VEGF) in the lavage supernatant using commercial enzyme-linked immunosorbent assay (ELISA) kits according to the manufacturer's instructions.
- Collection and measurement of endometriotic lesions
- After opening the abdominal cavity, carefully excise the ectopic endometrial tissues using surgical scissors. Remove each lesion together with the attached peritoneal wall tissue, and take care to avoid compressing the cystic lesions to prevent leakage of cystic fluid. For the sham-operated group, harvest an equivalent area of peritoneal wall tissue from the corresponding site. Measure the length (L), width (W), and height (H) of each lesion using a digital caliper. Calculate the volume of each lesion using the formula for an ellipsoid: V = L × W × H × π/6.
- Calculate the inhibition rate of lesion volume using the following formula:
Inhibition rate (%) = [1 − (mean lesion volume of the Elagolix group / mean lesion volume of the model group)] × 100%
NOTE: This calculation compares final lesion volumes between groups and does not assume equal baseline volumes. - Fix tissue samples from four rats per group in 10% neutral-buffered formalin for 24 h at room temperature for subsequent paraffin section preparation. Snap-freeze the remaining lesion tissues from the other rats in liquid nitrogen and store them at −80 °C until further molecular analyses.
- Serum hormone analysis
- Following deep anesthesia induced by an intraperitoneal injection of chloral hydrate at a dose of 400 mg/kg, fix each rat in the supine position on an operating table. Shave the abdominal fur and open the abdominal cavity via a midline incision.
- Withdraw approximately 4 mL of blood from the abdominal aorta using a sterile 23-G scalp vein needle attached to a syringe.
- After blood collection, perform cervical dislocation as a secondary physical method to ensure death. Confirm death by the absence of heartbeat and respiration. Apply humane endpoints, including >20% weight loss, body condition score ≤2, or inability to rise for >24 h.
- Allow the collected blood samples to clot at room temperature for 30 min, and then centrifuge them at 3,000 x g for 10 min at 4 °C. Aliquot the separated serum into microcentrifuge tubes and store it at −80 °C until further analysis.
- Determine the serum concentrations of follicle-stimulating hormone (FSH), luteinizing hormone (LH), and estradiol (E2) using commercial enzyme-linked immunosorbent assay (ELISA) kits according to the manufacturer's instructions.
- Western blot analysis
- Protein extraction
- Homogenize ectopic lesion tissues in an appropriate volume of radioimmunoprecipitation assay (RIPA) lysis buffer containing protease and phosphatase inhibitors using a tissue grinder.
- Centrifuge the homogenates at 14,000 x g for 20 min at 4 °C.
- Collect the supernatants, and determine protein concentrations using a bicinchoninic acid (BCA) protein assay kit according to the manufacturer's instructions.
- Denature the protein samples by heating at 95 °C for 5 min in loading buffer.
- Gel Electrophoresis
- Separate equal amounts of protein (20 µg per lane) by sodium dodecyl sulfate-polyacrylamide gel electrophoresis (SDS-PAGE) and load them in duplicate. Perform electrophoresis at a constant voltage of 130 V for 1.5 h.
- Protein transfer
- Transfer the separated proteins onto nitrocellulose (NC) membranes using a rapid wet transfer system at a constant current for 16 min.
- Blocking and antibody incubation
- Block the membranes with blocking buffer for 30 min at room temperature. Subsequently, incubate the membranes with primary antibodies against ICAM-1 (anti-ICAM-1) (dilution 1:1000) and VEGF (anti-VEGF) (dilution 1:1000), as well as the loading control anti-α-Tubulin (dilution 1:1000), overnight at 4 °C (12–16 h). After incubation, wash the membranes three times with 1× TBST (Tris-buffered saline with Tween-20), 10 min each.
- Incubate the membranes with secondary antibodies, including Goat Anti-Mouse IgG H&L (Alexa Fluor 680) and Goat anti-Rabbit IgG H&L (Alexa Fluor 790), in the dark for 1 h at room temperature. Wash the membranes three times with 1× TBST, 10 min each.
- Imaging and quantification
- Scan the blots using the LI-COR DLx imaging system. Quantify the gray values of the target protein bands and the internal reference (α-Tubulin), and calculate the relative expression levels of each target protein using the following formula:
Relative Expression Level = Gray Value of Target Protein / Gray Value of Internal Reference.
- Scan the blots using the LI-COR DLx imaging system. Quantify the gray values of the target protein bands and the internal reference (α-Tubulin), and calculate the relative expression levels of each target protein using the following formula:
- Protein extraction
- Histopathological observation of ectopic lesions
- Tissue dehydration
- Remove the ectopic lesion tissues and place them in a fume hood. Trim each tissue sample to a uniform thickness, pair it with its corresponding label, and place it into a tissue embedding cassette.
- Load the cassettes into a basket and dehydrate them using an automated tissue dehydrator according to the following sequential protocol: 75% ethanol for 4 h, 85% ethanol for 2 h, 90% ethanol for 2 h, 95% ethanol for 1 h, absolute ethanol I for 30 min, absolute ethanol II for 30 min, alcohol-benzene solution for 10 min, xylene I for 10 min, xylene II for 10 min, paraffin wax I for 1 h, paraffin wax II for 1 h, and paraffin wax III for 1 h.
- Paraffin embedding
- Pour molten paraffin wax into embedding molds. Remove the tissues from the embedding cassettes, orient them according to the desired sectioning plane, and place them into the embedding molds before the wax solidifies.
- Carefully match each tissue with its corresponding label. Place the embedding molds at −20 °C until the wax solidifies completely. Remove the solidified wax blocks from the molds and trim them to expose the tissue surface.
- Sectioning
- Section the trimmed wax blocks using a rotary microtome at a thickness of 4 µm. Transfer the sections to a water bath set at 40 °C to allow complete flattening.
- Mount the flattened sections onto glass slides and dry them in an oven at 60 °C.
- Hematoxylin and Eosin (HE) staining
- Deparaffinize and rehydrate the paraffin-embedded sections by sequential immersion in xylene I for 20 min, xylene II for 20 min, absolute ethanol I for 10 min, absolute ethanol II for 10 min, 95% ethanol for 5 min, 90% ethanol for 5 min, 80% ethanol for 5 min, and 70% ethanol for 5 min, followed by rinsing with distilled water.
- For nuclear staining, immerse the sections in Harris hematoxylin for 5 min, rinse with distilled water, differentiate in 1% hydrochloric acid in 70% ethanol for 3–5 s, rinse again with distilled water, and then counterstain in 0.6% ammonia water for 3–5 s, followed by another rinse with distilled water.
- For cytoplasmic staining, immerse the sections in eosin solution for 2 min.
- Dehydrate and clear the stained sections by sequential immersion in 95% ethanol I for 5 min, 95% ethanol II for 5 min, absolute ethanol I for 5 min, absolute ethanol II for 5 min, xylene I for 5 min, and xylene II for 5 min. After brief air-drying, mount the sections with neutral balsam and cover them with coverslips.
- Examine the HE-stained sections under a light microscope. Carefully observe and photograph the morphological characteristics of the ectopic endometrial lesions, including glandular architecture, epithelial integrity, stromal cellularity, and the presence of inflammatory cell infiltration, at 200 × magnification. Capture representative images for qualitative comparison among groups.
- Tissue dehydration
12. Statistical analysis
- Present all data as mean ± SEM. Perform statistical analyses using statistical and graphing software. Assess the normality of data distribution using the Shapiro–Wilk test.
- For comparisons among three groups, use one-way analysis of variance (ANOVA) followed by Dunnett's post hoc test. For comparisons between two groups, use an unpaired two-tailed Student's t-test.
- For body weight and lesion volume measurements, apply repeated-measures or one-way ANOVA as appropriate. Consider a P value < 0.05 statistically significant. Indicate significance levels as *P < 0.05 and **P < 0.01. Perform all experiments with at least three biological replicates per group, as indicated in the figure legends.
النتائج
Post-modeling rat survival and general conditions
During the model establishment period, all rats maintained satisfactory general health status, as evidenced by normal locomotor activity, glossy fur and claws, and regular food/water intake and defecation. No adverse effects, including weight loss, abdominal distension, infection, or mortality, were observed throughout the surgical and postoperative recovery period.
Gross observations and modeling success rate
At postoperative day 21, second‑look laparotomy confirmed that the endometrial grafts transplanted onto the peritoneal wall had successfully developed into typical cystic ectopic lesions in the model group. These lesions appeared as translucent, elevated, sac‑like structures filled with clear or yellowish fluid, with prominent neovascularization observed on the lesion surface (Figure 1). Of the 20 model rats, 18 (90%) exhibited viable grafts with characteristic ectopic lesions. No abnormal cystic structures were observed in the sham‑operated group.
Histopathological analysis of ectopic lesions
Histopathological examination of the ectopic lesions revealed endometrial components in all grafts of the model rats. The lesions exhibited typical columnar glandular epithelial cells surrounding glandular lumina, with abundant spindle-shaped endometrial stromal cells in the stroma. Subnuclear vacuoles were observed in some glandular epithelial cells, and numerous inflammatory cells had infiltrated the glandular margins (Figure 2A,B). Following 4 weeks of repeated Elagolix administration (100 mg/kg, oral gavage), the ectopic lesions showed marked histological changes compared with the model group. The treated group exhibited a reduction in gland number, atrophy of the glandular epithelium, and only sparse inflammatory cell infiltration in the stroma (Figure 2C,D).
To further quantify the histopathological changes, a predefined semiquantitative scoring system (0–3 per parameter) was applied to assess glandular epithelium, epithelial thickness, stromal cellularity, and inflammatory infiltration. In the Model group, the lesions exhibited high scores for glandular epithelium (median = 1.5), epithelial thickness (median = 1.75), stromal cellularity (median = 2), and inflammatory infiltration (median = 2.75). Following 4 weeks of Elagolix administration, three parameters were significantly reduced compared with the Model group: glandular epithelium (median = 0.25, P < 0.05), epithelial thickness (median = 0.75, P < 0.05), and inflammatory infiltration (median = 1.25, P < 0.01) (Figure 2E).
Elagolix reduced the volume of ectopic lesions in rats with endometriosis
A total of 27 rats completed the entire experimental protocol, and no drug-related adverse reactions were observed in any animal throughout the study. Body weight did not differ significantly among the groups before or after the 4‑week treatment period (P > 0.05) (Figure 3B). At the end of the 4‑week repeated administration, the mean volume of endometriotic lesions in the model group was significantly larger than that in the normal group (P < 0.01). In contrast, treatment with Elagolix at 100 mg/kg significantly reduced the mean lesion volume compared with the model group (P < 0.01), with an inhibition rate of 86.7% (Figure 3A,C). During sample collection, mild, filmy adhesions were observed in some animals, but these were easily separated and did not interfere with lesion evaluation or sample collection.
Elagolix significantly reduced serum FSH, LH, and E2 concentrations in endometriosis rats
Elagolix significantly reduced serum FSH, LH, and E2 levels in endometriosis rats. Compared with the normal group, the model group exhibited significantly elevated serum concentrations of FSH, LH, and E2. Following 4 weeks of repeated administration, serum FSH, LH, and E2 levels in the Elagolix-treated group were significantly decreased compared with those in the model group (Figure 4A–C).
Elagolix significantly reduced the peritoneal levels of the cytokines TNF‑α, VEGF, and IL‑6 in endometriosis rats
Compared with the normal group, the model group exhibited significantly elevated levels of TNF‑α, IL‑6, and VEGF. IL‑1β levels were also increased in the model group, although this difference did not reach statistical significance. After 4 weeks of repeated Elagolix administration (100 mg/kg, oral gavage), the levels of TNF‑α, IL‑6, and VEGF were significantly reduced compared with the model group. IL‑1β levels showed a decreasing trend, but the difference was not statistically significant (Figure 4D–4G).
Elagolix inhibited the expression of ICAM-1 and VEGF in ectopic lesions of endometriosis rats
Western blot analysis revealed that after 4 weeks of repeated Elagolix administration (100 mg/kg, oral gavage), the protein expression levels of the adhesion molecule ICAM‑1 and the angiogenic factor VEGF in ectopic lesions were significantly reduced compared with those in the model group (Figure 5A–5C).
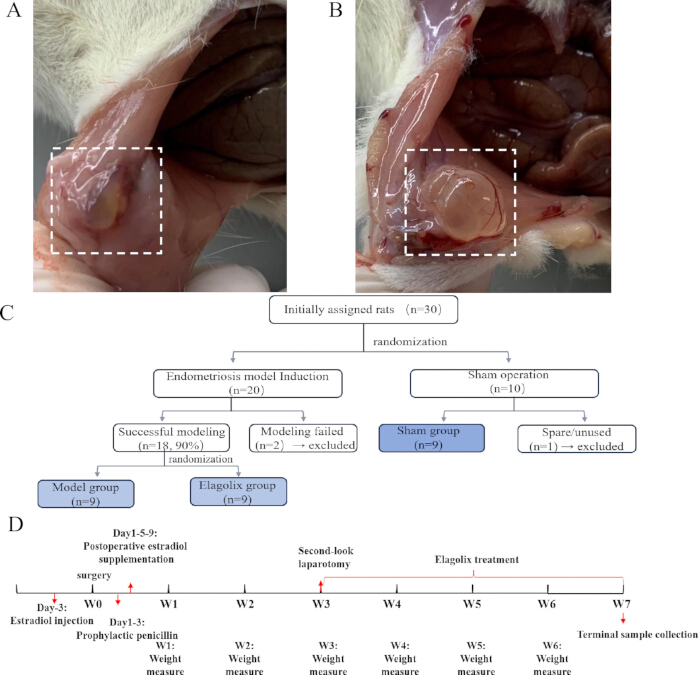
Figure 1: Establishment of a rat endometriosis model and experimental design. (A,B) Gross observation of ectopic implantation sites at 21 days after surgical induction of endometriosis. Representative macroscopic photographs of autologous endometrial tissue transplanted onto the peritoneal wall. Images were captured using a digital camera. At 21 days post-surgery, the transplanted tissues had enlarged and developed into elevated, translucent, multilocular cystic structures filled with clear or pale yellow fluid. Abundant neovascularization was visible on the lesion surface. Boxes indicate ectopic lesions. (C) Flowchart of animal allocation. Of 30 female SD rats, 20 received autologous endometrial transplantation; 18 developed measurable lesions (90%) and were randomized into the model (n = 9) and Elagolix (n = 9) groups. Two rats with failed engraftment were excluded. Nine rats from the non-transplantation group underwent sham surgery and served as the Sham group (n = 9); one spare rat was excluded. A total of 27 animals were included in the final analysis. (D) Experimental timeline. Estradiol benzoate (100 µg/kg, s.c.) was given on day −3 for estrous synchronization. Transplantation was performed on day 0. Penicillin (80,000 IU/day, i.p.) was given on days 1–3, and estradiol supplementation (100 µg/kg, i.m.) on days 1, 5, and 9. Body weight was measured weekly from week 1 to week 6. Model validation and randomization occurred on day 21, followed by Elagolix treatment (100 mg/kg, oral gavage, daily) from week 3 to week 7. Terminal samples were collected on day 49. Please click here to view a larger version of this figure.
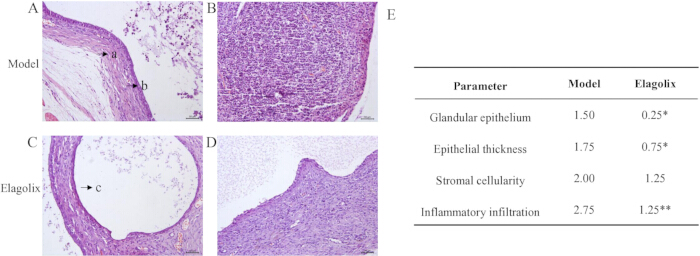
Figure 2: Histopathological changes in ectopic endometrial lesions following Elagolix treatment. Representative HE-stained sections of autologous endometrial tissues transplanted onto the peritoneal wall of rats. In all grafts, endometrial epithelial cells, glandular structures, and stromal cells were observed. (A,B) In the model group, the ectopic lesions displayed intact endometrial architecture, characterized by typical columnar glandular epithelial cells forming glandular lumina, abundant spindle-shaped endometrial stromal cells in the stroma, and extensive inflammatory cell infiltration at the glandular margins. (C,D) Following Elagolix treatment (100 mg/kg, oral gavage for 4 weeks), the ectopic lesions exhibited marked histological regression, including reduced glandular number, glandular epithelial atrophy, and only sparse inflammatory cells in the stroma. Arrows indicate: a, stromal tissue; b, glandular epithelium; c, cystic cavity. (E) Semiquantitative histopathological scores for glandular epithelium, epithelial thickness, stromal cellularity, and inflammatory infiltration. Each parameter was scored on a 0–3 scale (0 = absent/normal, 1 = mild, 2 = moderate, 3 = severe). Data are presented as the median score of each group. *p < 0.05, **p < 0.01 vs. model group (Student's t-test). All sections were examined at ×200 magnification (scale bar: 50 µm). Please click here to view a larger version of this figure.
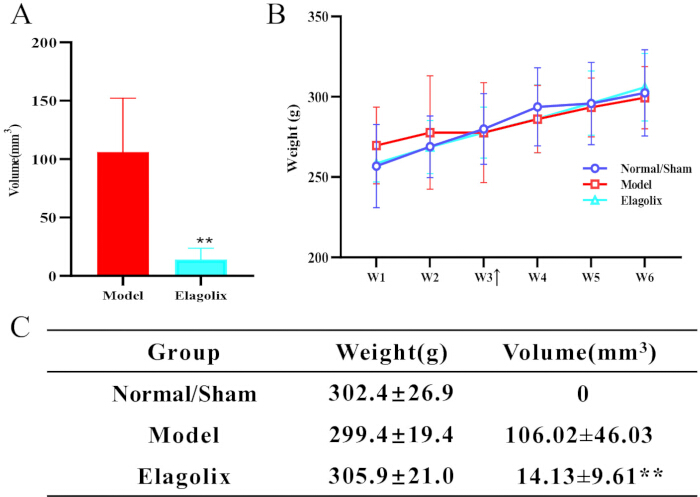
Figure 3: Effects of repeated administration of Elagolix on the rat endometriosis model. (A) Quantification of ectopic lesion volume in the model and Elagolix-treated (100 mg/kg, oral gavage for 4 weeks) groups (n = 9 per group). Lesion volume was calculated using the formula: V = L × W × H × π/6. (B) Body weight changes of rats in each group throughout the 4‑week treatment period. Body weight was recorded weekly. (C) Table summarizing the final lesion volume and final body weight of each group at the end of the 4‑week treatment period. All data are expressed as mean ± SEM. *p < 0.05, **p < 0.01 vs. model group (Dunnett’s test). SEM, standard error of the mean. Please click here to view a larger version of this figure.
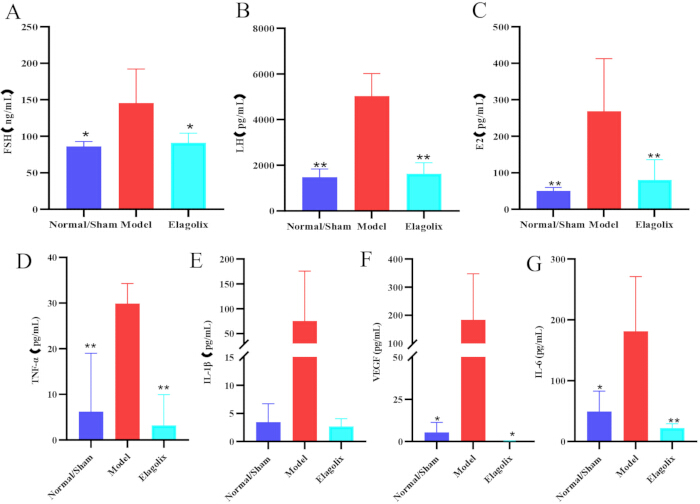
Figure 4: Effects of repeated Elagolix administration on serum hormone levels and peritoneal inflammatory cytokines in the rat endometriosis model. (A) Serum follicle-stimulating hormone (FSH) concentrations. (B) Serum luteinizing hormone (LH) concentrations. (C) Serum estradiol (E2) concentrations. (D) Peritoneal lavage fluid levels of tumor necrosis factor-alpha (TNF-α). (E) Peritoneal lavage fluid levels of interleukin-1 beta (IL-1β). (F) Peritoneal lavage fluid levels of vascular endothelial growth factor (VEGF). (G) Peritoneal lavage fluid levels of interleukin-6 (IL-6). All measurements were performed in the Normal/Sham group, the model group, and the Elagolix-treated group (100 mg/kg, oral gavage for 4 weeks). For all assays, n = 4 per group. Data are expressed as mean ± SEM. *p < 0.05, **p < 0.01 vs. model group (Dunnett's test). Abbreviations: FSH, follicle-stimulating hormone; LH, luteinizing hormone; E2, estradiol; TNF-α, tumor necrosis factor-alpha; IL-1β, interleukin-1 beta; IL-6, interleukin-6; VEGF, vascular endothelial growth factor; SEM, standard error of the mean. Please click here to view a larger version of this figure.
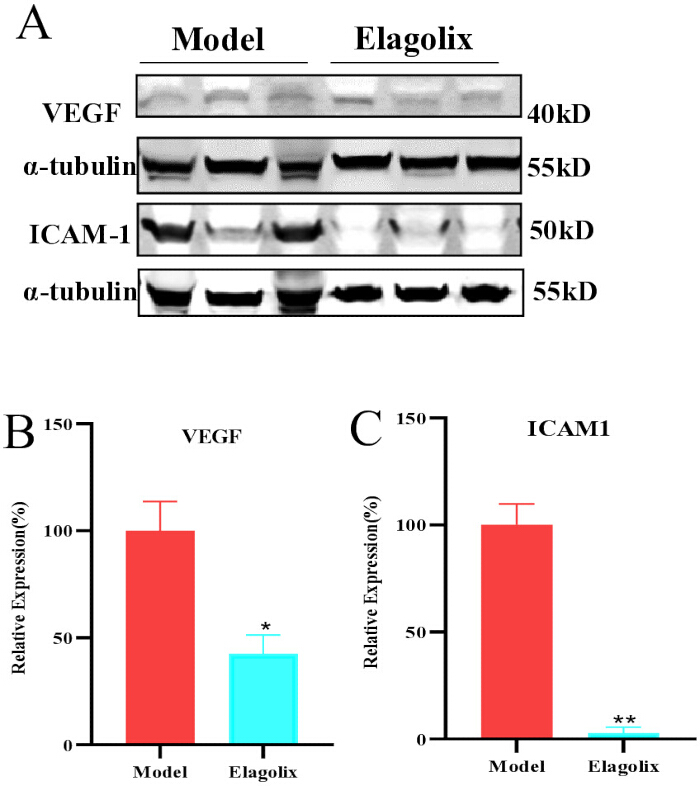
Figure 5: Effects of repeated Elagolix administration on VEGF and ICAM-1 protein expression in ectopic lesions of the rat endometriosis model. (A) Representative Western blot bands of VEGF, ICAM-1, and α-Tubulin (loading control) in the model and Elagolix-treated groups (100 mg/kg, oral gavage for 4 weeks). Each lane represents a biological replicate from a different rat (n = 3 per group). (B) Quantitative analysis of VEGF protein expression normalized to α-Tubulin. (C) Quantitative analysis of ICAM-1 protein expression normalized to α-Tubulin. All data are expressed as mean ± SEM (n = 3 per group). *p < 0.05, **p < 0.01 vs. model group (Student's t-test). Abbreviations: VEGF, vascular endothelial growth factor; ICAM-1, intercellular adhesion molecule-1; SEM, standard error of the mean. Please click here to view a larger version of this figure.
المناقشة
The rat autologous endometrial transplantation model demonstrated a high success rate of 90%, consistent with literature reports of 82.5–92.5%1, confirming its reliability for endometriosis induction. The ectopic lesions not only exhibited characteristic cystic morphology but also displayed well-defined glandular and stromal components, closely resembling human endometriotic implants10,16. The model’s robustness was attributed to meticulous control of key factors: (1) estrus synchronization ensured high estrogen levels at transplantation, optimizing graft survival; (2) precise surgical techniques minimized tissue trauma and ischemia; (3) postoperative estrogen supplementation sustained lesion growth. While the peritoneal wall was chosen for its accessibility and minimal adhesions, prior studies suggest ovarian transplantation yields larger lesions due to local estrogen dominance18. Thus, transplant site selection should align with experimental goals—ovarian regions for maximal tissue yield (e.g., protein/RNA extraction) and peritoneal sites for longitudinal monitoring. While a formal a priori power analysis was not performed in this study. The sample size was based on previously published studies using this model, and the ELISA and Western blot analyses should be considered exploratory.
Elagolix exerted therapeutic effects by suppressing the hypothalamic-pituitary-ovarian (HPO) axis via GnRH receptor antagonism, thereby reducing systemic estrogen levels, a key driver of lesion proliferation. Our findings validated this mechanism at three levels: (1) macroscopic (significant volume reduction); (2) molecular (downregulation of serum FSH/LH/E2, pro-inflammatory cytokines, and angiogenic factors); and(3) histopathological (glandular atrophy and resolution of inflammation). These concordant results demonstrate biological activity consistent with the known mechanism of GnRH antagonism, although pain-related and behavioral outcomes were not evaluated. However, the model primarily captures established lesions’ regression rather than early disease mechanisms, limiting its applicability for preventive interventions or studies on initial lesion formation.
Despite its advantages, the surgical model has inherent limitations. Unlike spontaneous human endometriosis, which involves chronic immune dysregulation, genetic predisposition, and retrograde menstruation, this model artificially recapitulates only late-stage "ectopic survival and growth"8. Additionally, rats lack menstrual cycles, exhibiting short estrus phases (4–5 days) without cyclic bleeding, thus precluding studies on menstruation-related phenomena (e.g., dysmenorrhea)9. In this study, model validation was performed by direct visualization at laparotomy. Although non-invasive imaging methods such as high-frequency ultrasound or MRI would allow longitudinal monitoring of lesion growth without additional surgery, these techniques were not available in our laboratory at the time of the study. Future refinement of this model could incorporate non-invasive imaging to reduce animal use and enable dynamic assessment of lesion development. Treatment allocation was not concealed, and investigators were not blinded during lesion measurement, histopathological assessment, laboratory analyses, Western blot quantification, or statistical analysis. This lack of blinding may introduce detection and performance bias, particularly for subjective outcome measures such as histopathological scoring. Future studies should incorporate allocation concealment and blinded outcome assessment to further strengthen the internal validity of the findings. Prophylactic antibiotics (penicillin) were administered intraoperatively and postoperatively to prevent infection-related graft failure. Antibiotics can modulate peritoneal macrophage function and inflammatory cytokine release, and broad-spectrum antibiotics have been reported to inhibit early endometriotic lesion growth in experimental models. Because the antibiotic regimen was identical across all groups, this effect is expected to be distributed equally and should not systematically bias the between-group comparison. However, the absolute cytokine concentrations and lesion volumes in this study should be interpreted in the context of concurrent antibiotic exposure.
Future studies could integrate transgenic models (e.g., cytokine-overexpressing rats) to dissect specific molecular pathways in drug responses, complemented by multimodal assessments (dynamic imaging, molecular biomarkers, multi-omics) for comprehensive pharmacodynamic profiling. Such approaches would bridge translational gaps while addressing mechanistic complexities unique to human disease progression.
الإفصاحات
The authors declare that they have no competing financial interests.
شكر وتقدير
This work was supported by the Yanzhao Golden Platform (A20240022), National Key Research and Development Program ‘Modernization of Traditional Chinese Medicine’(No. 2023YFC3504300) and S&T Program of Hebei(No.23379902L)
المواد
| الاسم | الشركة | رقم فهرسي | التعليقات |
|---|---|---|---|
| 4-0 Silk Suture | Shanghai Jinhuan | F404 | Ligation of both ends of the uterine horn to interrupt blood supply prior to uterine tissue harvest; abdominal wall closure |
| 5x sample buffer | Genscript | MB01015 | |
| 6-0 Absorbable Suture | Shanghai Jinhuan | F603 | Fixation of endometrial fragments to the peritoneal wall or abdominal wall muscle |
| alpha-Tubulin Antibody | CST | 2144 | |
| Antibody Dilution Buffer | Beyotime | P0951 | |
| Anti-ICAM1 antibody | Abcam | ab282575 | |
| Anti-VEGF antibody | Abcam | ab46154 | |
| BCA Protein Colorimetric Assay Kit | Elabscience | E-BC-K318-M | |
| Blocking Buffer | Beyotime | P0023B | |
| CHB-202 Heating Dry Bath | Gene | CHB-202 | For protein denaturation |
| Chloral Hydrate | Tianjin Kermel | 001-400-250g | |
| Digital Camera | Canon | EOS R100 | For lesion imaging |
| DMEM | Wuhan Procell Biotechnology | PM150210 | |
| E260 Vertical Electrophoresis System | GE Healthcare UK Ltd | E260 | For protein separation |
| eBlot L1 transfer system kit | Genscript | L00729C | |
| eBlot L1 Fast Wet Transfer System | GenScript | eBlot L1 | For protein transfer |
| Elagolix Sodium | Innovation | N/A | Purity: 98.9% (HPLC) |
| Electronic Balance (0.1 mg precision) | Changshu Shuangjie (G&G) | DT2000 | For weighing rats |
| Experimental animals | Beijing Vital River Laboratory Animal Technology Co., Ltd. | Certificate No. SYXK (Jing) 2021-0011 | |
| Gene Speed 1580R Refrigerated Centrifuge | Gene | Gene Speed 1580R | For sample centrifugation |
| General Surgical Instrument Set | RWD Life Science | N/A | Contains scalpel, tissue scissors, forceps, needle holder, etc., for laparotomy and basic surgical procedures |
| Goat Anti-Mouse IgG H&L (Alexa Fluor® 680) | Abcam | ab186694 | |
| Goat Anti-Rabbit IgG H&L (Alexa Fluor® 790) | Abcam | ab175781 | |
| Hematoxylin-Eosin (HE) Stain Kit | Solarbio | G1120 | |
| Infinite M200 PRO Microplate Reader | Tecan | Infinite M200 PRO | For absorbance measurement |
| Isoflurane | EZVET | 709014 | |
| Odyssey CLx Near-Infrared Dual-Color Laser Imaging System | LI-COR Biosciences | Odyssey CLx | For Western blot membrane imaging |
| Ophthalmic Surgical Instruments | RWD Life Science | N/A | Ophthalmic scissors and micro-forceps for fine separation of endometrium from myometrium |
| Optical Microscope | Olympus | BX41 | For histopathological observation |
| Oral Gavage Needle (16G, curved tip) | Shanghai Yuyan | 16G | For oral administration of Elagolix |
| Penicillin G Sodium | North China Pharmaceutical | National Drug Approval No. H13020429 | |
| Penicillin-Streptomycin (Pen-Strep) | Thermo scientific | 15140122 | |
| protein Marker | Thermo scientific | 26620 | |
| R500IE Small Animal Anesthesia Machine | RWD Life Science | R500IE | For rat anesthesia |
| Rat (E2) ELISA Kit | Abbexa | abx354051 | |
| Rat (FSH) ELISA Kit | Abbexa | abx155543 | |
| Rat (LH) ELISA Kit | Abbexa | abx155794 | |
| Rat IL-1β High Sensitivity ELISA Kit | Multi Science | EK301BHS | |
| Rat IL-6 High Sensitivity ELISA Kit | Multi Science | EK306BHS | |
| Rat TNF-α High Sensitivity ELISA Kit | Multi Science | EK382HS | |
| Rat VEGF High Sensitivity ELISA Kit | Multi Science | EK383HS | |
| RIPA Buffer (high) | Solarbio | R0010 | |
| Rotary Microtome | Kelatay | CR-601ST | For histological sectioning |
| Sample Tissue Grinder | Shanghai Jingxin | Tissuelyser-32L | For tissue homogenization |
| Sodium Chloride Injection | Shijiazhuang No.4 Pharmaceutical | National Drug Approval No. H13023201 | |
| Sterile Blood Collection Needles | Jiangxi Hongda | National Medical Device Approval No. 20173220633 | |
| Sterile Blood Collection Tubes | Junnuo | EDTAK2 | |
| Sterile Water for Injection | Shijiazhuang No.4 Pharmaceutical | National Drug Approval No. H20046572 | |
| Stradiol Benzoate Injection | Shanghai Quanyu | N/A | |
| SurePAG Plus, Bis-Tris, gel | Genscript | M01176 | |
| TBST | Seven Biotech | SW111-02 | |
| Tissue Fixative Solution | Solarbio | IF9010 | |
| Vernier Caliper | Mitutoyo | M-532 | For measuring lesion size and cutting tissue dimensions |
| WD-9405D Decolorizing Shaker | Beijing Liuyi | WD-9405D | For membrane blocking and washing |
| WS-350P Microplate Shaker | Wiggens Labortechnik GmbH | WS-350P | For ELISA plate incubation |
| ZWYR-240 Benchtop Incubated Shaker | Shanghai Zhicheng | ZWYR-240 | For Western blot antibody incubation |
المراجع
- Vernon MW, Wilson EA. Studies on the surgical induction of endometriosis in the rat. Fertil Steril. 1985;44(5):684-94.
- Giudice LC, Kao LC. Endometriosis. Lancet. 2004;364(9447):1789-99.
- Zondervan KT, Becker CM, Missmer SA. Endometriosis. N Engl J Med. 2020;382(13):1244-56.
- Gao Y et al. Progress on the mechanism of endometriosis-induced premature ovarian insufficiency. Chin J Reprod Contracept. 2026;46(3):288-92.
- Vercellini P, Viganò P, Somigliana E, Fedele L. Endometriosis: pathogenesis and treatment. Nat Rev Endocrinol. 2014;10(5):261-75.
- D'Hooghe TM et al. Nonhuman primate models for translational research in endometriosis. Reprod Sci. 2009;16(2):152-61.
- Story L, Kennedy S. Animal models of endometriosis. Womens Health (Lond). 2007;3(4):463-75.
- Bruner-Tran KL, Osteen KG. Rodent models of experimental endometriosis. Methods Mol Biol. 2018;1850:163-78.
- Sharpe-Timms KL. Using rats as a research model for the study of endometriosis. Ann N Y Acad Sci. 2002;955:318-27.
- Rajkumar K, Schott PW, Simpson CW. The rat as an animal model for endometriosis to examine recurrence of ectopic endometrial tissue after radiation therapy. Fertil Steril. 1990;53(5):921-25.
- Matsubayashi H et al. Leukocyte subpopulation changes in rats with autotransplanted endometrium and the effect of danazol. Am J Reprod Immunol. 1995;33(4):301-14.
- Flores I, Rivera E, Ruiz LA, Santiago OI, Vernon MW, Appleyard CB. Molecular profiling of experimental endometriosis identified gene expression patterns in common with human disease. Fertil Steril. 2007;87(5):1180-99.
- Taylor HS et al. Treatment of endometriosis-associated pain with elagolix, an oral GnRH antagonist. N Engl J Med. 2017;377(1):28-40.
- Lamb YN. Elagolix: first global approval. Drugs. 2018;78(14):1501-8.
- Wang Q, Gu EM, Chen CJ, Xu RA, Luo SB. Analytical methodology and pharmacokinetic study of elagolix in plasma of rats using a newly developed UPLC-MS/MS assay. Arab J Chem. 2021;14(7):103250.
- Uchiide I, Ihara T, Sugamata M. Pathological evaluation of the rat endometriosis model. Fertil Steril. 2002;78(4):782-86.
- Pelch KE, Sharpe-Timms KL, Nagel SC. Mouse model of surgically-induced endometriosis by auto-transplantation of uterine tissue. J Vis Exp. 2012;(59).
- He J, Zeng JF, Liu YH. Comparison of autotransplantation sites in a rat model of endometriosis. Acad J Second Mil Med Univ. 2016;37(4):513-16.