一种用于检测水样(包括处理后的废水中和地表受纳水)有机提取物内分泌活性的方案,已通过商业可得的分裂阻滞法(“冻融”法)进行改良。 体外 转录激活生物测定
需要JoVE订阅才能观看此内容。 请登录或开始免费试用
本文内容
摘要
摘要
体外 转录激活生物测定法已显示出作为水质监测工具的潜力,但其推广和广泛应用在一定程度上受到缺乏标准化方法以及可靠、用户友好型技术难以获取的限制。本研究采用市售的分裂阻滞细胞系,对环境质量专业人员关注的水样中化学物质的内分泌活性进行定量筛查。通过基于细胞的荧光共振能量转移(FRET)检测方法,建立了一种包含全面质量保证/质量控制(QA/QC)检查的单一标准化方案,用于检测雌激素受体和糖皮质激素受体活性(分别为ER和GR)。对来自美国加利福尼亚州(USA)淡水系统的经处理的城市废水排放水和地表水样品,采用固相萃取法进行提取,并利用该标准化方案分析其内分泌活性。针对终点特异性参比化学物质的背景值和剂量-反应曲线均符合可靠测量所必需的QA/QC标准。地表水样品的生物测定筛查反应大多未检出。相比之下,二级处理厂的排放水样品表现出最高的可测活性,GR的生物测定当量浓度(BEQs)最高达392 ng地塞米松/L,ER则为17 ng 17β-雌二醇/L。三级处理出水样品的生物测定反应低于二级处理出水,表明经过高级处理后,内分泌活性化学物质的残留水平较低。该方案表明,利用市售分裂阻滞细胞"试剂盒"的体外转录激活生物测定法可被适用于水中内分泌活性的筛查。
引言
当前的水质监测依赖于准确且精确地测量化学污染物的存在情况,以此作为野生动物和人类暴露风险的替代指标。然而,这种逐项化学物质监测与评估的范式已无法跟上我们所面临的不断变化的化学物质环境。随着对合成与天然化学物质的归趋及其效应的深入了解,我们持续寻求能够反映预期生物学影响的检测工具,同时这些工具还需不受化学物质生产、使用及环境输入变化的干扰。此类工具对于判断未知或新型化学物质以及转化产物是否值得关注尤为重要。此外,水体中复杂的化学物质混合物难以通过单一化学物质监测加以充分评估。因此,我们面临更新现有监测工具箱的挑战,以更有效地应对受污水处理厂出水及城市/雨水径流排放影响的地表水中的上述问题。
近年来,生物分析技术作为水质评估的筛查工具展现出良好的应用前景。特别是 体外 通过已知特定作用机制对化学物质产生响应的生物测定法1,2 对环境监测领域具有重要意义3. 许多研究已采用 体外 用于定量饮用水、地表水和废水中内分泌活性的生物测定法4 -6此外,许多生物测定方法针对分子起始事件(例如, 受体激活)这一过程可能通过不良结局通路分析与有害效应相关联7,8.
水质评估中生物筛查技术的发展相对迅速,已有数百种不同的 体外 已评估其效用的生物测定终点9,10目前,仅有少数生物测定方法被证明能够在实验室内部实现良好的测量精度,同时具备区分不同水质的能力。5,6对于经处理的废水中排放的雌激素和糖皮质激素类固醇,已成功通过以下方法对其存在情况进行评估: 体外 转录激活实验11,12然而,迄今为止大多数研究采用的生物测定所用细胞系均为专有品系(因此无法广泛获取),需要持续的培养与操作,或同时具备这两种特点。因此,标准化实验方案、开展实验室间校准以及最终将该筛查技术向水资源领域推广的能力仍然受到限制。
至少有一家供应商 体外 经美国ToxCast项目验证的生物测定方法已可商业化获取13 易于使用 "冻融" 分裂停滞的细胞 "试剂盒" 已证明在测量代表不同处理水平的水中提取的化学物质活性方面具有较高的稳健性14尽管已有供应商提供的检测单个化学物质或混合物生物活性的方案,但其中一些方案在应用于水样检测前需要进行修改。经处理的废水中排放的出水15,雨水径流16,受纳水体17,18 以及最近的再生水19,20 是水质研究领域关注的重要水体介质实例。
本研究提供了一种标准化的单一方案,利用市售的分裂停滞型 体外 转录激活生物测定。我们通过对两个特定终点——雌激素受体和糖皮质激素受体转录激活(ER 和 GR)——的背景值、剂量反应性和响应重复性进行全面评估,验证了该方案的稳健性。该方案已应用于筛查加利福尼亚州淡水系统中经处理的废水中和地表水样品。
访问受限。请登录或开始试用以查看此内容。
方案
1. 采集和处理水样(改编自 Escher 等9)
- 取一个洁净的1 L棕色玻璃瓶,其中含有1 g叠氮化钠和50 mg抗坏血酸,加入待测水样至满瓶。将样品在4 °C下保存,并在72小时内完成处理。
注意:叠氮化钠具有高毒性,必须小心操作。使用防护装备(眼部/面部、手套、防护服),并在通风良好的通风橱内称量。切勿使用金属药匙进行称量。 - 将样品以5–10 ml/min的流速依次通过1.6 µM玻璃纤维滤膜和预处理过的固相萃取(SPE)小柱。调节真空泵的压力以控制流速。
- 用真空干燥小柱15分钟。
- 先用10 ml甲醇洗脱小柱,再用10 mL丙酮:己烷(1:1, v/v)洗脱。
- 在高纯度氮气的温和气流下将洗脱液浓缩至约1 ml。加入500 µl二甲基亚砜(DMSO)进行溶剂交换,并将提取物再次蒸发浓缩至500 µl。
- 将提取物转移至棕色玻璃自动进样瓶中,在-20 °C下保存。
2. 准备检测特异性参考化学品和水提取物的稀释液
- 为标准曲线制备9个稀释度。
- 用100% DMSO配制检测特异性参考化学品的储备液。ER检测的最终浓度必须为2 µM 17β-雌二醇,GR检测为100 µM 地塞米松。将储备液储存于-20 °C。
- 在无菌离心管(管#1)中,加入15 µl相应的参考化学品储备液至285 µl检测培养基中。通过移液器反复吹打混匀样品。
- 在另外8个离心管(管#2-9)中,各加入200 µl含5% DMSO的检测培养基。
- 从管#1开始,将100 µl溶液转移至管#2,依此类推至管#9,进行3倍系列稀释。每次转移前,必须用移液器充分混匀每个稀释样品,再取等分试样加入下一管。
- 通过将10 µl DMSO与190 µl检测培养基混合,制备溶剂对照样品。
- 为每种水提取物制备4个稀释度。
- 在第一个离心管中,加入5 µL水提取物至95 µL检测培养基中,并充分混匀。在另外三个离心管中,各加入50 µl含5% DMSO的检测培养基。
- 通过将50 µl溶液从一个管转移至下一个管,进行2倍稀释。
3. 准备细胞悬液以进行FRET生物测定
- 根据制造商的说明配制特定检测培养基。检测培养基必须在 4 °C 下保存,并在使用前于水浴中升温至 37 °C。
- 从液氮罐中取出一瓶分裂阻滞的 ER 或 GR 细胞,将冻存管置于 37 °C 水浴中轻轻振荡 2 分钟,快速解冻。用 70% 乙醇对冻存管进行去污染处理,并将其放入 II 级生物安全柜中。
- 采用无菌操作技术打开冻存管,将细胞转移至 10 ml 检测培养基中。
- 以 200 × g 离心 5 分钟。
- 使用无菌玻璃移液管吸除上清液,并将细胞沉淀重悬于 6 ml 检测培养基中。
- 将 5 µl 细胞悬液与 5 µl 活性染料溶液混合,取一部分加入计数室。
- 使用光学显微镜或自动细胞计数仪计数活细胞数量,并估算细胞悬液中活细胞的密度。必要时进行稀释,使最终细胞密度达到每毫升检测培养基含 550,000 个活细胞。
4. 将细胞接种于96孔黑壁透明底板中,并加入稀释的水提取物
- 创建一个包含9点特异性检测校准曲线、QA/QC样本以及每种水提取物多个稀释度的板布局。96孔板布局示例如图1所示。
- 向重复的无细胞对照孔中加入90 µl的检测培养基。
- 将细胞悬液倒入无菌移液槽中,并使用多通道移液器向其他各孔加入90 µl细胞悬液。
- 向相应孔中加入在步骤2中制备的10 µl稀释样品。每孔中DMSO的终浓度不得超过0.5%。
- 用盖子盖好板,置于37 °C、5% CO2 培养箱中孵育16小时。
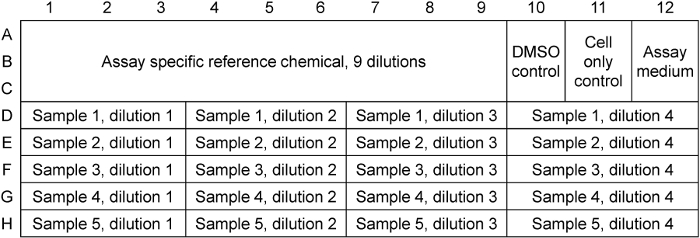
图1:96孔板布局示例。 多孔板设计包含检测特异性的校准曲线、3种质量保证/质量控制(QA/QC)对照(仅培养基、清洁培养基中的细胞、DMSO加标培养基中的细胞)以及每种水提取物的4个稀释度。每种对照和水提取物稀释度均设置三个复孔进行分析。请点击此处查看该图的放大版本。
5. 准备上样溶液并加入各孔中
- 孵育结束后,将培养板置于室温平衡。对于本FRET生物测定,步骤5.2至5.6应在无直射光条件下进行。
- 根据生产商说明书配制6x上样溶液。
- 向每孔中加入20 µl的6x上样溶液。
- 向每孔中加入10 µl细胞活力检测试剂,以评估稀释后水提取物的细胞毒性。
- 用铝箔封膜密封培养板。
- 将培养板在室温避光条件下孵育2小时。
6. 测定细胞毒性和内分泌活性反应
- 根据制造商的说明,设置具备底部读数功能的微孔板读数仪。
- 进行FRET转录激活生物测定实验时,在蓝色(409/460 nm,激发(Ex)/发射(Em)波长)和绿色(409 Ex/530 Em nm)通道中检测荧光信号。
- 进行细胞毒性测定实验时,在560 Ex/590 Em nm波长下检测荧光信号。
7. 评估质量保证/质量控制检查以确定数据质量
- 比较无细胞(仅培养基)和仅有细胞(细胞置于新鲜检测培养基中)对照组的平均原始荧光值。仅培养基的背景荧光应至少比仅有细胞对照组的信号低25%。
- 处理原始FRET数据。对于“蓝色”和“绿色”两组数据,均需从所有含细胞的孔中减去无细胞对照孔的平均荧光值。计算每个实验孔的蓝/绿荧光比值。
- 比较仅有细胞组与含DMSO对照组的蓝/绿比值。这些对照组的荧光值应在15%的相对标准偏差(RSD)范围内。
- 绘制检测特异性的校准曲线,以蓝/绿比值对以对数分子质量(log M)表示的样品浓度作图。计算斜率、R2 和 log EC50 (50%效应浓度)。校准参数应处于表1所列的预期范围内。
- 计算所有三复孔的RSD。重复样本之间的变异应小于20%。
- 对于细胞毒性数据(560 Ex/590 Em nm),从所有含细胞孔的荧光值中减去无细胞对照的平均值(即培养基背景)。
- 计算每个样品背景扣除后的平均荧光值。将所得荧光数据以DMSO对照的百分比形式绘图。样品稀释液相对于仅有细胞组和DMSO对照组的细胞死亡率不应超过20%。
8. 数据分析
- 将检测限(LOD)计算为最低校准响应值加上该响应值平均值的两个标准差。
- 对于显示剂量反应的样本,计算其EC50 利用参比化学品在10%至50%效应浓度范围内的校准曲线线性回归斜率,计算水提取物的毒性当量。
- 使用以下公式计算生物分析当量浓度(BEQ):BEQ = EC50 参考化学品/EC50 水样
访问受限。请登录或开始试用以查看此内容。
结果
本研究选取了4个24小时混合污水样品(经处理的城市污水出水)、6个来自南加州淡水系统的地表水瞬时样品,以及1个由超纯水组成的现场空白样,以说明本实验方案。4个出水样品中,有3个来自采用常规活性污泥法的污水处理厂(“二级出水”),另1个来自在生物处理后增设砂滤/碳滤的高级污水处理厂(“三级出水”)。地表水样品采集自代表不同土地利用类型的流域(开放区域、农业区和城市区)。
水提取物的不同稀释度均未表现出明显的细胞毒性,与DMSO对照组相比,细胞死亡率均低于20%。表1)。无细胞(仅培养基)背景信号较低,仅细胞组与细胞加DMSO组的响应比较表明,溶剂对荧光测量无显著影响。测定所用校准曲线的参数,包括斜率和log EC50,在可接受的历史数值范围内(表1)表明校准曲线在时间上的良好重现性。ER 检测中可接受的校准曲线示例如下所示: 图2选...
访问受限。请登录或开始试用以查看此内容。
讨论
环境雌激素(如17β-雌二醇(E2))的强效性已有充分记录,因此有必要在ng/L浓度水平对这类化学物质进行筛查23,24。本研究中,废水排放物的雌激素受体反应(BEQ范围:2.3至17 ng E2/L)略高于澳大利亚污水处理厂二级出水所报道的水平20,而地表水的BEQ值(<0.5至4 ng E2/L)则处于其他国家报道的地表水和雨水径流的范围之内(<1至11 ng E2/L)16。尽管地表水样品中测得的雌激素受体活性水平较低,该检测方法仍可作为水质评估的一个相关筛查终点。双酚A和烷基酚类表面活性剂等雌激素常在水生环境中被检出,但使用传统分析化学方法对其进行定量往往较为困难。ER细胞检测法还可用于当前及新注册农药的筛查,Kojima等人25的研究已证明了这一点。
在本研究分析的全部4个出水样品中,GR活性均比ER活性高出一个数量级(表 2)。这一趋势与既往关于废水排放的研究结果一致14,且本文报道的GR-BEQs范围略高,但与...
访问受限。请登录或开始试用以查看此内容。
披露
作者无任何利益冲突需要披露。
致谢
资金由州水资源控制委员会(协议编号:10-096-250 和 14-090-270)提供。感谢 S. Abbasi、M. Connor、S. Engelage、K. North、J. Armstrong、S. Asato、M. Dojiri、D. Schlenk、S. Snyder、S. Westerheide、B. Escher、F. Leusch、G. Pelanek、K. Bi 以及 J. Printen 的支持。作者声明不存在利益冲突,提及商品名称并不意味着认可。
访问受限。请登录或开始试用以查看此内容。
材料
| 姓名 | 公司 | 目录编号 | 评论 |
|---|---|---|---|
| GeneBLAzer ER alpha DA 检测试剂盒 | ThermoFisher | K1393 | 试剂盒包含 ER 分裂阻滞 (DA) 细胞和 LiveBLAzer FRET 加载试剂盒。 |
| GeneBLAzer GR DA 检测试剂盒 | ThermoFisher | K1391 | 试剂盒包含 GR 分裂阻滞 (DA) 细胞和 LiveBLAzer FRET 加载试剂盒。 |
| PrestoBlue 细胞活力检测试剂 | ThermoFisher | A-13261 | |
| 台盼蓝,PBS 中 0.4% | Sigma-Aldrich | T8154 | ThermoFisher 亦有供应 |
| Corning 96 孔黑色壁透明底板 | Corning | 3603 | 独立包装,无菌,带盖 |
| Whatman 玻璃纤维滤膜,GF/A,1.6 µM | Sigma-Aldrich | WHA1820025 | |
| 微孔板铝封膜 | E&K Scientific | T592100 | |
| Oasis HLB 6 cc 柱,200 mg 吸附剂 | Waters | WAT106202 | |
| 17β 雌二醇 | Sigma-Aldrich | E2758 | CAS #50-28-2 |
| 抗坏血酸 | Fisher Scientific | A61-100 | Sigma-Aldrich 亦有供应 |
| 地塞米松 | Sigma-Aldrich | D4902 | CAS #50-02-2 |
| 二甲基亚砜 (DMSO) | Sigma-Aldrich | D8418 | 分子生物学级 |
| 溶剂(丙酮、己烷、甲醇) | Fisher Scientific | 高效液相色谱级 | |
| 叠氮化钠 | Sigma-Aldrich | S2002 | 该化学品具有高毒性,必须谨慎操作。使用防护服,并在通风橱内称量。EMD Millipore 亦有供应。 |
| 自动细胞计数器或血细胞计数板 | 多种* | 供应商包括 Bio-Rad、Fisher Scientific、Sigma-Aldrich 和 ThermoFisher。 | |
| II 级生物安全柜 | 多种* | ||
| CO2 培养箱 | 多种* | ||
| 低温冷冻柜 | 多种* | 建议使用液氮储存杜瓦瓶。 | |
| 荧光酶标仪 | 多种* | 仪器必须具备底部读数功能。 | |
| * 无推荐来源,该设备的选择取决于预算、使用频率和实验室空间。 |
参考文献
- Dix, D. J., Houck, K. A., Martin, M. T., Richard, M. A., Setzer, R. W., Kavlock, R. J. The ToxCast program for prioritizing toxicity testing of environmental chemicals. Toxicol. Sci. 95 (1), 5-12 (2007).
- Reif, D. M., et al. Endocrine profiling and prioritization of environmental chemicals using ToxCast data. Environ. Health Perspect. 118 (12), 1714-1720 (2010).
- Maruya, K. A., et al. A tiered, integrated biological and chemical monitoring framework for contaminants of emerging concern (CECs) in aquatic ecosystems. Integr. Environ. Assess. Manag. , (2015).
- Van der Linden, S. C., et al. Detection of multiple hormonal activities in wastewater effluents, surface water, using a panel of steroid receptor CALUX bioassays. Environ. Sci. Technol. 42 (15), 5814-5820 (2008).
- Leusch, F. D. L., et al. Comparison of five in vitro bioassays to measure estrogenic activity in environmental waters. Environ. Sci. Technol. 44 (10), 3853-3860 (2010).
- Jarosova, B., et al. Europe-wide survey of estrogenicity in wastewater treatment plant effluents: the need for effect-based monitoring. Environ. Sci. Pollut. Res. 21 (18), 10970-10982 (2014).
- Sonneveld, E., et al. Comparison of in vitro and in vivo screening models for androgenic and estrogenic activities. Toxicol. Sci. 89 (1), 173-187 (2006).
- Piersma, A. H., et al. Evaluation of an alternative in vitro test battery for detecting reproductive toxicants. Reprod. Toxicol. 38, 53-64 (2013).
- Escher, B. I., et al. Benchmarking organic micropollutants in wastewater, recycled water and drinking water with in vitro bioassays. Environ. Sci. Technol. 48 (3), 1940-1956 (2014).
- U.S. Environmental Protection Agency (USEPA) Endocrine Disruptor Screening Program. Prioritization of the endocrine disruptor screening program universe of chemicals for an estrogen receptor adverse outcome pathway using computational toxicology tools. , OCSPP/OW/ORD/NCCT. (2012).
- Leusch, F. D. L., et al. Assessment of wastewater and recycled water quality: a comparison of lines of evidence from in vitro, in vivo and chemical analyses. Water Res. 50, 420-431 (2014).
- Jia, A., Wu, S., Daniels, K. D., Snyder, S. A. Balancing the budget: accounting for glucocorticoid bioactivity and fate during water treatment. Environ. Sci. Technol. 50 (6), 2870-2880 (2016).
- Huang, R., et al. Chemical genomics profiling of environmental chemical modulation of human nuclear receptors. Environ. Health Perspect. 119 (8), 1142-1148 (2011).
- Mehinto, A. C., et al. Interlaboratory comparison of in vitro bioassays for screening of endocrine active chemicals in recycled water. Water Res. 83, 303-309 (2015).
- Ternes, T. A., Joss, A., Siegrist, H. Scrutinizing pharmaceuticals and personal care products in wastewater treatment. Environ. Sci. Technol. 38 (20), 392A-399A (2004).
- Tang, J. Y. M., et al. Toxicity characterization of urban stormwater with bioanalytical tools. Water Res. 47, 5594-5606 (2013).
- Scott, P. D., et al. An assessment of endocrine activity in Australian rivers using chemical and in vitro analyses. Environ. Sci. Pollut. Res. 21 (22), 12951-12967 (2014).
- Vidal-Dorsch, D. E., Bay, S. M., Maruya, K., Snyder, S. A., Trenholm, R. A., Vanderford, B. J. Contaminants of emerging concern in municipal wastewater effluents and marine receiving water. Environ. Toxicol. Chem. 31 (12), 2674-2682 (2012).
- WateReuse Research Foundation (WRRF). Direct potable reuse: a path forward. , WRRF. Alexandria, VA. (2011).
- Leusch, F. D. L., et al. Assessment of the application of bioanalytical tools as surrogate measure of chemical contaminants in recycled water. Water Res. 49, 300-315 (2014).
- Schriks, M., et al. Occurrence of glucocorticoid activity in various surface waters in the Netherlands. Chemosphere. 93 (2), 450-454 (2013).
- Suzuki, G., Sato, K., Isobe, T., Takigami, H., Brouwer, A., Nakayama, K. Detection of glucocorticoid receptor agonist in effluents from sewage treatment plants in Japan. Sci. Tot. Environ. 527-528, 328-334 (2015).
- Purdom, C. E., Hardiman, P. A., Byea, V. V. J., Enoa, N. C., Tyler, C. R., Sumpter, J. P. Estrogenic effects of effluents from sewage treatment works. Chemistry and Ecology. 8 (4), 275-285 (1994).
- Kidd, K. A., et al. Collapse of a fish population after exposure to a synthetic estrogen. Proc. Natl. Acad. Sci. 104 (21), 8897-8901 (2007).
- Kojima, H., Katsura, E., Takeuchi, S., Niiyama, K., Kobayashi, K. Screening of estrogen and androgen receptor activities in 200 pesticides by in vitro reporter gene assays using Chinese hamster ovary cells. Environ. Health Perspect. 112 (5), 524-531 (2004).
- Kugathas, S., Sumpter, J. P. Synthetic glucocorticoids in the environment: First results on their potential impacts on fish. Environ. Sci. Technol. 45, 2377-2383 (2011).
- Van der Linden, S. C., et al. Development of a panel of high-throughput reporter-gene assays to detect genotoxicity and oxidative stress. Mutat. Res. Genet. Toxicol. Environ. Mutagen. 760, 23-32 (2014).
- Cwiertny, D. M., Snyder, S. A., Schlenk, D., Kolodziej, E. P. Environmental designer drugs: when transformation may not eliminate risk. Environ. Sci. Technol. 48, 11737-11745 (2014).
访问受限。请登录或开始试用以查看此内容。
重印与许可
