该方案描述了一种利用开源自动化技术对唾液样本进行RT-qPCR分子检测的SARS-CoV-2诊断方法。这种可扩展的方法既可用于临床公共卫生监测,也可用于提升规模较小的高校实验室的检测能力。
方法文章
利用开源移液机器人实现高效的SARS-CoV-2定量逆转录PCR唾液诊断策略
* These authors contributed equally
本文内容
摘要
摘要
近期SARS-CoV-2引发的全球公共卫生危机为流行病学研究和临床检测带来了关键挑战。COVID-19具有高传播率和低死亡率的特点,因此需要准确且高效的诊断检测,尤其是在住宅型大学等封闭人群中。由于供应链压力,核酸检测试剂(如鼻咽拭子)初期供应有限,检测结果报告也相应延迟。基于唾液的逆转录定量聚合酶链式反应(RT-qPCR)检测在敏感性和特异性方面已显示出与其他检测方法相当的性能,且唾液采集对受试者的身体侵入性更小。因此,我们为克莱姆森大学及其周边社区的人群监测开发了一种多重RT-qPCR诊断检测方法。该检测方法采用开源的液体处理机器人和热循环仪,而非复杂的临床自动化系统,以优化工作流程和系统灵活性。基于唾液的RT-qPCR自动化检测可快速、准确地检测出大范围和小范围检测需求下的多种病毒RNA浓度。自动化系统的平均周转时间对95%的样本少于<9小时,对99%的样本少于<24小时。当所有试剂均以批量采购时,单次检测成本为2.80美元。
引言
严重急性呼吸综合征相关冠状病毒-2(SARS-CoV-2)是一种新型冠状病毒,于2019年底出现,并迅速在全球人群中传播1。SARS-CoV-2感染可导致2019冠状病毒病(COVID-19),这是一种具有高度传染性的疾病,可能引发严重的呼吸系统和炎症症状。由于该病毒传播性强而病死率相对较低,表明其将在人群中迅速扩散,并需要加强诊断检测2,3。公共卫生建议提倡大规模人群筛查,以隔离病例并继而降低传播率4,5,6。此外,人群监测模型显示,提高检测频率和缩短报告时间在降低传播率方面比提高检测灵敏度更为有效7。这很可能是因为感染者能够更早被隔离,从而阻断传播链。
最初的核酸扩增检测(NAAT)标准是采用RT-qPCR处理的鼻咽(NP)拭子8。然而,在大规模人群中应用此类检测时会遇到诸多问题,例如相对成本增加以及供应链压力加剧9,10。此外,常见NAAT方法(包括鼻咽拭子、口咽拭子、中鼻甲拭子和鼻拭子)的样本采集与处理均依赖于专业设备、试剂和医务人员9,10。
唾液检测是鼻咽拭子RT-qPCR检测的一种充分替代方法,作为一种准确的SARS-CoV-2检测诊断工具,已被广泛认可11,12,13,14。直接对唾液样本进行RT-qPCR检测,其灵敏度和特异性与鼻咽拭子相当15。唾液检测相较于鼻咽拭子检测的一个主要优势在于允许受试者自行采集样本16。这减少了对医务人员的需求,同时因侵入性更小,使患者样本采集更为便捷。此外,由于唾液样本无需使用缓冲液从拭子上洗脱样本(而鼻咽样本则需要),基于唾液的检测可直接采用基于加热的核糖核酸(RNA)提取方法,从而省去了额外缓冲液、运输介质和/或RNA提取试剂的需求,降低了检测成本14,17。
克莱姆森大学疾病诊断与干预研究与教育(REDDI)实验室的建立旨在满足该校对新冠病毒检测与监测的需求。在包括大学在内的封闭人群中,流行病学模型显示,频繁的监测检测结合社交距离措施可取得最理想的疾病流行控制效果18。本研究整合了美国疾病控制与预防中心(CDC)的2019-nCoV RT-qPCR19 和SalivaDirect14检测方案,并在临床工作流程中引入自动化技术,以降低检测成本并缩短周转时间。此前已有研究团队在SARS-CoV-2 RNA提取步骤中使用开源液体处理机器人20,21,而本研究进一步最大化利用机器人完成检测板的制备和样本加载22。本文表明,经优化的检测流程结合开源液体处理系统(图1)可实现快速、准确的基于唾液的RT-qPCR检测,是开展大规模公共卫生监测的有效策略。
方案
所有研究均遵照克莱姆森大学和普里马健康机构审查委员会的规定进行(普里马健康机构审查委员会编号:Pro00099491,2020年7月1日)。
1. 开源液体处理机器人的设置
- 根据制造商说明,将高效微粒空气(HEPA)过滤器模块(参见材料表)安装至每台液体处理机器人顶部。
- 根据制造商说明,将一个8通道P20移液器安装至主混合液制备机器人左侧支架上。
- 根据制造商说明,将一个P20移液器安装至样本加载机器人右侧支架上。
- 在相应计算机上下载自定义Python脚本(补充文件1和补充文件2)。
- 在样本加载机器人计算机的桌面应用程序中打开TigerSaliva Full 384 Loading.py。点击校准,并根据软件指引完成移液器和程序的设置。
- 在主混合液制备机器人计算机的桌面应用程序中打开12 Full Plates.py。点击校准,并根据软件指引完成移液器和程序的设置。
- 使用计算机辅助设计(CAD)文件(https://www.myminifactory.com/object/3d-print-141363),通过熔融沉积成型三维(3D)打印机打印定制样本架。每台样本加载机器人打印16个样本架,共两组,每组八个。
2. 20倍多重N1+P1探针/引物混合液的制备
- 在无菌环境中,远离合成的 SARS-CoV-2 RNA 或患者样本处,用 50 mL 锥形管配制一批 20x 多重 N1+P1 探针/引物混合液(总体积 20 mL,表 1)。
- 使用移液管将 1.6 mL 该混合液分装至无菌的 2.0 mL 离心管中,并正确标记。
- 将分装好的混合液储存于 -20 °C 冰箱中,直至使用。
3. 阳性对照混合液的制备
注意:阳性对照混合液不应与探针/引物混合液或其他主混合液组分在同一无菌环境中配制。应使用单独的一瓶无核酸酶水。
- 将SARS-CoV-2合成RNA(N1)从1,000,000基因拷贝/µL(cpµ)稀释至10,000 cpµ,方法是将10 µL储存液加入990 µL无核酸酶水中。分装25 µL的10,000 cpµ溶液至无菌0.2 mL离心管中,并正确标记。未使用的分装样品储存于-80°C。
注意:合成RNA必须储存在-80°C以防止降解。 - 将Hs_RPP30合成DNA(P1)从200,000 cpµ稀释至10,000 cpµ,方法是将50 µL储存液加入950 µL无核酸酶水中。分装25 µL的10,000 cpµ溶液至无菌0.2 mL离心管中,并正确标记。未使用的分装样品储存于-80°C。
- 将SARS-CoV-2和Hs_RPP30的10,000 cpµ储存液各取20 µL加入960 µL无核酸酶水中,使每种组分最终浓度均为200 cpµ,总体积为1000 µL。将混合后的200 cpµ阳性对照品分装20 µL至0.2 mL离心管中,并正确标记。分装样品储存于-80°C,待使用时取出。
4. 主混合液制备板的准备
注意:应在远离合成的 SARS-CoV-2 RNA 或患者样本的无菌环境中配制主混合液。所有组分在加入混合液前必须完全解冻;若解冻不充分,可能导致浓度不准确。若试剂中存在冰晶或颜色不均,即表明解冻不充分。配制过程中应将试剂置于冷冻块上保存。
- 在50 mL锥形管中配制一批多重扩增主混合液(总体积48 mL,表2)。
- 通过将管子翻转3次使混合物均匀。切勿使用移液器反复吹打或涡旋混合,以免损伤酶活性。
- 将1.48 mL主混合液转移至无菌96孔深孔板的第1-4列各孔中。一个50 mL锥形管可填充四列,足够用于12块板。
- 用铝箔封膜覆盖深孔板,并将其放入专用的主混合液液体处理机器人中。将装有混合液的深孔板置于甲板10,将六个空的384孔板分别置于甲板1-6,P20吸头盒置于甲板11。打开深孔板和吸头盒的封膜,关闭机器人。
- 在机器人桌面应用程序中点击开始运行,启动自定义Python操作程序。
- 40分钟后,程序将暂停。在此期间,用铝箔封膜覆盖仍在机器人内的384孔板,并使用滚轮按压以确保密封。在每块板的边缘标记批次编号。
- 在甲板1-6上放置六个新的空384孔板,点击继续运行以恢复操作程序。运行完成后,用铝箔封膜密封最后一组384孔板。
- 取剩余主混合液各2 µL加入一个空的384孔板的第1-3列和第22-24列,用于批次质量控制。使用光学透明封膜密封后,在热循环仪上运行(第10.1-10.2节)。若有任何孔的N1扩增阈值循环(Ct)值呈阳性,或超过10个孔的P1 Ct值呈阳性,则表明该批次受到污染,不可使用。
- 将配制好的主混合液板储存于4 °C,须在配制后7天内使用完毕。
5. 样品采集、接收与热处理
- 指导参与者在采集唾液前30分钟内避免进食、饮水、吸烟或进行口腔卫生清洁。指导参与者收集至少1 mL自然积聚在口腔中的唾液,并将其注入无防腐剂的无菌50 mL锥形管中,然后盖紧管盖(补充文件3)。
- 使用70%乙醇或消毒湿巾对唾液采集管外部进行去污染处理,并将其转移至实验室进行检测。
- 通过将每个样本条形码扫描至每日接收样本电子表格中,记录样本到达信息(补充文件4)。
- 将已扫描的样本在95 °C烘箱中加热处理30分钟。操作时需佩戴耐热手套取出样本。
注意:未经处理的样本在室温(23 °C)下可稳定保存最多72小时。一旦完成加热处理,若不立即进行后续处理,则样本必须在4 °C条件下储存。
6. 样本分配
- 在样本分配工作站的计算机上打开每个样本加载机器人的每日样本加载电子表格(补充文件 5)。
- 将188个样本分配至每个384孔板,具体如下:样本1-48为第一象限,样本49-96为第二象限,样本97-144为第三象限,样本145-188为第四象限。每个样本需进行双复孔分析。
- 在托盘上标注板名称、日期和象限编号。按顺序将样本扫描录入样本加载电子表格中。
注意:根据 图3 的定义,前期板中的样本可能需要手动运行。有关手动样本分配和加载说明,请参见第8.1-8.3节。
7. 操作样品加载机器人
- 在样本加载工作站,排列两组完整的八个3D打印架,对应机器人甲板上的放置位置。
- 打开第一组样本管(quarter 1)的盖子,并将其放入3D打印架中,从1号架的A1位置开始。每个架按从左到右、从上到下的顺序依次放置。继续在2号架中按此模式加载,然后依次进行4号和5号架(参见图2C)。
注意:由于机器人程序参数设置,架的编号并非连续。 - 将装有第一组样本的样本架放置在1、2、4、5、7、8、10、11号甲板上。将P20吸头盒放置在3号和9号甲板上。为简化设置过程,请从后向前将物料装入机器人。
- 从4 °C冰箱中取出预先配制好的主混合液板,标记板名称,并使用锋利刀片在控制孔(N23/24、O23/24和P23/24)周围的铝箔上划出切口线。
- 将主混合液板放置在6号甲板上,撕去铝箔盖,仅保留覆盖控制孔的小矩形部分。打开吸头盒盖,关闭机器人舱门。
- 通过机器人桌面应用程序点击开始运行,启动自定义Python操作程序。每组样本加载至板上需24.5分钟;建议设置计时器以作提醒。
- 机器人运行期间,按照7.2节所述方法,打开第二组样本管(quarter 2)的盖子,并将其装入第二组3D打印架中。
- 当机器人暂停时,移除第一组样本架,并替换为第二组样本架。在桌面应用程序中点击继续运行。
- 重新盖上第一组样本管的盖子,并将其存放在4 °C冰箱中,等待结果。
对第三组和第四组样本重复上述加载过程。 - 将加载完成的板转移至生物安全柜中。为尽量减少污染,转移过程中应保持板盖处于封闭状态。
8. 手动加样
注意:如果机器人加样不充分,需对重复样本(N1 复测或复测,见图3)进行一次手动运行。
- 收集所有重复样本,并将其分配至第四象限的最后样本位置(参见第6.2节)。对样本进行编号,扫描条形码,并将原始样本位置及结果录入样本加载电子表格中。
- 将重复样本转移至生物安全柜中。请勿将重复样本管装入机器人加载架中。
- 根据板布局图(补充文件6),用移液器向指定孔中加入每份重复样本2 µL。使用专用移液器添加患者样本。在加样过程中,保持对照孔用铝箔覆盖,以尽量减少污染。
9. 向检测板中添加对照
- 使用镊子剥去覆盖在对照孔上的铝箔盖。
- 向 N23-N24 孔中加入 2 µL 无核酸酶水(无模板对照),向 O23-O24 孔中加入 2 µL 混合阳性对照(200 cpµ,参见第 3 节),并向 M23-M24 孔中加入 2 µL 经确认的阳性患者样本作为额外对照。P23-P24 孔保持空置,用于监测主混合液批次质量。
- 用光学透明封膜覆盖板孔,并使用压膜滚轮将封膜完全贴合至各孔。将板在 2500 rpm 条件下涡旋振荡 30 秒以充分混匀,随后在 500 x g 条件下离心 1 分钟。
10. 进行逆转录定量聚合酶链式反应(RT-qPCR)
- 根据所述条件在PCR仪软件中创建一个程序(表3)。保存该程序以供后续板使用。将密封好的板放入PCR仪中并运行程序。
- 将Ct值导出为.xslx文件,并将数值复制到样本加载电子表格中(补充文件5)。
注意:这些表格是为厂商软件生成的Ct输出文件专门设计的,可能需要修改才能兼容其他格式。
11. 确定板的有效性
- 验证阳性对照和/或已知阳性样本以及阴性对照,以判断该板的结果是否有效。根据以下标准评估对照孔:
- 对于阳性对照,检查至少一个阳性对照孔(O23/O24)在P1和N1探针上的Ct值是否介于22至28之间。或者,已知阳性样本孔(M23/M24)在P1和N1探针上的P1和N1 Ct值应<33。
- 对于阴性对照,检查两个阴性对照孔(N23/N24)中均无N1或P1的Ct值。在判定该板无效之前,需确认Ct值具有有效的扩增曲线。
12. 解读样本结果
- 根据示意图(图3)确定患者结果,并报告已解决的样本。
- 评估P1结果为有效(VALID)或无效(INVALID)。如果P1的结果为Ct <33,则视为该孔有效,并继续分析N1结果;如果P1的结果为Ct >=33或无Ct值,则视为该孔无效。
- 评估N1结果为“是”(YES)、“否”(NO)或“否*”(NO*)。如果N1的结果为Ct <33,则该孔为“是”;如果N1未产生Ct值,则该孔为“否”;如果N1产生Ct >=33,则该孔为“否*”。需确认所有N1的Ct值均对应真实的扩增曲线。若N1的Ct值无对应的扩增曲线,则该孔为“否”。
- 识别需重复检测的样本(N1重测或重测),用内部样本编号和样本类型进行标记,并将其返回至加样工作流程(第8.1–8.3节)。
- 评估P1结果为有效(VALID)或无效(INVALID)。如果P1的结果为Ct <33,则视为该孔有效,并继续分析N1结果;如果P1的结果为Ct >=33或无Ct值,则视为该孔无效。
13. 实验室清理
- 液体处理机器人
- 使用中效消毒剂清洁所有侧面。请勿使用乙醇,因为它会降解塑料。
- 用酒精(70% 乙醇或 100% 异丙醇)擦拭吸头末端和废液桶,同时擦拭键盘和鼠标。
- 生物安全柜
- 使用中效消毒剂清洁所有表面,并开启紫外灯照射 15 分钟。
结果
我们确定了针对SARS-CoV-2(N1)和Hs_RPP30(P1)的RT-qPCR探针和引物对合成核酸含量的检测范围。将已知浓度的合成SARS-CoV-2 RNA与合成Hs_RPP30 DNA混合后,用纯水进行10倍梯度稀释。采用以下公式将分子量转换为基因拷贝数
基因拷贝数 = (ng × 6.0221 × 10²³) / ((碱基对长度 × 660 g/mol) × 1 × 10⁹ ng/g)
并进行RT-qPCR。完成RT-qPCR后,获得N1检测的线性曲线(图 4A)和 P1 检测(图 4B) 在广泛的基因拷贝浓度范围内显示出良好的相关系数(R2= 0.9975 和 R2= 0.9884)。该结果表明,引物和探针组合无抑制作用,能够准确检测每拷贝基因的 SARS-CoV-2 RNAµL (Cq=33)。一个基因拷贝大致相当于一个病毒拷贝;然而,由于RT-qPCR具有半定量性质,我们未测定唾液中病毒的绝对拷贝数。我们尝试通过将已知浓度的合成SARS-CoV-2 RNA加入无病毒唾液(包括经加热处理和未经加热处理的唾液)来模拟阳性唾液样本,但在低浓度RNA条件下未能实现N1基因的扩增(数据未显示)。这可能归因于RNase降解或其他混杂因素。
还评估了自动化与手动加样方法之间的批间和批内变异性。为评估批间变异性,使用手动方法(见第8.1-8.3节)和自动化方法(见第7.1-7.11节)分别加载20个不同的阳性样本,并比较N1的Ct值,以确定液体处理机器人与手动加样是否产生等效结果(图5A)。手动与自动化方法之间的线性关系显示出较高的相关系数(R2 = 0.9088),表明两种方法在功能上等效。随着N1 Ct值的增加,Ct值的变异性也随之增大。这一趋势可能是由于病毒颗粒在唾液中的分布不均所致,当病毒颗粒数量较少时,这种不均一性更为显著。为评估批内变异性,对采用两种加样方法处理的独特唾液样本的重复孔中N1 Ct值进行了比较(图5B)。自动化加样重复孔之间的线性关系相关系数(R2 = 0.9622)略高于手动加样(R2 = 0.9589),表明两种加样方法在SARS-CoV-2检测中均具有良好的可重复性。
最后,对不同加热处理方法在降低唾液黏度方面的效果进行了评估(图6)。唾液样本来自单一供体,以消除样本间的变异性。同一加热处理方法中P1 Ct值的较大变异可能提示样本黏度较高,因为黏稠的唾液无法被精确地吸取和分配。与未处理对照组相比,30分钟和60分钟加热处理均显著降低了样本变异(p = 0.0006 和 p = 0.0429)。30分钟与60分钟处理之间无显著差异(p = 0.2245);因此,选择30分钟加热处理以缩短处理时间。

Figure 1基于唾液的 RT-qPCR 诊断系统实验室工作流程。 (A) 样本经采集后,在 95°C 下进行热处理 °在30°C下处理30分钟。处理后的样本通过内部电子表格系统进行分类,并与患者信息关联追踪。液体处理机器人将样本加载至预先制备的主混合液板的重复孔中。技术人员手动加载对照样本,密封反应板,并将其置于热循环仪中进行处理。结果通过自动化计算机系统进行分析,并由技术人员进行验证。B) 技术员在无菌生物安全柜中配制预混液试剂,并将其加入深孔储液槽。已加注的深孔储液槽被装载至专用液体处理机器人中。制备完成的微孔板用铝箔密封、标记,并储存于4℃环境中。 °C. 请点击此处查看此图的放大版本。
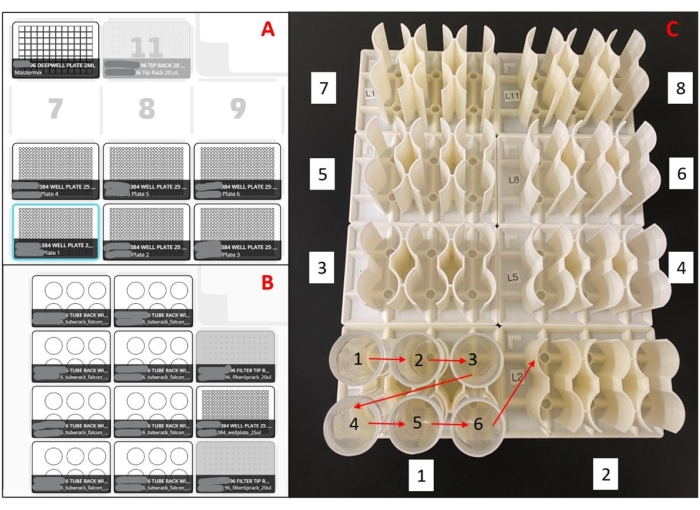
图2:液体处理机器人所使用的布局。(A)用于配制主混合液板的机器人台面布局。使用八通道移液器,机器人被编程为吸取移液枪头,从96孔深孔储液板中吸取主混合液,将其分装至空的384孔板中,然后将移液枪头弹入废液盒。每次运行重复此操作,共处理六块板。(B)用于样本加样机器人的台面设置。使用单通道移液器,机器人被编程为吸取一个移液枪头,吸取一份唾液样本,将该样本分装至384孔主混合液板中的两个重复孔中,然后将移液枪头弹入废液盒。每次运行重复此操作,共处理48份样本。(C)3D打印样本架的样本管加载顺序。红色箭头表示每个架内的加载顺序,白色框中的数字表示整套样本架的加载顺序。整个设置可将188份样本以双复孔形式加载至一块384孔板中。请点击此处查看该图的放大版本。
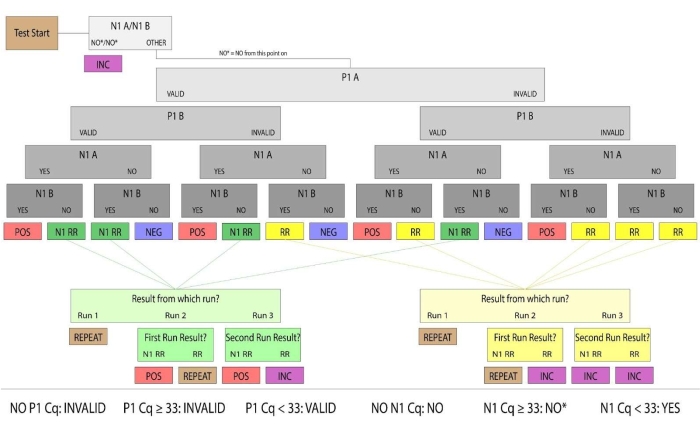
图3:样本检测结果流程图。 P1有效且N1阳性的样本被判定为人类唾液样本中SARS-CoV-2阳性。有效且结果为阳性或阴性的样本视为结论性结果。首次运行中未能获得结论性结果的样本被归类为“重检”(标记为RR)或“N1重检”(标记为N1 RR)。重检样本在P1扩增中无有效信号,而N1重检样本在单个重复中出现N1阳性扩增。若在后续人工检测中仍无法获得有效的P1扩增,或两个重复的N1扩增Ct值均高于阳性阈值(Ct >33),则该样本结果视为无结论性。在临床意义上,未送达实验室、唾液量不足以移液或样本已损坏的患者样本被视为无效样本。 请点击此处查看该图的放大版本。
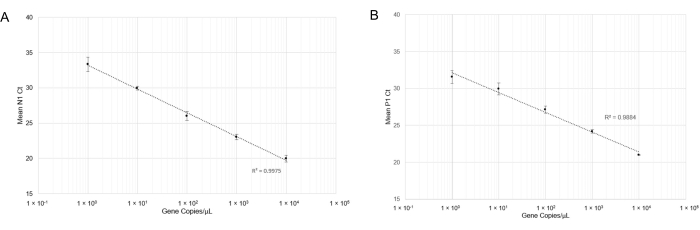
Figure 4: RT-qPCR detection of N1 (SARS-CoV-2) synthetic RNA and P1 (Hs_RPP30) synthetic DNA. 以标准偏差绘制标准曲线,以确定该探针/引物组合的准确检测范围。A) 将各稀释度下获得的平均 Ct 值(n = 4)与合成 RNA 的估计数量(1×100 至 1x10⁴ RNA copies in 10 µL of RT-qPCR reaction). (B) 将各稀释度下获得的平均 Ct 值(n = 3)与合成 DNA 的估计数量(1 × 100 至 1 x 10⁴ gene copies in 10 µL of RT-qPCR reaction). 请点击此处查看此图的放大版本。
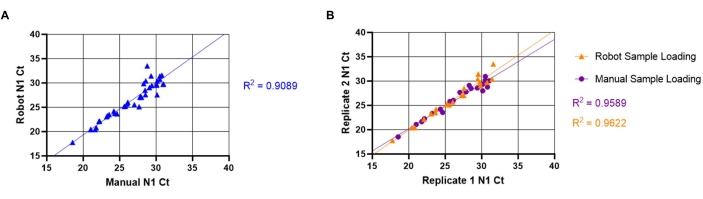
图5:手动与自动化唾液转移 SARS-CoV-2 (N1) Ct 值的比较。 已知 SARS-CoV-2 阳性的唾液样本(n = 20)由液体处理机器人以复孔形式加入 RT-qPCR 预混板中。这些样本的 N1 基因 Ct 值范围为 18–32。相同样本随后以手动方式加入另一块板的不同位置的复孔中。(A)通过转置机器人和手动加样所得的不同样本的 N1 Ct 值,评估手动加样与机器人加样之间的批间变异性。(B)通过转置机器人和手动加样所得 N1 Ct 值的复孔数据,评估批内变异性。请点击此处查看该图的放大版本。
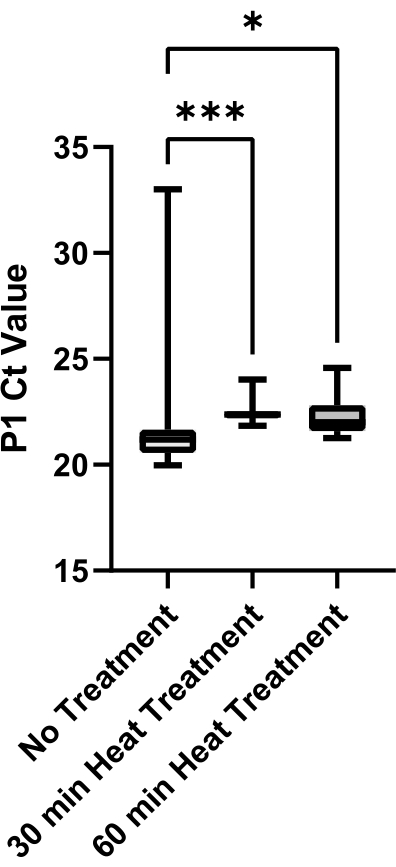
图6唾液黏度降低的热处理方法评估 SARS-CoV-2 阴性唾液来自单一来源,分装后分别在 0 分钟、30 分钟或 60 分钟内进行加热处理 95 °C. 对每种条件的技术重复样本(n=12)的P1 Ct值进行绘图,以确定不同处理方法之间的变异性。组间两两比较采用非配对t检验(***表示p<0.001)。 <0.001,* 表示 p <0.05). 请点击此处以查看该图的放大版本。
补充图1:低P1 Ct唾液样本中N1 Ct的比较。选取P1 Ct较低的阳性样本,并与N1 Ct进行比较(n=106)。N1 Ct值范围为14–33,表明该检测方法在唾液样本中的动态范围与标准曲线相当。请点击此处下载该文件。
| Component | Sequence (5’→3’) | Stock Concentration | Volume | ||
| 2019-nCoV-N1 Probe | /5FAM/ACCCCGCAT/ZEN/TACGTTTGGTGGACC/3IABkFQ | 50 µM | 500 µL | ||
| 2019-nCoV-N1-For | GACCCCAAAATCAGCGAAAT | 100 µM | 2000 µL | ||
| 2019-nCoV-N1-Rev | TCTGGTTACTGCCAGTTGAATCTG | 100 µM | 2000 µL | ||
| Hs RPP30 Cy5 Probe | /5Cy5/TTCTGACCT/ZEN/GAAGGCTCTGCGCG/3IABkFQ | 50 µM | 500 µL | ||
| Hs-RPP30-For | AGATTTGGACCTGCGAGCG | 100 µM | 2000 µL | ||
| Hs-RPP30-Rev | GAGCGGCTGTCTCCACAAGT | 100 µM | 2000 µL | ||
| Water | - | - | 11000 µL | ||
表1:N1+P1 探针/引物混合物的组分。
| Component | Stock Concentration | Volume per reaction | Final Concentration | Batch Volume | ||
| Luna WarmStart RT Enzyme Mix | 20X | 0.5 μL | 1X | 3 mL | ||
| Luna Buffer Reaction Mix | 2X | 5.0 μL | 1X | 30 mL | ||
| N1+P1 Primer/Probe Mix | nCoV N1 F: 10 μM | 0.5 μL | 500 nM | 3 mL | ||
| nCoV N1 R: 10 μM | 500 nM | |||||
| Probe nCoV N1: 2.5 μM | 125 nM | |||||
| RPP_30 P1 F: 10 μM | 500 nM | |||||
| RPP_30 P1 R: 10 μM | 500 nM | |||||
| Probe RPP_30 P1: 2.5 μM | 125 nM | |||||
| Nuclease Free Water | --- | 2 μL | --- | 12 mL | ||
| Subtotal | --- | 8 μL | --- | 48 mL | ||
| Template | 2 μL | |||||
表2:多重 SARS-CoV-2 预混液的组分。
| Stage | Temperature (°C) | Duration | Number of Cycles |
| Reverse Transcription | 55 | 10 min | 1 |
| Initial Denaturation | 95 | 1 min | 1 |
| Touchdown | 95 | 10 sec | 3 |
| 72 | 30 sec | ||
| 95 | 10 sec | 3 | |
| 69 | 30 sec | ||
| 95 | 10 sec | 3 | |
| 66 | 30 sec | ||
| Main Amplification | 95 | 10 sec | 40 |
| 65 | 30 sec |
表3:降落式RT-qPCR实验方案。一步法RT-qPCR检测SARS-CoV-2的热循环条件。
| 降落步骤 | 无降落步骤 | |||
| N1 平均 Ct 值 | P1 平均 Ct 值 | N1 平均 Ct 值 | P1 平均 Ct 值 | |
| 样本 1 | 19.65 | 22.7 | 27.8 | 28.3 |
| 样本 2 | 22.24 | 24.9 | 28.77 | 30.5 |
| 样本 3 | 18.85 | 19.2 | 24.65 | 25.9 |
| 样本 4 | 25.56 | 22.8 | 31.93 | 29.2 |
| 样本 5 | 22.34 | 24.8 | 38.48 | 40.0(检测失败) |
表4:五个阳性样本的降落式循环阈值与非降落式循环阈值的比较。
| 样本 | TigerSaliva | 市售唾液型 SARS-CoV-2 检测试剂盒 | ||
| N1 Ct | P1 Ct | 新冠病毒值 | 核糖核酸酶P值 | |
| D11 | 16.4 | 18.1 | 20.86 | 23.4 |
| E11 | 18.9 | 19.1 | 25.6 | 21.2 |
| F11 | 19.5 | 18.4 | 22.8 | 22.2 |
| G11 | 22.2 | 19.1 | 23.7 | 22.9 |
| H11 | 26.4 | 21.3 | 32.2 | 26.7 |
| A12 | 14.8 | 16.5 | 29.15 | 19 |
| B12 | 24 | 19.6 | 31.05 | 21.35 |
| C12 | 14.9 | 17.5 | 20.84 | 18.9 |
表5:TigerSaliva Ct结果与商用唾液样本SARS-CoV-2 检测结果的比较。 两种检测均在相同的唾液样本(n=8)上进行。
补充文件 1:用于机器人主混合板创建的自定义脚本。 请点击此处下载该文件。
补充文件 2:用于样本加载机器人上唾液处理的自定义脚本。 请点击此处下载该文件。
补充文件 3:参与者自行采集高质量唾液样本的操作说明。有关检测流程的更多详细信息,请参见位于 https://www.clemson.edu/centers-institutes/reddilab/index.html 的简短视频介绍。请点击此处下载该文件。
补充文件 4:样本接收电子表格。 请点击此处下载该文件。
补充文件 5:样本加样电子表格。 请点击此处下载该文件。
补充文件 6:样本 384孔板布局示意图。 请点击此处下载该文件。
讨论
本方案中所述检测方法已通过独立验证研究进行评估。结果表明,在与同时采集的配对鼻咽拭子(n=837;817例阴性,20例阳性)进行对比时,该检测方法的特异性为98.9%(1.1%假阳性),灵敏度为90.0%(10.0%假阴性)。重要的是,3名在使用TigerSaliva检测呈阳性而鼻咽拭子检测呈阴性的参与者,在48小时后再次使用拭子重新检测,结果转为阳性,表明TigerSaliva可能能够在疾病早期更早地检测出SARS-CoV-2感染。
我们通过将已知浓度的SARS-CoV-2合成RNA加入无病毒的唾液(包括经加热处理和未经加热处理的唾液)中,模拟阳性唾液样本,并进行 10倍系列稀释,以确定唾液中的Ct检测下限。在模拟阳性样本中,当基因拷贝数低于10,000拷贝(约Ct = 28)时,N1基因无法被检测到。我们推测这可能是由于RNase降解或其他干扰因素所致。然而,唾液中的RNase与裸露的合成RNA之间的相互作用,可能不同于其与病毒颗粒(即使已被加热变性)之间的相互作用。已有研究报道Ct值>30的阳性唾液样本,并且外部实验室已从这些样本中成功获得SARS-CoV-2的基因序列数据。我们推测,在患者唾液样本中,病毒蛋白可能对RNA降解起到了保护作用。
该方案中最关键的步骤是实现主混合液配制和唾液样本处理的自动化(分别对应第4和第7节)。这使得各项操作流程可以并行进行,从而显著缩短检测周转时间。另一个关键步骤是临床结果判读(第11和第12节)。设立中间结果类别(重检和N1重检)也最大限度地减少了不确定检测结果的出现。
我们证明了手动与自动唾液样本加样方法之间的差异可以忽略不计(图5A),且自动化可能提高SARS-CoV-2检测的可重复性(图5B)。在临床实验室的设计与扩建过程中,应优先采用自动化以促进检测工作的开展25。通过引入机器人自动化操作,可优化实验室工作流程26。液体处理机器人的开源功能支持自定义脚本编写,便于实验方案的设计。这使得液体处理机器人相较于传统的临床自动化方法,成为一种成本较低且高度可定制的系统。同时,它也是执行高度重复性实验操作的理想策略。该系统的高度可定制性意味着在耗材短缺时,可灵活更换实验器具(例如采集管、移液吸头或384孔板)。因此,使用液体处理机器人进行自动化操作,适用于大规模和小规模的监测及科研工作。
该检测策略的一个主要优势是相较于其他临床实验室具有显著缩短的周转时间。自动化液体处理机器人的使用在缩短周转时间方面起着关键作用,但机器人与热循环仪的同步使用对于最大化检测效率同样至关重要。一台机器人和一台热循环仪应配对操作,两台设备协同工作,实现不间断的样本加载和检测结果分析。一旦建立了稳定的指定样本流动流程,所有设备配对即可同时运行。机器人与热循环仪的持续同步使用可极大地提高检测通量和效率,这对于应对高检测量至关重要。
与其他已建立的 SARS-CoV-2 RT-qPCR 方案相比,我们在热循环程序中加入了降落(touchdown)步骤,以提高探针和引物组与靶基因的退火效率27,降低扩增失败的风险。结果表明,降落程序在不损害引物特异性结合的前提下,提高了阳性样本的检出率(表 4)。我们确定,该 RT-qPCR 检测方法可同时检测较宽范围的 SARS-CoV-2 RNA 拷贝数(图 4A)和 Hs_RPP30 DNA 拷贝数(图 4B)。
液体处理机器人的一项局限性是在唾液转移过程中可能因阳性样本造成交叉污染。唾液是一种黏弹性流体28 ,从移液枪头中分配后可能在相邻孔之间形成液丝。此外,唾液的异质性29 可能导致病毒颗粒在整个样本中分布不均。这会增加假阳性和假阴性的可能性,因此需要设定N1复检和复检样本。然而,在最初被定为N1复检的样本中,有14.1%最终确认为SARS-CoV-2阳性,其复检后呈阳性的可能性是普通复检样本的30倍以上。因此,区分复检与N1复检(图3)有助于更准确地分离潜在阳性样本,从而提高诊断检测的灵敏度和特异性。其他已报道的唾液诊断检测参数未作此区分12,14,24,30,31。
由于唾液样本具有异质性和高黏度,移液操作可能较为困难32。加热处理可充分变性唾液生物基质中的蛋白质,降低黏度,并避免使用RNA提取试剂9,而这些试剂在疫情初期供应紧缺10。延长加热处理时间还可灭活样本中可能存在的病毒33 ,从而允许在较低生物安全等级的实验室中进行样本处理。因此,本研究采用基于加热的RNA提取方法(见第5.4节),通过蛋白质变性来降低黏度(图6)。根据实验结果,我们推测加热处理除了变性蛋白质基质外,还可能有助于唾液样本的均质化。其他研究团队曾联合使用加热处理与蛋白酶K处理以提高样本均一性9,14,34。我们未采用该步骤,因其可能导致病毒颗粒蛋白过度变性,使病毒RNA暴露于高温降解环境中35。此外,加入蛋白酶K进行样本稀释可能掩盖病毒颗粒含量较少的阳性样本,从而降低检测灵敏度。同时,本研究还将检测结果与一种 commercially available 唾液SARS-CoV-2检测试剂盒(Logix Smart COVID-19)进行了比较,该试剂盒采用磁珠法RNA提取(表5)。结果表明,当前检测方法在检出弱阳性样本方面优于该商业化检测试剂盒。
仅使用RT-qPCR难以对唾液中的病毒拷贝数进行准确定量,因为qPCR属于半定量方法。Ct值之间存在由技术局限性引起的固有变异。基因拷贝数可由Ct值(图4)推算,且大致相当于病毒拷贝数。一种可能的解决方案是使用ddPCR来确定唾液样本中的病毒拷贝数,该方法可对反应中的基因拷贝数进行绝对定量。然而,我们认为向临床医生提供定性结果已足够,并且可通过本方法处理的样本之间进行相对病毒含量的比较。
尽管使用唾液存在一些局限性,但基于唾液的RT-qPCR检测SARS-CoV-2仍是一种在各种规模检测中快速、可靠地检测病毒RNA的有效方法。当结合使用开源液体处理系统时,该方法的优势尤为显著。该检测方法可经修改用于检测其他与诊断相关的核酸序列,例如传染病病原体、疾病标志物或其他病毒,因此适用于临床和科研诊断工作。
披露
作者无任何利益冲突需要披露。本方案中描述的检测方法属于耶鲁大学公共卫生学院提交的 SalivaDirect 紧急使用授权(EUA)范围。
致谢
作者感谢克莱姆森大学的管理人员、医务人员以及REDDI实验室临床实验室员工在实施和管理SARS-CoV-2检测过程中提供的帮助。感谢南卡罗来纳大学的Phillip Buckhaults博士和Carolyn Bannister博士在项目初期提供的咨询建议以及设备采购方面的产业联系支持。感谢众多学生、教授和工作人员在样本采集过程中提供的协助。感谢Creative Inquiry项目的学生收集标准曲线数据。本研究经费来自美国国立卫生研究院资助项目P20GM121342(授予DD和LGP)、克莱姆森大学体育部、克莱姆森大学研究副校长办公室以及南卡罗来纳州州长办公室。 & 联合认证评审委员会
材料
| 姓名 | 公司 | 目录编号 | 评论 |
|---|---|---|---|
| 100% 乙醇 | Fisher Scientific | 22-032-601 | |
| 20 µL 滤芯吸头 | Opentrons | 20µL tips | |
| 2 mL 微量离心管 | Fisher Scientific | 14-666-313 | 可使用替代产品 |
| Armadillo PCR 板,384 孔,透明,白色孔 | Thermo Scientific | AB3384 | 可使用替代产品 |
| Celltreat 2 mL 96 深孔板 | Fisher Scientific | 50-828-743 | 用于配制主混合液 |
| 透明 PCR 密封膜 | Thermo Scientific | AB0558 | 可使用替代产品 |
| DPEC 处理水 | Ambion (Thermo Scientific) | AM9916 | |
| 翻盖式 50 mL 锥形管 | VWR | 75845-210 | 用于样本收集 |
| 铝箔 PCR 密封膜 | Thermo Scientific | AB0626 | 用于主混合液板的储存,可使用替代产品 |
| HS_RPP30 合成 DNA | Integrated DNA Technologies | 299788131 | P1 阳性对照 |
| Luna 探针一步法反应缓冲液 | New England Biolabs | M3006B | |
| Luna WarmStart 反转录酶混合液 | New England Biolabs | M3002B | |
| nCOV_N1 正向引物,100 nmol | Integrated DNA Technologies | 10006830 | |
| nCOV_N1 探针分装,50 nmol | Integrated DNA Technologies | 10006832 | 探针可由其他供应商使用 SYBR 或 FAM 荧光基团合成 |
| nCOV_N1 反向引物,100 nmol | Integrated DNA Technologies | 10006831 | |
| Opentron HEPA 过滤模块 | Opentrons | N/A | 非必需,但有助于减少污染 |
| Opentron 多通道附件,P20 | Opentrons | 999-00005 | 用于配制主混合液 |
| Opentron OT-2 液体处理机器人 | Opentrons | OT-2 | |
| Opentron 移液器附件,P20 | Opentrons | 999-0000215 | 用于样本加样 |
| 烘箱 | Memmert | UF450 PLUS 208V-3PH | |
| PCR 管(RNase、DNase 无残留) | Fisher Scientific | 14-230-225 | 用于阳性与阴性对照的分装 |
| PolarSafe 铝制冷却块,15 孔(1.5/2.0 mL 管) | VWR | 10808-952 | |
| PolarSaf 铝制冷却块,24 孔(0.5 mL 管) | VWR | 10808-956 | |
| RNA酶P(ATTO 647)探针,50 nmol | Integrated DNA Technologies | 10007062 | 探针可由其他供应商使用 Cy5 荧光基团合成 |
| RNA酶P 正向引物,100 nmol | Integrated DNA Technologies | 10006836 | |
| RNA酶P 反向引物,100 nmol | Integrated DNA Technologies | 10006837 | |
| Sars-CoV-2 合成 RNA 对照品 2 | Twist Biosciences | 102024 / 103907 / 103909 | N1 阳性对照 |
| 扫描仪 | Code | CR1500 | 仅在扩大规模时需要 |
| 小型 HEPA 过滤罩 | Erlab | Captair Bio 321 | 用于配制主混合液 |
| CFX384 Touch 梯度PCR仪 | Bio-Rad | CFX384 Touch | 可使用其他型号,例如 CFX384 Opus |
| X-acto 刻刀套装 | Staples | N/A | 用于切割铝箔以覆盖对照孔 |
参考文献
- Zhu, N., et al. A novel coronavirus from patients with pneumonia in China, 2019. New England Journal Medicine. 382 (8), 727-733 (2020).
- Chen, J. Pathogenicity and transmissibility of 2019-nCoV-A quick overview and comparison with other emerging viruses. Microbes and Infection. 22 (2), 69-71 (2020).
- Petersen, E., et al. Comparing SARS-CoV-2 with SARS-CoV and influenza pandemics. The Lancet. Infectious Diseases. 20 (9), 238-244 (2020).
- Honein, M. A., et al. Summary of Guidance for Public Health Strategies to Address High Levels of Community Transmission of SARS-CoV-2 and Related Deaths, December 2020. MMWR. Morbidity and Mortality Weekly Report. 69 (49), 1860-1867 (2020).
- World Health Organization. Surveillance strategies for COVID-19 human infection: interim guidance. World Health Organization. , Available from: https://apps.who.int/iris/handle/10665/332051 (2020).
- Screening testing for early detection of SARS-CoV-2 infection. Division of viral diseases. Centers for Disease Control. , Available from: https://www.cdc.gov/coronavirus/2019-ncov/hcp/tsting-overview.html#PublicHealthSurveillance (2020).
- Larremore, D. B., et al. Test sensitivity is secondary to frequency and turnaround time for COVID-19 screening. Science Advances. 7 (1), 5393(2021).
- Sethuraman, N., Jeremiah, S. S., Ryo, A. Interpreting Diagnostic Tests for SARS-CoV-2. JAMA. 323 (22), 2249-2251 (2020).
- Chu, A. W., et al. Evaluation of simple nucleic acid extraction methods for the detection of SARS-CoV-2 in nasopharyngeal and saliva specimens during global shortage of extraction kits. Journal of clinical virology: the official publication of the Pan American Society for Clinical Virology. 129, 104519(2020).
- Guan, D., et al. Global supply-chain effects of COVID-19 control measures. Nature Human Behaviour. 4 (6), 577-587 (2020).
- Bastos, M. L., Perlman-Arrow, S., Menzies, D., Campbell, J. R. The Sensitivity and Costs of Testing for SARS-CoV-2 Infection With Saliva Versus Nasopharyngeal Swabs: A Systematic Review and Meta-analysis. Annals of Internal Medicine. 174 (4), 501-510 (2021).
- Pasomsub, E., et al. Saliva sample as a non-invasive specimen for the diagnosis of coronavirus disease 2019: a cross-sectional study. Clinical Microbiology and Infection: The Official Publication of The European Society of Clinical Microbiology and Infectious Diseases. 27 (2), (2021).
- To, K. K., et al. Consistent Detection of 2019 Novel Coronavirus in Saliva. Clinical Infectious Diseases: An Official Publication of The Infectious Diseases Society of America. 71 (15), 841-843 (2020).
- Vogels, C. B., et al. SalivaDirect: A simplified and flexible platform to enhance SARS-CoV-2 testing capacity. Med (New York, N.Y.). 2 (3), 263-280 (2021).
- Griesemer, S. B., et al. Evaluation of Specimen Types and Saliva Stabilization Solutions for SARS-CoV-2 Testing. Journal of Clinical Microbiology. 59 (5), 1418-1420 (2021).
- Wehrhahn, M. C., et al. Self-collection: An appropriate alternative during the SARS-CoV-2 pandemic. Journal of Clinical Virology: The Official Publication of The Pan American Society for Clinical Virology. 128, 104417(2020).
- Barza, R., Patel, P., Sabatini, L., Singh, K. Use of a simplified sample processing step without RNA extraction for direct SARS-CoV-2 RT-PCR detection. Journal of Clinical Virology: The Official Publication of the Pan American Society for Clinical Virology. 132, 104587(2020).
- Paltiel, A. D., Zheng, A., Walensky, R. P. Assessment of SARS-CoV-2 Screening Strategies to Permit the Safe Reopening of College Campuses in the United States. JAMA Network Open. 3 (7), 2016818(2020).
- Centers for Disease Control. 2019-Novel Coronavirus (2019-nCoV) Real-Time RT-PCR Primers and Probes. U.S. Department of Health and Human Services. , Available from: https://www.cdc.gov/coronavirus/2019-ncov/lab/rt-pcr-panel-primer-probes.html (2020).
- Cresswell, K., Ramalingam, S., Sheikh, A. Can Robots Improve Testing Capacity for SARS-CoV-2. Journal of Medical Internet Research. 22 (8), 20169(2020).
- Villanueva-Cañas, J. L., et al. Implementation of an open-source robotic platform for SARS-CoV-2 testing by real-time RT-PCR. PLoS One. 16 (7), 0252509(2021).
- Robot Boosts COVID-19 Testing Efficiency. University of South Carolina College of Pharmacy. , Available from: https://sc.edu/study/colleges_schools/pharmacy/about/news/2020/robot-boosts-testing-effort.php (2020).
- Matic, N., et al. Practical challenges to the clinical implementation of saliva for SARS-CoV-2 detection. European Journal of Clinical Microbiology & Infectious Diseases: Official Publication of The European Society of Clinical Microbiology. 40 (2), 447-450 (2021).
- Sahajpal, N. S., et al. SalivaSTAT: Direct-PCR and Pooling of Saliva Samples Collected in Healthcare and Community Setting for SARS-CoV-2 Mass Surveillance. Diagnostics. 11 (5), Basel, Switzerland. 904(2021).
- Genzen, J. R., et al. Challenges and Opportunities in Implementing Total Laboratory Automation. Clinical Chemistry. 64 (2), 259-264 (2018).
- Archetti, C., Montanelli, A., Finazzi, D., Caimi, L., Garrafa, E. Clinical Laboratory Automation: A Case Study. Journal of Public Health Research. 6 (1), 881(2017).
- Hecker, K. H., Roux, K. H. High and low annealing temperatures increase both specificity and yield in touchdown and stepdown PCR. BioTechniques. 20 (3), 478-485 (1996).
- Bhat, P. P., et al. Formation of beads-on-a-string structures during break-up of viscoelastic filaments. Nature Physics. 6, 625-631 (2010).
- Miller, C. S., et al. Current developments in salivary diagnostics. Biomarkers in Medicine. 4 (1), 171-189 (2010).
- Moreno-Contreras, J., et al. Saliva Sampling and Its Direct Lysis, an Excellent Option To Increase the Number of SARS-CoV-2 Diagnostic Tests in Settings with Supply Shortages. Journal of Clinical Microbiology. 58 (10), 01659(2020).
- Wang, W., et al. Detection of SARS-CoV-2 in Different Types of Clinical Specimens. JAMA. 323 (18), 1843-1844 (2020).
- Landry, M. L., Criscuolo, J., Peaper, D. R. Challenges in use of saliva for detection of SARS CoV-2 RNA in symptomatic outpatients. Journal of Clinical Virology: The Official Publication of The Pan American Society for Clinical Virology. 130, 104567(2020).
- Lista, M. J., et al. Resilient SARS-CoV-2 diagnostics workflows including viral heat inactivation. PLoS One. 16 (9), 0256813(2021).
- Brotons, P., et al. Validation and implementation of a direct RT-qPCR method for rapid screening of SARS-CoV-2 infection by using non-invasive saliva samples. International Journal of Infectious Diseases: IJID: Official Publication of The International Society for Infectious Diseases. 110, 363-370 (2021).
- Batéjat, C., Grassin, Q., Manuguerra, J. C., Leclercr, I. Heat inactivation of the severe acute respiratory syndrome coronavirus 2. Journal of Biosafety and Biosecurity. 3 (1), 1-3 (2021).
重印与许可
