本文介绍了一种系统性方法,用于描述淀粉样蛋白β 1-40(Aβ1-40)包被的20 nm金颗粒聚集体的准可逆自组装过程。肽段之间依赖纳米尺寸的准可逆网络化行为与Aβ1-40单体中的特定氨基酸或区域相关联。
本文内容
摘要
摘要
采用表面等离子体共振(SPR)光谱法和透射电子显微镜(TEM)对包被在纳米金胶体颗粒表面的Aβ1-40进行了表征。在TEM图像中观察到Aβ1-40包被的20 nm金颗粒的SPR吸收带随pH变化的位移,与聚集和解聚状态的交替现象相关。当pH约为4 时,Aβ1-40在金表面呈现展开构象;而当pH约为10 时,则呈现折叠构象。通过拉曼成像观察到,随着pH从4逐渐变化至10,该聚集过程具有可逆性。我们观察到Aβ1-40在金表面上的形貌随pH变化而改变,在pH为4时可清晰看到明显的聚集体。然而,在pH 4与pH 10条件下,表面增强拉曼光谱(SERS)谱图之间的差异非常细微,最显著的区别出现在250 cm-1至1750 cm-1区域的谱峰密度。具体而言,对可逆聚集过程的模式分析表明,聚集体是由Aβ1-40的展开构象形成的,涉及酪氨酸(Tyrosine)和苯丙氨酸(Phenylalanine)的苯环结构部分;相反,聚集体的解离则与Aβ1-40蛋白折叠过程中的构象变化相关,涉及组氨酸(Histidine)、谷氨酰胺(Glutamine)、甲硫氨酸(Methionine)和天冬氨酸(Aspartic acid)。
引言
淀粉样蛋白β 1-40(Aβ1-40)或1-42(Aβ1-42)肽的纤维形成过程已被广泛研究,因其是阿尔茨海默病致病因素之一——淀粉样斑块形成的关键环节1,2,3,4,5,6,7,8,9,10,11。纤维形成的关键机制是Aβ1-40或Aβ1-42肽发生寡聚化,形成具有神经毒性的蛋白质聚集体;目前已有大量研究致力于阐明单体如何形成寡聚体的机制12,13,14。我们采用了一种研究方法,即观察淀粉样蛋白原性肽在纳米金表面形成聚集体的过程,并鉴定出介导远离金表面肽段之间网络连接的关键因素15,16,17,18,19,20,21,22。
Aβ1-40 在酸性条件(pH ~4)下呈现伸展构象(A),在碱性条件(pH ~10)下呈现折叠构象(B)。我们观察到分散的 Aβ1-40在 pH 约为 10 的条件下,包被的金胶体颗粒与大量 Aβ1-40在 pH~4 条件下涂覆的金胶体聚集体图1)23,24Aβ的非折叠构象1-40在酸性条件下,有利于Aβ之间的肽链网络形成1-40 金纳米颗粒表面的单体,导致形成金胶体聚集体(见A) 图1)。当 Aβ1-40 单体在碱性或中性pH条件下保持折叠构象,Aβ1-40,单体不会交联形成聚集体,而包被的金纳米颗粒则保持为单独分散的颗粒(见图B) 图1因此,我们可以探究Aβ的形成过程1-40 通过测量在不同pH条件下SPR谱带位移,检测肽段发生构象变化并形成网络结构和聚集体的过程25,26,27,28,29,30,31.
我们测试了多种不同尺寸的金纳米颗粒,发现20 nm的金溶胶在外界pH值变化时,对Aβ1-40单体表现出最显著的可逆自组装过程(图2)。这明确表明肽构象发生了可逆变化:酸性条件(A)诱导肽链呈去折叠构象,增强其网络化作用,导致金溶胶聚集;而碱性条件(B)则诱导单体形成折叠构象26,27,28,29,30,31。
方案
1. 准备 Aβ1-40 包被的金纳米颗粒
- 使用注射器针头将1 mL去离子蒸馏水加入1 mg冻干的Aβ1-40(分子量:4.2 kDa,HPLC纯度98%)中。在室温(RT;~20 °C)下用涡旋混合器混合溶液约30秒,确保溶液中无可见固体颗粒。
- 所有储备液均应使用去离子蒸馏水(~18 MΩ·cm)配制。
- 通过275 nm处酪氨酸的吸收光谱测定浓度32,其摩尔消光系数ε275为1390 cm-1·M-1。
- Aβ1-40储备液应储存于-80 °C。(有关Aβ1-40商品化产品的信息,请参见材料表。)
- 在数据采集前约5分钟将肽储备液解冻。取8 μL肽溶液与800 μL胶体金颗粒加入15 mL离心管中。再加入4.2 mL去离子蒸馏水,随后涡旋混合10秒30,31,33,34。
- 固定Aβ1-40肽的浓度为1.8 nmol,并调节Aβ1-40肽的比例。胶体金颗粒的数量比例范围为~500:1至~2000:125。
2. 迭代改变pH值并监测相应的表面等离子体共振(SPR)带偏移
- 将溶液温度设定为确定值(例如, 25 °C使用紫外-可见-近红外(UV-Vis-NIR)分光光度计的温度控制单元。
- 使用pH计监测样品溶液的初始pH值,并将其调节至略低于pH 7。采集400 nm至1000 nm范围内的吸收光谱。
- 将样品的 pH 值调节至约 pH 4(即 pH 4.0 ± 0.3),通过添加 10 μL 0.1 M HCl 的体积,并收集 400 nm 至 1000 nm 之间的吸收光谱。
- 将样品的 pH 值调节至约 pH 10(即 pH 10 ± 0.3),通过添加 10 μL 0.1 M NaOH 的体积,并收集 400 nm 至 1000 nm 之间的吸收光谱。
- 用 HCl 和 NaOH 将 pH 在 pH 4 至 pH 10 范围内反复调节 10 次,并在 25 ± 条件下连续采集吸收光谱 0.2 °C29,30.
注意:所有样品溶液中,表面等离子体共振(SPR)吸收峰的光密度均维持在约0.2。由于溶液中残留的缓冲液可能产生缓冲效应,因此在确认体系达到平衡后测定最终pH值。使用精度为±0.005 pH的微电极pH电极,在样品比色皿中直接测量pH值。 - 获取吸收度随波长变化的美国信息交换标准代码(ASCII)数据集。使用以下方法提取谱带峰的平均位置: 峰拟合 程序
- 将数据集绘制成图,以显示光密度随波长(nm)的变化关系 绘图 功能
- 标记初始峰波长 λ1,λ2,和 λ3 通过在绘制的数据中选择其大致位置,并使用以下方法对数据进行拟合 RUN 功能
- 获取包含每个(λ)中心峰的图谱i),XCi,每个条带的面积(Ai).
- 将提取的峰位置和峰面积导出至电子表格程序,并计算在特定pH值下的平均峰位置。
- 确定权重因子 ai 各峰中心 λi 通过比较条带的面积(Ai)与整条条带总区域面积的比值如下:
 .
. - 提取平均峰值位置,
 (pH) 使用公式 (1) 计算。
 (1)
(1)
- 确定权重因子 ai 各峰中心 λi 通过比较条带的面积(Ai)与整条条带总区域面积的比值如下:
- 使用以下步骤生成可逆性曲线:
- 记录平均峰位, ,作为每次“操作”次数 n 的函数 与n相对。将加酸前pH约为7的样品的操作编号n设为1。每次操作后,使用HCl将pH调节至约pH 4,或使用NaOH将pH调节至约pH 10,并将操作编号依次增加1。在酸性条件(即约pH 4)下,使n为偶数;在碱性条件(即约pH 10)下,使n为奇数。
- 分析每个 n 处的峰位 (n) = λ(n),使用公式30
 (2)
(2)
注意:用 A 表示 n = 1 时的初始平均峰值位置。将参数 B 和 C 表示为随 n 变化的峰值位置偏移量。将参数 D 设为重复阻尼因子 E 的振幅。使用 正弦 用于展示峰位随 n 变化的波动情况。 - 将(x,y)数据集传输至 Origin 软件并绘图。
- 形成 定制化 公式(2)中给出的函数 非线性曲线拟合分析函数输入初始的 A、B、C、D 和 E 值,然后单击 RUN 以完成拟合。
- 记录平均峰位,
- 透射电子显微镜成像
- 制备 Aβ 的透射电子显微镜样品1-40使用Formvar包被的铜网吸附20 nm金胶体。在80 kV电压下用透射电子显微镜观察样品。
- 在型号为 XR-40 的 400 万像素 CCD 数字相机(AMT)上以 28,000 倍或 71,000 倍的标称放大倍数采集图像。采集 Aβ 的透射电子显微镜(TEM)图像1-40每次操作分别在 pH 7(n = 1)、pH 4(n = 2、4、6、8 和 10)以及 pH 10(n = 3、5、7 和 9)条件下使用包被的 20 nm 金颗粒。
3. 拉曼成像及可逆聚集行为的研究
- 在操作编号为 n 的每个样品中,取 100 μL 溶液置于云母片(直径 1 cm)上。测量前将样品干燥过夜。
- 在每个操作编号 n 下采集白光图像。在云母片上制备独立样品,使 pH 在每个操作编号 n 下持续改变,范围约为 pH 4 至 pH 10(图3)。
- 在每个操作编号 n 下采集拉曼图像,使用波长为 λ = 633 nm 的激光,功率为 0.5 ± 0.05 mW,空间分辨率为约 0.43 μm,成像区域网格为 100 × 100 像素,积分时间为 500 ms/光谱,光谱范围为约 200 cm-1 至约 2,800 cm-1(图4)。
- 绘制每个 n 的代表性光谱,并将其按 n 的函数对齐,构建 Aβ1-40 包被的 20 nm 金颗粒的三维表面增强拉曼光谱(SERS)随 n 变化的图像(图5A)。利用该三维 SERS 光谱的俯视图作为等高线图(图5B),以提取与特定 pH 条件(即约 pH 4 和约 pH 10)相关的特征峰。提取仅在 neven 或仅在 nodd 增强的任何光谱特征。
结果
当Aβ1-40结合到金纳米胶体颗粒表面时,在溶液酸性增强(pH 4)的条件下,原本位于约530 nm吸收峰处的表面等离子体共振(SPR)带显著红移至约650 nm的峰位35。结合透射电子显微镜(TEM)图像,我们确定在pH 4条件下观察到的光谱特征对应于金胶体聚集体的形成,这些聚集体可能呈现去折叠构象,并与吸附在金表面周围的去折叠Aβ1-40单体相互交联成网络结构30。我们观察到,在碱性条件(pH 10)下,Aβ1-40单体会逆转回折叠构象,从而以准可逆的方式导致聚集体解聚。这种准可逆过程体现在平均吸收峰波长((n))在较短与较长波长之间的交替变化,以及在碱性(pH = 10)与酸性(pH = 4)条件下TEM图像中分散态与聚集体形态的交替出现。先前已有研究观察到,即使溶液恢复至碱性条件,仍有部分Aβ1-40单体保持去折叠状态36。视频 1展示了Aβ1-40与20 nm裸金胶体溶液随pH变化的颜色改变。
作为对比,对20 nm的裸金胶体进行了pH跃迁实验(图5C 和 D)。随着pH变化操作的进行,金胶体在表面等离子体共振(SPR)吸收带偏移、透射电子显微镜(TEM)图像以及白光图像中均表现出聚集程度的增加。有趣的是,拉曼增强光谱(SERS)中出现了若干依赖于nodd和neven的谱线。例如,在neven(pH ~4)条件下,275 cm-1处的谱线显著增强,该谱线被指认为与Aun(n = 5, 6, 12, 16, 20, 58)37相关的振动模式,或Au-Cl-配体的振动模式38。另一方面,在neven条件下,1008 cm-1处观察到C-N伸缩振动39,而1291 cm-1处则广泛观察到CH2摇摆振动39和CH2变形振动40。
与白光成像观察到的明显pH依赖性且可逆的聚集形态相比,nodd与neven在SERS光谱中的谱图特征差异相对较小。作为初步近似,nodd在250 cm-1至1750 cm-1范围内的谱线密度高于neven。在指纹区1250 cm-1至1750 cm-1范围内(酰胺I、II和III谱带),nodd的谱线显示出分辨度较低的光谱特征,表明可能存在谱带展宽或谱密度增加。在图6中,基于图5B(图6B)提供的等高线图,以761 cm-1(红色)和1395 cm-1(蓝色)处的SERS信号分别代表nodd和neven的特征进行组织(图6C)。作为nodd和neven的代表性SERS光谱,n = 7(红色)和n = 4(蓝色)的SERS光谱显示在顶部(图6A)。为展示其与Aβ1-40包被的20 nm金颗粒的SPR谱带位移的对应关系,将图3中的谱带位移图显示在侧边(图6D)。
尽管我们已获得观测到的SERS谱图完整归属的初步数据,但此处需指出几个显著的拉曼位移特征。在nodd条件下增强的谱线及其(可能的归属)主要出现在1000 cm-1以下的区域:394 cm-1(Trp)41,42,43、761 cm-1(His, Ala)39,44,45,46,47、875 cm-1(吲哚NH位移,Met的C-C伸缩振动)39、974 cm-1(Glu,Asp的C-COO-伸缩振动,与柠檬酸相关的振动模式)39,48,49。在neven条件下增强的拉曼位移在指纹区(酰胺I、II和III)表现出显著的光谱特征:1166 cm-1(Tyr的N-H+变形振动)39,41、1227 cm-1(Ala-Pro-Gly,酰胺III)39,50,51、1395 cm-1(Glu的COO-对称伸缩振动或CH2-CH3-剪式振动)39,48、1585 cm-1(Phe的苯环CC伸缩振动,羧酸根不对称伸缩振动-Au,柠檬酸的COO-伸缩振动,苯环变形振动)39,41,45,46,47,49,52、1592 cm-1(Phe, Tyr,Tyr的C=C伸缩振动,Phe中环的CC伸缩振动,Phe和Tyr中苯环伸缩及COO-伸缩振动,以及OH的不对称伸缩振动)39,41,48,50,51,以及1628 cm-1(对应于分子间β-折叠结构的酰胺I子峰53,来源于平行β-折叠结构的蛋白质主链C=O以及耦合的CN/NH振动模式,聚集态Aβ的积累54,无规卷曲,β-转角,β-发夹结构48。nodd或neven对应的序列如图7所示。总体而言,在对应Aβ1-40可逆聚集或去折叠构象的neven条件下,含有苯环的Phe/Tyr、COO-的对称伸缩振动、Glu的CH2-CH3-剪式振动模式以及Tyr的-NH+变形振动在肽链构象变化中起重要作用。而在肽链折叠构象(对应nodd显著模式)下的聚集体解组装过程中,Glu、Asp、Met、His和Ala似乎参与其中。
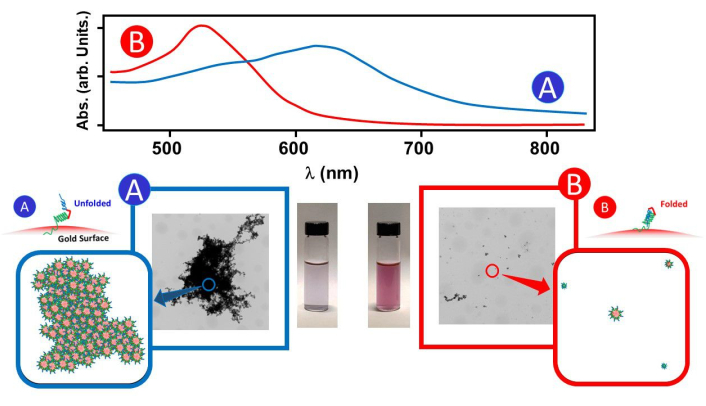
图1:pH依赖性的吸光度与形态学特征。 显示了Aβ1-40包被的金纳米颗粒(20 nm)在pH 4(A)和pH 10(B)条件下的吸收光谱,以及相应的透射电子显微镜(TEM)图像、聚集体/分散颗粒的示意图和样品瓶中溶液的照片。A代表在酸性条件下Aβ1-40单体的去折叠构象,B代表在碱性条件下的折叠构象。每种构象下Aβ1-40单体的示意图及聚集/分散形态均显示在TEM图像旁。请点击此处查看该图的放大版本。
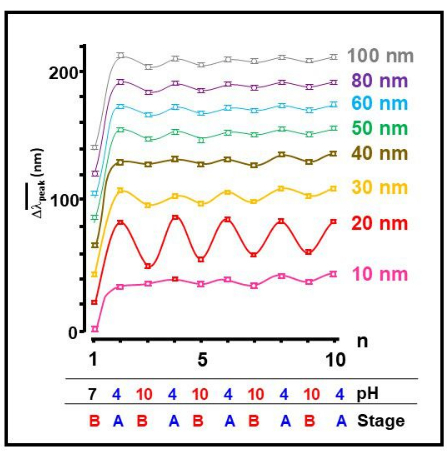
图2:纳米尺寸依赖的自组装可逆性。所有测试尺寸的金胶体颗粒在不同操作次数 n 下,表面等离子体共振(SPR)带的平均峰位移变化 。图中同时标出了对应聚集体在 图1 中所示阶段的大致pH值。请点击此处查看该图的放大版本。
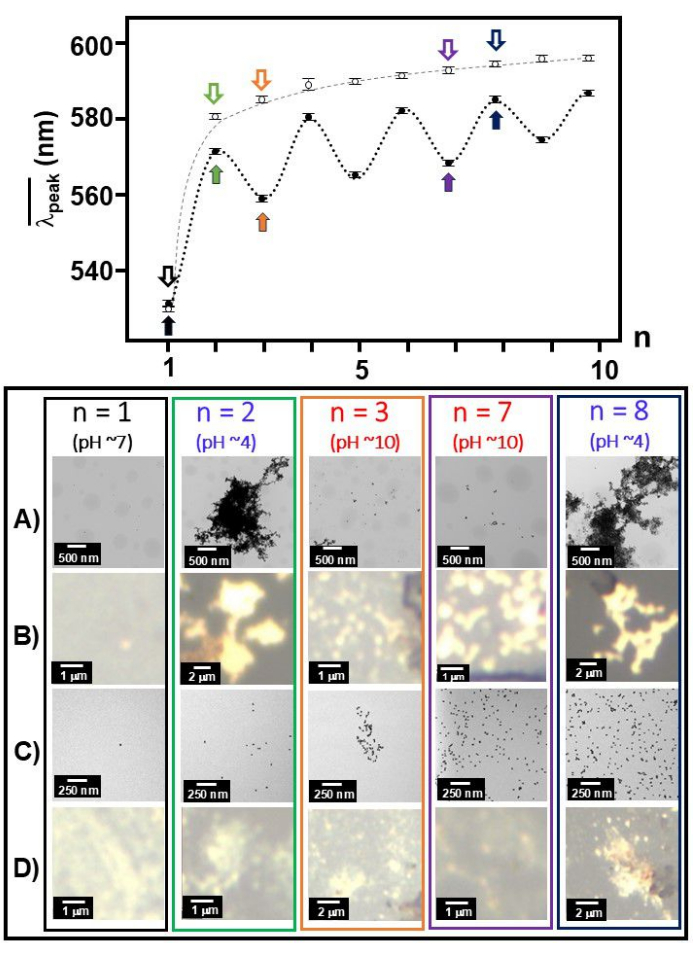
图3: 以及每次操作时的透射电子显微镜(TEM)/白光图像。 Aβ1-40包被的20 nm金颗粒(实心圆)和未包被的20 nm金胶体(空心圆)的随操作次数n的变化关系被绘制在同一图中,并附有在选定操作次数(n = 1、2、3、7和8,由解码箭头标出)下的代表性TEM图像(A 和 C)及白光图像(B 和 D),分别对应Aβ1-40包被的20 nm金颗粒(A 和 B)和未包被的20 nm金胶体(C 和 D)。黑色字体表示pH 7,蓝色字体表示pH 4,红色字体表示pH 10。请点击此处查看该图的放大版本。
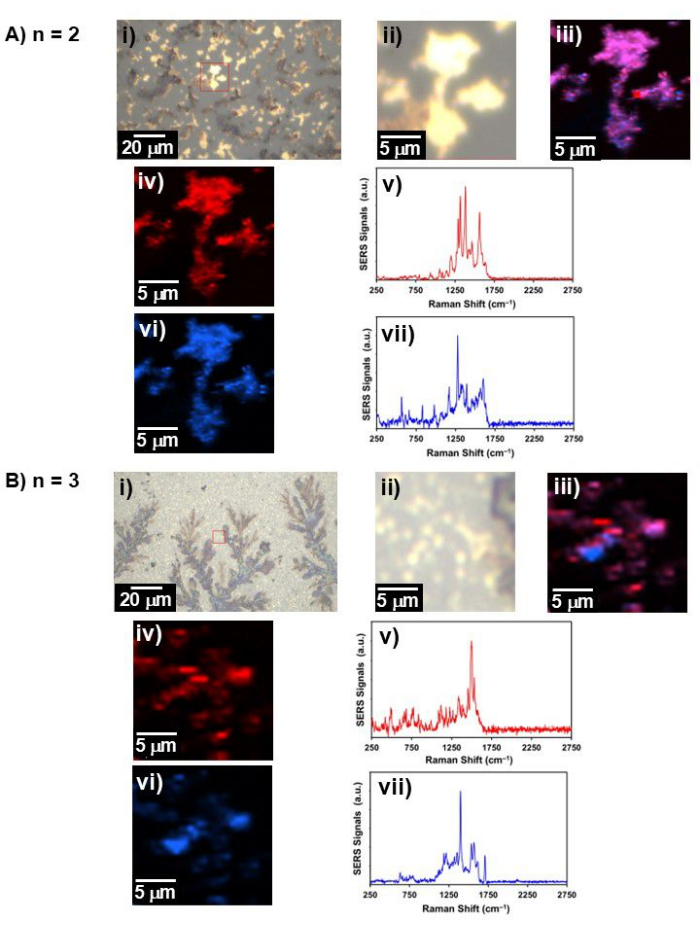
图 4:典型的白光与拉曼图像。 白光图像、拉曼图像以及表面增强拉曼光谱(SERS)结果分别对应于(A)n = 2 和(B)n = 3;i)宽视野下的白光图像,ii)采集拉曼图像区域的白光图像(在 i 中以红色方框标示),iii)两个组分合并后的拉曼图像,iv)组分 1 的拉曼图像及其 v)iv 的 SERS 光谱,vi)组分 2 的拉曼图像,以及 vii)vi 的 SERS 光谱。请点击此处查看该图的放大版本。
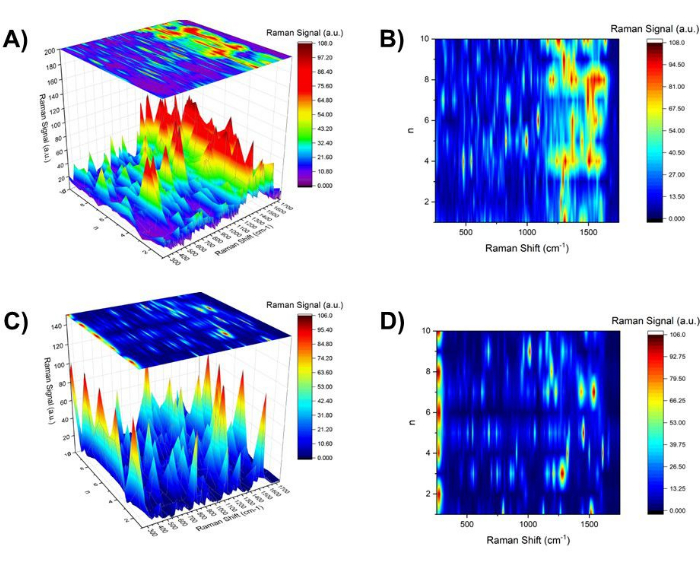
图5SERS光谱的n轮廓图奇数,n即使,以及 n全部. (A) 250 cm⁻¹ 谱区的表面增强拉曼光谱三维图谱-1 和 1750 cm-1 作为 Aβ 的 n 的函数1-40 涂覆的20 nm金颗粒,其轮廓图如(B)位于上方。C) 250 cm⁻¹ 区域内 SERS 谱图的三维图谱-1 和 1750 cm-1 作为金颗粒尺寸为20 nm时n的函数,其等高线图如(D)位于上方。 请点击此处以查看此图的放大版本。
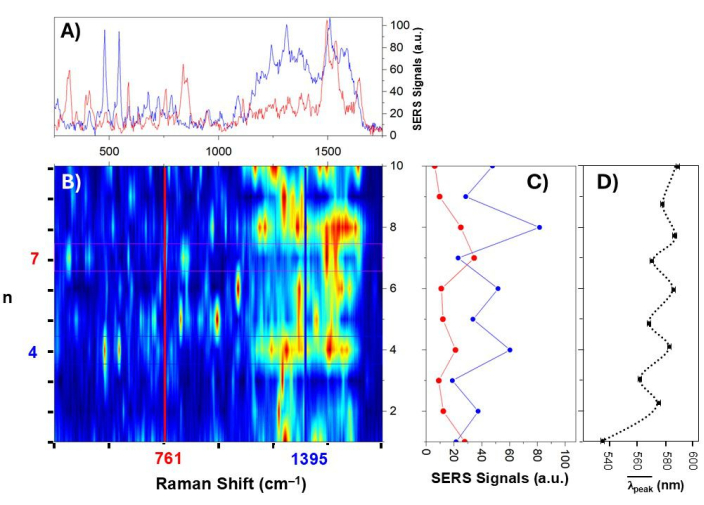
图6:表面增强拉曼散射(SERS)光谱的等高线图。 表面增强拉曼散射(SERS)光谱随 n(1–10)变化的等高线图。(A)1395 cm-1(蓝色)和 761 cm-1(红色)处的吸收强度。(B–D)下方面板显示表面增强拉曼散射(SERS)光谱,右侧面板显示在每个 n 值处表面增强拉曼散射(SERS)信号强度变化的幅度。请点击此处查看该图的放大版本。
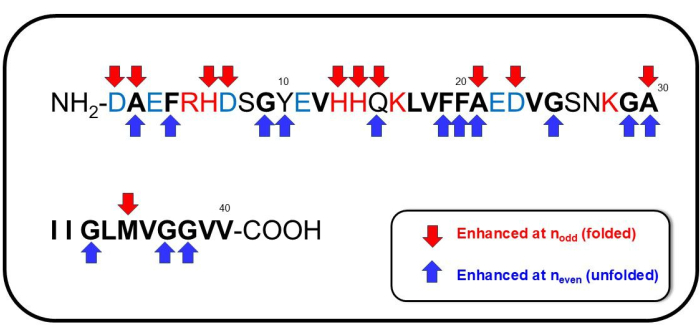
图7:Aβ1-40 的显著序列特征。 被指定在 nodd 时具有显著作用(对应于折叠构象的形成)的序列以向下的红色箭头表示,而在 neven 时具有显著作用(对应于非折叠构象的形成)的序列以蓝色箭头表示。请点击此处查看该图的放大版本。
视频 1:Aβ1-40 与 20 nm 裸金胶体的 pH 依赖性颜色变化。 请点击此处下载该视频。
讨论
在肽构象研究中,一个关键的考虑因素是样品的保存,因为如果储存不当,样品会降解。肽样品以冻干形式收到,一旦用去离子蒸馏水复溶后即开始发生变性,即使储存在 -80 °C 条件下也是如此。金胶体的纯度已通过质量控制分析验证。为保持胶体的稳定性,将其储存在 4 °C 环境中,避免冷冻。每次实验均需新鲜配制金胶体溶液,因为盐缓冲液会导致金胶体失稳。盐酸(HCl)和氢氧化钠(NaOH)溶液也需每次实验前新鲜配制。
在 pH 4 至 10 之间调节溶液 pH 值的同时,使用精密仪器手动读取并记录 pH 值,这一过程存在技术上的挑战,限制了我们报告结果的精确性。因此,我们未观察到表面增强拉曼散射(SERS)信号强度的一致性结果。这可能对用于绘制等高线图的信号幅度引入了误差。未来的研究若要验证与 neven 或 nodd 相关的振动模式,可引入突变,替换我们所报告的参与 Aβ1-40 蛋白构象变化的氨基酸残基,例如单个酪氨酸(Tyrosine)或天冬酰胺(Asparagine)残基。
Aβ之间的相互作用1-40 单体与金表面之间的相互作用被考虑在内 偶极相互作用,以及其水平 氢键作用在以下研究人员的工作中被假设: H. Schmidbauer 等55在另一项研究中,我们探究了SERS光谱随Aβ含量变化的情况1-40 在酸性条件下,它提取了与纳米尺寸相关的吸附形成56对于20 nm金颗粒,推测组氨酸(His)的C=C键或-C-N键引发吸附;而对于80 nm金颗粒,苯丙氨酸(Phe)或酪氨酸(Tyr)的苯环呼吸振动模式则到达金表面,从而启动吸附过程。Aβ的吸附过程1-40 在中性或碱性条件(pH ~10)下置于金表面被认为可维持 Aβ1-40 由于在水相条件下未形成沉淀,表明包被的金胶体具有亲水性。然而,在pH为4时观察到沉淀,说明聚集体具有疏水性。
透射电子显微镜(TEM)图像和白光图像仅能间接显示聚集现象的证据。我们曾尝试进行圆二色光谱(CD)分析,以将可逆聚集过程中观察到的形态与二级结构相关联。然而,散射导致的基线干扰使我们无法获得可重复的CD信号。因此,我们转而采用拉曼光谱,重点关注在pH约4条件下发生聚集(Aβ1-40的非折叠构象)或在pH约10条件下发生解聚(Aβ1-40的非折叠构象)时增强的振动模式。因此,本研究中对二级结构的最合理推断仅限于监测与二级结构相关的特征峰。这一点在pH 4条件下于1628 cm-1处观察到β-折叠结构时得到了验证。
本研究仅观察了直径为20 nm的金胶体对肽构象变化的影响,且仅研究了n值最高至10的情况。Aβ1-40肽的构象和聚集特性可能因吸附颗粒的尺寸不同而发生改变56。因此,仍需进一步研究以明确基于单体间网络连接的肽类性质,以及受吸附表面物理特性影响的肽类行为。在本研究测试的条件下,仅直径为20 nm的金胶体表现出聚集形态的可逆性,而胶体直径如何影响该性质可逆性的机制尚不清楚。将n值提高至20可能有助于更深入理解聚集形态可逆性的模式依赖程度。这些关于金胶体尺寸如何影响淀粉样β肽聚集行为的研究,将为揭示阿尔茨海默病病理的分子机制提供重要见解。
披露
作者声明,他们在此项工作中没有需要披露的利益冲突。
致谢
K.Y. 获得美国国家科学基金会 MRI 项目资助(项目编号:2117780)。该研究项目的初期阶段得到了杰内肖基金会的支持。A. I. 感谢纽约州立大学杰内肖分校化学系校友暑期科研奖学金(2019 年罗德斯奖和 2020 年利普科维茨奖)以及德雷福斯基金会本科生暑期科研奖学金对本研究的支持。
材料
| 姓名 | 公司 | 目录编号 | 评论 |
|---|---|---|---|
| 淀粉样蛋白β肽1-40(Aβ1–40肽) | r-Peptide (Bogart, GA, USA) | A-1156-2 | |
| CCD数码相机 | AMT | XR-40 4百万像素CCD | |
| Milli-Q水系统制备的去离子蒸馏水 | Millipore Sigma (Burlington, MA, USA) | Milli-Q IQ 7000 | |
| –86 oC超低温冰箱 | Thermo Scientific | Revco Chilly Willy RLE系列设备编号187004,生产编号40.04 | |
| 金胶体(10 nm) | Ted Pella, Inc. (Redding, California, USA) | 15703-20 | |
| 金胶体(100 nm) | Ted Pella, Inc. (Redding, California, USA) | 15711-22 | |
| 金胶体(15 nm) | Ted Pella, Inc. (Redding, California, USA) | 15704-20 | |
| 金胶体(20 nm) | Ted Pella, Inc. (Redding, California, USA) | 15705-20 | |
| 金胶体(30 nm) | Ted Pella, Inc. (Redding, California, USA) | 15706-21 | |
| 金胶体(40 nm) | Ted Pella, Inc. (Redding, California, USA) | 15707-21 | |
| 金胶体(50 nm) | Ted Pella, Inc. (Redding, California, USA) | 15708-21 | |
| 金胶体(60 nm) | Ted Pella, Inc. (Redding, California, USA) | 15709-22 | |
| 金胶体(80 nm) | Ted Pella, Inc. (Redding, California, USA) | 15710-22 | |
| 最高级V1AFM云母圆片 10 mm | Ted Pella Inc. | #50 | |
| 盐酸标准溶液,1.0 N | Fluka | 批号 SHBB4705V 318949-2L | |
| 石英比色皿,光程10 mm | Fire Fly Science | 型号1-MC-光程10mm | |
| 微型pH电极 | HORIBA | 型号 9618S (生产编号 9Y8E0050) | |
| Peak Fit程序 | Origin (Northampton, MA, USA) | OriginPro2018b (64位) b9.5.5.409 (学术版) | |
| pH 4.00缓冲溶液 | VWR | 货号 34170-127 | |
| pH 7.00缓冲溶液 | Fisher Chemical | 批号 SB107-4 191041 | |
| pH计 | HORIBA | 型号 F-72G (生产编号 B27M0017) | |
| 移液器吸头 Maxi吸头 1–5 mL | Fisher | 02-707-467 | |
| 移液器吸头 10 mL | Fisher | 02-717-135 | |
| 移液器吸头 1000 mL | Fisher | 02-717-156 | |
| 移液器吸头 1–200 mL | Fisher | 02-717-143 | |
| Fisher Brand Elite移液器 0.5–5 mL | Fisher | QU05317 | |
| Fisher Brand Elite移液器 100–1000 mL | Fisher | QU01672 | |
| Fisher Brand Elite移液器 10–100 mL | Fisher | MU10985 | |
| Fisher Brand Elite移液器 1–10 mL | Fisher | MU08178 | |
| 氢氧化钠溶液 1.0 M | Fluka | 批号 05096BPV 319511-2L | |
| 透射电子显微镜(TEM) | FEI Co | Morgagni model 268 | |
| TempAssure PCR管,平盖,无色 | USA Scientific | 聚丙烯材质,0.2 mL独立薄壁管,带磨砂平盖 | |
| 紫外-可见-近红外分光光度计(UV-Vis-NIR Spectrophotometer) | Varian | CARY 5000 UV1106M074 | |
| WI Tec alpha300R共聚焦拉曼显微镜 | WITec-Oxford Instrument | XMB3000-3001 |
参考文献
- Kirschner, D. A., et al. Synthetic peptide homologous to beta protein from Alzheimer disease forms amyloid-like fibrils in vitro. Proc Natl Acad Sci U S A. 84 (19), 6953-6957 (1987).
- Lomakin, A., Chung, D. S., Benedek, G. B., Kirshner, D. A., Teplow, D. B. On the nucleation and growth of amyloid -protein fibrils: detection of nuclei and quantitation of rate constants. Proc Natl Acad Sci U S A. 93 (3), 1125-1129 (1996).
- Walsh, D. M., Lomakin, A., Benedek, G. B., Condron, M. M., Teplow, D. B. Amyloid -protein fibrillogenesis. J Biolog Chem. 272 (3), 22364-22372 (1997).
- Lambert, M. P., et al. nonfibrillar ligands derived from Ab1-42 are potent central nervous system neurotoxins. Proc Natl Acad Sci U S A. 95 (11), 6448-6453 (1998).
- Bucciantini, M., et al. Inherent toxicity of aggregates implies a common mechanism for protein misfolding diseases. Nature. 416 (6880), 507-511 (2002).
- Walsh, D. M., et al. Naturally secreted oligomers of amyloid beta protein potently inhibit hippocampal long-term potentiation in vivo. Nature. 416 (6880), 535-539 (2002).
- Rocha, S., et al. Adsorption of amyloid beta-peptide at polymer surfaces: A neutron reflectivity study. ChemPhysChem. 6 (12), 2527-2534 (2005).
- Attanasio, F., et al. Carnosine inhibits Ab1-42 aggregation by perturbing the H-bond network in and around the central hydrophobic cluster. ChemBioChem. 14 (5), 583-592 (2013).
- Politi, J., Spadavecchia, J., Iodice, M., de Stefano, L. Oligopeptide-heavy metal interaction monitoring by hybrid gold nanoparticle based assay. Analyst. 140 (1), 149-155 (2015).
- Moshe, A., Landau, M., Eisenberg, D. Preparation of Crystalline samples of amyloid fibrils and oligomers. Methods Mol Biol. 1345, 201-210 (2016).
- Scarff, C. A., Ashcroft, A. E., Radford, S. E. Characterization of amyloid oligomers by electrospray ionization-ion mobility spectrometry-mass spectrometry (ESI-IMS-MS). Methods Mol Biol. 1345, 115-132 (2016).
- Sabaté, R., Gallardo, M., Estelrich, J. Temperature dependence of the nucleation constant rate in β amyloid fibrillogenesis. Int J Biol Macromol. 35 (1-2), 9-13 (2005).
- Niraula, T. N., et al. Pressure-dissociable reversible assembly of intrinsically denatured lysozyme is a precursor for amyloid fibrils. Proc Natl Acad Sci U S A. 101 (12), 4089-4093 (2004).
- Miller, A. E., et al. Behavior of β-Amyloid 1-16 at the air-water interface at varying pH by nonlinear spectroscopy and molecular dynamics simulations. J Phys Chem A. 115 (23), 5873-5880 (2011).
- Majzika, A., et al. Functionalization of gold nanoparticles with amino acid, -amyloid peptides and fragment. Colloids Surf B Biointerfaces. 81 (1), 235-241 (2010).
- Liu, L., et al. Electrochemical detectionof β-amyloid peptides on electrode covered with N-terminus-specific antibody based on electrocatalytic O2 reduction by Aβ(1-16)-heme-modified gold nanoparticles. Biosens Bioelectron. 49, 231-235 (2013).
- Elbassal, E. A., et al. Gold Nanoparticles as a Probe for Amyloid-β Oligomer and Amyloid Formation. J Phys Chem C Nanomater Interfaces. 121 (36), 20007-20015 (2017).
- Olmedo, I., et al. How changes in the sequence of the peptide CLPFFD-NH2 can modify the conjugation and stability of gold nanoparticles and their affinity for beta-amyloid fibrils. Bioconjug Chem. 19 (16), 1154-1163 (2008).
- Xu, Y., et al. Attenuation of the aggregation and neurotoxicity of amyloid peptides with neurotransmitter-functionalized ultra-small-sized gold nanoparticles. Eng Sci. 6, 53-63 (2019).
- John, T., Gladytz, A. K., Martin Clemens, L. L., Risselada, H. J., Abel, B. Impact of nanoparticles on amyloid peptide and protein aggregation: A review with a focus on gold nanoparticles. Nanoscale. 45, 20894-20913 (2018).
- Li, J., et al. Reduced aggregation and cytotoxicity of amyloid peptides by graphene oxide/gold nanocomposites prepared by pulsed laser ablation in water. Small. 10 (21), 4386-4394 (2014).
- Araya, E., et al. Gold nanoparticles and microwave irradiation Inhibit beta-amyloid amyloidogenesis. Nanoscale Res Lett. 3, 435(2008).
- Barrow, C. J., Yasuda, A., Kenny, P. T., Zagorski, M. G. Solution conformations and aggregational properties of synthetic amyloid beta-peptides of Alzheimer's disease. Analysis of circular dichroism spectra. J Mol Biol. 225 (4), 1075-1093 (1992).
- Wood, S. J., MacKenzie, L., Maleeff, B., Hurle, M. R., Wetzel, R. Selective inhibition of Ab fibril formation. J Biolog Chem. 271 (8), 4086-4092 (1996).
- Yokoyama, K. Nanoscale Surface Size Dependence in Protein Conjugation. Advances in Nanotechnology. , Nova Science Publishers. New York, NY. (2010).
- Yokoyama, K. Nanoscale Protein Conjugation. Advances in Nanotechnology. , Nova Science Publishers. New York, NY. (2010).
- Yokoyama, K. Modeling of Reversible Protein Conjugation on Nanoscale Surface in Computational Nanotechnology: Modeling and Applications with MATLAB. , CRC Press. Boca Raton. (2011).
- Yokoyama, K. Nano Size Dependent Properties of Colloidal Surfaces. Colloids: Classification, Properties and Applications. , Nova Science Publishers. New York, NY. (2012).
- Yokoyama, K. Controlling Reversible Self-Assembly Path of Amyloid Beta Peptide over Gold Colloidal Nanoparticle's Surface. Nanoscale Spectroscopy with Applications. , CRC Press, Taylor and Francis Group, LLC. (2013).
- Yokoyama, K., et al. Nanoscale size dependence in the conjugation of amyloid beta and ovalbumin proteins on the surface of gold colloidal particles. Nanotechnology. 19, 375101(2008).
- Yokoyama, K., Welchons, D. R. The conjugation of amyloid beta protein on the gold colloidal nanoparticles' surfaces. Nanotechnology. 18, 105101(2007).
- Edelhoch, H. Spectroscopic determination of tryptophan and tyrosine in proteins. Biochemistry. 6 (7), 1948-1954 (1967).
- Yokoyama, K., et al. Examination of adsorption orientation of amyloidogenic peptides over nano-gold colloidal particles surfaces. Int J Mol Sci. 20 (21), 5354-5380 (2019).
- Yokoyama, K., Ichiki, A. Oligomerization and Adsorption Orientation of Amyloidogenic Peptides over Nano-Gold Colloidal Particle Surfaces. Advances in Chemistry Research. , NOVA Science Publishers. New York, NY. (2020).
- Fan, X., Zheng, W., Singh, D. J. Light scattering and surface plasmons on small spherical particles. Light Sci Appl. 3, e179(2014).
- Yokoyama, K., et al. Microscopic investigation of reversible nanoscale surface size dependent protein conjugation. Int J Mol Sci. 10 (5), 2348-2366 (2009).
- Vishwanathan, K. Symmetry of gold neutral clusters Au3-20 and normal modes of vibrations by using the numerical finite difference method with density-functional tight-binding (DFTB) approach. Arch Chem Res. 2 (1), 4(2017).
- Gao, P., Weaver, M. J. Metal-adsorbate vibrational frequencies as a probe of surface bonding: halides and pseudohalides at gold electrodes. J Phys Chem. 90, 4057-4063 (1986).
- Stewart, S., Fredericks, P. M. Surface-enhanced raman spectroscopy of peptides and proteins adsorbed on an electrochemically prepared silver surface. Spectrochim Acta AMol Biomol Spectrosc. 55 (7-8), 1615-1640 (1999).
- Palings, I., et al. Assignment of fingerprint vibrations in the resonance Raman spectra of rhodopsin, isorhodopsin, and bathorhodopsin: Implications for chromophore structure and environment. Biochem. 26 (9), 2544-2556 (1987).
- Szekeres, G. P., Kneipp, J. SERS probing of proteins in gold nanoparticle agglomerates. Front Chem. 7, 30(2019).
- Lin, V. J. C., Koenig, J. L. Raman studies of bovine serum albumin. Biopolymers. 15 (1), 203-218 (1976).
- Hornemann, A., Drescher, D., Flemig, S., Kneipp, J. Intracellular SERS hybrid probes using BSA-reporter conjugates. Anal Bioanal Chem. 405 (19), 6209-6222 (2013).
- Dong, J., et al. Metal binding and oxidation of amyloid-beta within isolated senile plaque cores: Raman microscopic evidence. Biochemistry. 42 (10), 2768-2773 (2003).
- Carey, P. R. Biochemical Applications of Raman and Resonance Raman Spectroscopies. , Academic Press. New York, NY. (1982).
- Harada, I., Takeuchi, H. Raman and Ultraviolet Resonance Raman Spectra of Proteins and Related Compounds. Spectroscopy of Biological Systems : Advances in Infrared and Raman Spectroscopy. , Wiley. Chichester, UK. (1986).
- Overman, S. A., Thomas, G. J. Jr Raman markers of nonaromatic side chains in an α-helix assembly: Ala, Asp, GGly, Ile, Leu, Lys, Ser, and Val residues of phage fd subunits. Biochemistry. 38 (13), 4018-4027 (1999).
- Talaga, D., et al. Total internal reflection tip-enhanced Raman spectroscopy of tau fibrils. J Phys Chem B. 126 (27), 5024-5032 (2022).
- Grys, D. -B., et al. Citrate coordination and bridging of gold nanoparticles: The role of gold adatoms in AuNP aging. ACS Nano. 14 (7), 8689-8696 (2020).
- Guo, T., et al. Full-scale label-free surface-enhanced Raman scattering analysis of mouse brain using a black phosphorus-based two-dimensional nanoprobe. Appl Sci. 9 (3), 398-408 (2019).
- Walther, M., Plochocka, P., Fischer, B., Helm, H., Uhd Jepsen, P. Collective vibrational modes in biological molecules investigated by Terahertz time-domain spectroscopy. Biopolymers. 67 (4-5), 310-313 (2002).
- Lochocki, B., et al. label-free fluorescence and Raman imaging of amyloid deposits in snap-frozen Alzheimer's disease human brain tissue. Commun Biol. 4 (1), 474-486 (2021).
- Palombo, F., et al. Detection of Aβ plaque-associated astrogliosis in Alzheimer's disease brain by spectroscopic imaging and immunohistochemistry. Analyst. 143 (4), 850-857 (2018).
- Khoury, Y. E., et al. Raman imaging reveals accumulation of hemoproteins in plaques from Alzheimer's diseased tissues. ACS Chem Neurosci. 12 (15), 2940-2945 (2021).
- Schmidbaur, H., Raubenheimer, H. G., Dobrzańska, L. The gold-hydrogen bond, Au-H, and the hydrogen bond to gold Au∙∙∙H-X. Chem Soc Rev. 43 (1), 345-380 (2014).
- Yokoyama, K., et al. Protein corona formation and aggregation process of amyloid beta 1-40 coated gold nano-colloids. Langmuir. 40 (3), 1728-1746 (2024).
重印与许可
