本方案描述了利用视黄醇同位素稀释法估算维生素A总储存量(TBS)的方程,并简要概述了采用基于模型的房室分析结合超级受试者研究设计来估算群体及个体TBS的方法。
本文内容
摘要
摘要
利用稳定同位素方法定量估算维生素A总储存量(TBS)基于同位素稀释原理。简言之,向个体口服一次剂量的2H或13C标记的维生素A,在给药后预先设定的时间点(通常为14–21天)通过质谱法测定血浆中标记与未标记视黄醇的浓度。TBS可通过视黄醇同位素稀释(RID)方程或质量平衡方程计算得出。RID方程和质量平衡方程均需使用血浆中视黄醇的特异性活性(SAp,即示踪物与被示踪物的比率),该参数由质谱测量获得。两个方程均需引入系数值,以校正口服稳定同位素标记视黄醇在TBS估算时间点的吸收与储存情况。可采用已发表的系数值代入方程。或者,也可通过WinSAAM(Simulation, Analysis, and Modeling)软件对血浆视黄醇动力学数据进行基于模型的房室分析来确定TBS。简言之,可采用“超级受试者”研究设计,结合基于模型的血浆视黄醇动力学数据房室分析,以确定群体TBS及人群特异性的复合系数(FaS),随后将该系数用于RID方程以计算个体TBS。“超级受试者”设计需要估算参与者的平均膳食维生素A摄入量,并在约28–91天内进行约11–16个时间点的采血,每个时间点包含5–7名参与者,但每位参与者仅提供2–3次血液样本。肝脏维生素A浓度可根据TBS估算,需假设肝脏中TBS所占比例,并结合肝脏重量的估计值。通过将估算的肝脏维生素A浓度与建议的临界值进行比较,可评估维生素A营养状况,从而对从缺乏到过量的全范围维生素A储存状态进行分类。
引言
稳定同位素法可对维生素A总身体储存量(TBS)进行定量估算,并可用于评估社区环境中儿童和成年人的维生素A营养状况1。由于该方法可在从缺乏到过量储存的整个营养状态连续谱中提供TBS的定量估计,因此被认为是评估人类维生素A营养状况的最佳间接方法1。相比之下,血清中视黄醇或视黄醇结合蛋白浓度常被用于评估营养状况;然而,除非体内储存量极低,否则这些指标并不能反映维生素A的体储存量,因为血清视黄醇受体内稳态调控;此外,在炎症期间其浓度会暂时下降,使得在感染率较高的人群中结果解释变得复杂2。改良相对剂量反应(MRDR)试验可评估肝脏维生素A储备是否充足,但无法提供肝脏维生素A浓度的定量估计值2。通常,稳定同位素法用于研究维生素A代谢,以及评估在维生素A缺乏高风险人群中干预措施的效果3,4,5,6,7,8,9,10。该方法还可用于评估暴露于多种维生素A来源(如强化食品、大剂量维生素A补充剂和/或微量营养素粉剂)的人群中维生素A储存过量的风险1,11。这些应用对于深入理解生命全过程中的维生素A代谢、优化维生素A需求量推荐值,以及评估旨在改善资源匮乏社区中儿童和育龄妇女营养与健康结局的维生素A干预措施的有效性和安全性具有重要意义。TBS可通过视黄醇同位素稀释(RID)法,结合RID方程或质量平衡方程进行估算。或者,也可采用基于WinSAAM模拟、分析与建模软件(www.winsaam.org)的群体超受试者设计,对血浆视黄醇动力学数据进行基于模型的房室分析来估算TBS12。简而言之,这些方法包括:1)向受试者单次口服给予标记稳定同位素的维生素A;2)在同位素给药后约14-21天采集1-2份血液样本(用于RID方法),或在28-91天内每位受试者采集2-3份血液样本,并结合群体平均膳食维生素A摄入量估计值(用于基于模型的房室分析);以及3)使用合适的质谱仪(GC-C-IRMS、GC/MS、LC/MS/MS)测定血浆中标记与非标记视黄醇的浓度。
本方案旨在为首次使用RID方法的研究人员提供指导,介绍如何利用RID方程或质量平衡方程计算总维生素A储存量(TBS)。此外,本文简要概述了采用超级受试者研究设计结合基于模型的房室分析法来估算一组研究对象及个体TBS的方法;然而,血浆视黄醇动力学数据的房室建模具体操作不在本文范围之内(有关该方法的更多细节,请参见Green等人的研究12)。关于维生素A稳定同位素方法的综述,可参见Lietz等人的文献1。
用于估算总维生素A储存量(TBS)的RID方程
当向个体口服给予稳定同位素标记的维生素A后,采用液相色谱-串联质谱法(LC/MS/MS)或气相色谱-质谱法(GC/MS)测定血浆中标记与非标记视黄醇,以获得血浆视黄醇特异性活性(SAp)(即血浆中示踪物与被示踪物的比值)13,14。使用RID方程估算TBS需在同位素给药后约14-21天采集一次血样。以下RID方程用于估算成人和儿童的TBS15:
TBS = Fa × S × (1/SAp)
其中,TBS 表示维生素 A 的总量,单位为 µmol;Fa 表示在时间 t 时口服的标记维生素 A 示踪剂被吸收并进入体内储存池的比例;S 表示在时间 t 时血浆中视黄醇特异性活性(SAp)与储存池中视黄醇特异性活性(SAs)的比值。SAp 为血浆视黄醇特异性活性,表示为血浆中剂量所占比例:即(血浆中被标记视黄醇 / 血浆中未标记与被标记视黄醇总量)/ 口服的被标记视黄醇剂量(µmol)12。需要注意的是,在通常估算 TBS 的 14–21 天后,同位素给药后未标记视黄醇对分母中总视黄醇的贡献可忽略不计。有关 RID 方程的详细讨论,请参见 Green 等人12。
由于系数 Fa 和 S 在 RID 方程中相乘,因此通常将它们合称为复合系数 FaS。已有针对具有广泛 TBS 范围的理论成人和儿童、在同位素给药后多个时间点的复合系数 FaS 的发表值(表 1;改编自 Green 和 Green15)。这些数值可用于 RID 方程,以计算来自相似人群个体的 TBS15。或者,也可通过基于模型的血浆视黄醇动力学数据房室分析,确定适用于特定人群的复合系数 FaS 值12,16。
估算总维生素A储存量的质能平衡方程:
质量平衡方程用于计算总维生素A储存量(TBS),当口服剂量为 13C标记的维生素A给予个体后,采用气相色谱-燃烧-同位素比值质谱法(GC-C-IRMS)进行测定 13C富集(13血清中C/总C10,17质量平衡方程需要两个血液样本:一个基线样本用于测量天然丰度的 13血清中的C,以及给药后14天采集的第二份样本用于测定 13血清中碳同位素富集。然而,若研究者旨在估算一组个体的平均总储存量(TBS),可在5-6名受试者中进行基线血液采样,并计算其平均值 13对于这些个体,C丰度可作为基线的估计值 13血清中该群体个体的碳同位素丰度。天然丰度的 13C 约为 1.1%,但由于其可能随饮食变化,应在基线时准确测定血清中的 C 值,以校正给药后的结果 13碳丰度,如下方示例所示10。质量平衡方程需要测定同位素丰度(13C/总C)用于:1)剂量的 13C标记的维生素A(Fa),2)基线血清视黄醇(Fb)以及3)服药后血清视黄醇(Fc)。同位素丰度的测量值用于计算示踪物与被示踪物的比率,进而计算总维生素A储存量(TBS)。方程中还包含其他校正因子,以校正示踪剂量的吸收和储存情况 13C标记的维生素A在TBS评估时的情况。关于质量平衡方程的详细讨论,参见Gannon和Tanumihardjo10.
以下所示的质量平衡方程用于估算成人或儿童的维生素A总储存量(TBS):
TBS = a × (1/TTR) × (吸收系数 × 储存系数)
其中 TTR 为血清中示踪物与待测物的比率。因子 a 用于校正从给药到采血期间 13C 标记的维生素 A 示踪剂的损失,其值计算为 e-kt,其中 k = ln(2)/视黄醇的半衰期,t = 给药后的天数10。示踪剂剂量吸收因子在成人中假设为 0.8–1.0(80%–100%),在儿童中为 0.75–0.9(75%–90%)10。储存因子(血清中 TTR 与储存量的比率)在给药后 14 天期间未控制膳食维生素 A 摄入时假设为 0.8,而在膳食维生素 A 摄入量较低且受控时为 1.010。
肝脏维生素A浓度的估算
可根据肝脏中储存的维生素A占总储存量(TBS)的比例,来估算肝脏的总维生素A储备。当维生素A营养状况较低时,假设TBS中约有50%存在于肝脏;当维生素A营养状况充足时,该比例约为80%。这些假设基于有限的数据,显示肝脏维生素A占总维生素A的比例依赖于维生素A的营养状况,范围可从约40%至90%18,19。目前仍需更多数据以更准确地估算肝脏维生素A占总维生素A的百分比。在获得更充分数据之前,表2中的信息可用于评估研究人群的维生素A营养状况,以决定采用50%还是80%的假设值。此外,如果6-59月龄儿童中血清视黄醇浓度<0.7 µmol/L的患病率≤10%,则认为该人群的维生素A营养状况充足;需注意,此临界值与世界卫生组织(WHO)定义的轻度公共卫生问题级别的维生素A缺乏分类重叠(表2)20,21。肝脏维生素A浓度是根据肝脏总储备和肝脏重量计算得出的,儿童的肝脏重量可按体重的3%估算,成人的肝脏重量可按体重的2.4%估算22。或者,也可通过体表面积(BSA)结合预测方程来估算肝脏重量23。
基于模型的房室分析结合超级受试者设计估算群体及个体总维生素A储存量的概述
基于模型的房室分析可用于通过频繁采样研究个体视黄醇代谢动力学,但在难以实施频繁采样的人群中尤为有用,例如资源匮乏的社区环境中年幼儿童、学龄前儿童,以及可能的孕妇和哺乳期妇女11,24,25,26,27。将基于模型的房室分析与超级受试者研究设计结合,可用于预测研究参与者群体的总维生素A储存量(TBS),并估算复合系数FaS的群体特异性数值,该数值随后可用于视黄醇同位素稀释(RID)方程以确定个体研究对象的TBS12,24。超级受试者设计在社区环境中应用,旨在尽量减少每位个体所需的采血次数12,24,26。以一项持续91天、共105名受试者、设置16个采血时间点的研究为例(见表3)。在此示例中,每位受试者摄入单次口服剂量的稳定同位素标记维生素A,并在给药后14天提供一份血样,用于结合模型推导出的第14天FaS值,通过RID方程估算每个个体的TBS;此外,在其余15个时间点中的任意一个时间点再提供第二份血样,以获取进行基于模型的房室分析所需的血浆视黄醇动力学数据。在此设计中,每个额外的15个采血时间点均分配7名受试者。通常每个时间点5名参与者已足够,但由于部分受试者可能错过指定的采血时间,因此建议每个时间点安排约7人。血浆样本通过质谱法分析,测定标记与非标记视黄醇的浓度,并计算血浆中维生素A同位素剂量的分数(FDp)。简要而言,将几何平均FDp随时间变化的数据绘图,并使用WinSAAM软件拟合至房室模型12,24,26。一个用于全身维生素A代谢的8房室模型示例见图115。该模型包含代表血浆维生素A的房室(房室5),以及两个可交换的维生素A储存池(房室6(大)和房室7(小))。两个可交换储存房室中维生素A质量之和即作为TBS的估算值:
总储存量(TBS,µmol)= M(6) + M(7)
其中 M(I) 为 µI 室中的维生素 A 摩尔数
在超级受试者研究期间的任意时间点 (t),均可使用以下方程计算特定人群的系数 Fa 和 S 的值12,24:
Fat = F(6)t + F(7)t
St = SApt / SAst = [F(5)t / M(5)] / {[F(6)t + F(7)t] / [M(6) + M(7)]}
其中,Fat 表示在时间 t 时摄入的示踪剂剂量被吸收并进入储存库的比例;F(I)t 表示在时间 t 时示踪剂剂量存在于隔室 I 中的比例;St 表示在时间 t 时血浆中相对于储存库的特异性活性;SA 表示在时间 t 时血浆(p)或储存库(s)中视黄醇的特异性活性;M(I) 表示隔室 I 中的维生素 A 含量(单位为 µmol)。有关基于模型的房室分析的详细讨论,请参见 Green 等人12。
方案
数据为假设性;本研究未涉及任何人类受试者。
1. 使用RID方程估算TBS
- 使用RID方程估算TBS时,采用以下假设的受试者数据:
年龄:25岁
血浆中标记的视黄醇浓度:0.0163 µmol/L
血浆中未标记的视黄醇浓度:1.154 µmol/L
口服标记的维生素A剂量:6.838 µmol RE
已发表的综合系数 FaS 14天时15: 0.727
注意:维生素A同位素剂量的用量基于标记的维生素A化合物的维生素A活性(通常 2H 或 13C标记的视黄醇乙酸酯)表示,单位为µmol视黄醇当量(RE)。例如,如果 2H6-视黄醇乙酸酯用于口服给药,所需剂量为2000 µg RE时,其给药剂量为 2H6-视黄醇乙酸酯的计算基于其分子量 2H6-视黄基乙酸酯(328.49 µg/µmol)和 2H6-视黄醇(292.49 µg/µmol):2000 × (328.49/292.49) = 2246 µg 2H6-视黄醇乙酸酯。将剂量(µg RE)除以视黄醇的分子量,即可计算出以 µmol 表示的 2000 µg RE 剂量。 2H6-视黄醇:2000/292.49 = 6.838 µmol。 - 计算 SAp 使用以下公式:
SAp = [血浆中标记的视黄醇 /(标记的视黄醇 + 未标记的视黄醇)] / 剂量(µmol)
使用上述参与者数据求解方程:
SAp = [0.0163 / (0.0163 + 1.154)] / 6.838 = 0.0020 µmol - 使用以下所示的RID方程计算TBS:
TBS = FaS x (1/SAp)
使用上述参与者数据来获取 FaS 值,以及计算得到的 SAp 步骤2的值:
TBS = 0.727 × (1 / 0.0020) = 364 µmol
2. 利用质量平衡方程估算TBS
- 使用质量平衡方程估算TBS时,采用以下假设的受试者数据:
年龄:4岁
Fa (2个碳标记加上天然丰度):0.11
Fb: 0.010745
Fc: 0.0110476
应用示踪剂剂量:1.0 µmol RE
吸收与储存的影响因素:
吸收率:0.8
储存:血清与肝脏中TTR的比率(未控制饮食):0.8
注意: 13C2标记的维生素A用于给药,给药剂量的同位素丰度(Fa) 的计算公式为:([13C2] 标记于合成 + 自然丰度(13C/20C 总计)10假设本示例中的吸收率为0.8;可根据影响研究人群维生素A吸收的因素(例如,炎症/感染率可能降低吸收)在0.8–1.0范围内选择适当数值1)。请注意 Fa 这里的值与系数不同 法 在RID方程中。 - 使用以下公式计算示踪剂与示踪物比率(Tracer-to-Tracee Ratio, TTR):
TTR = (Fc- Fb)/(Fa-Fc)
其中, Fa = 13C同位素在 13C标记的维生素A剂量; Fb = 13基线血清视黄醇的碳同位素丰度; Fc = 13给药后血清视黄醇的碳同位素丰度
使用以下数值 Fa, Fb,以及 Fc 根据上述参与者数据计算 TTR:
TTR = (0.0110476 - 0.010745) / (0.11 - 0.0110476) = 0.003058035 - 然后,计算 1/TTR
1/TTR = 1 / 0.003058035 = 327.01 - 接下来,计算该因子 a 使用以下公式:
因子 a = 13C标记的维生素A剂量(µmol)x e-kt- 首先,计算 k 使用下述公式:
k=ln(2)/视黄醇的半衰期
自然对数 ln(2) 等于 0.693147181;儿童视黄醇的半衰期估计为 32 天*;利用这些信息进行计算 k
k= 0.693147181 / 32 = 0.021660849
*视黄醇半衰期的估计值(儿童为32至136天;成人为140天);或可根据研究期间对照组个体示踪剂剂量的衰减速率来估算数值3,10. - 接下来,计算 e-kt, 其中 t 是时间(同位素给药后的天数; t = 14 天用于质量平衡方程)。将此信息与计算得到的值结合使用 k 来自步骤 4.1:
e-kt = e-0.02166 × 14 = 0.738413073 - 最后,计算因子 a,利用下方所示方程、上述受试者数据中的同位素剂量(1.0 µmol)以及计算所得值 e-kt
因子 a = 13C标记的维生素A剂量(µmol)x e-kt
因子 a = 1.0 × 0.738413073 = 0.738413073
- 首先,计算 k 使用下述公式:
- 使用以下质量平衡方程计算TBS:
TBS = a × (1/TTR) × 吸收系数 × 储存系数
使用计算所得的因子 a (0.738413073) 和计算得到的 1/TTR 值(327)来自上述步骤,以及吸收率(0.8)和储存率(0.8)的固定值:
TBS = 0.738413073 × 327 × 0.8 × 0.8 = 155 µmol
3. 肝脏维生素A含量测定
- 为计算总肝脏维生素A储备量及肝脏维生素A浓度,请使用以下受试者数据:
年龄:25岁
体重:61.0 kg
身高:156.8 cm
总维生素A储量(TBS):364 µmol(通过RID法估算)
研究人群中血浆视黄醇浓度<0.7 µmol/L的患病率<2%。 - 首先,根据体表面积(BSA)计算肝脏重量,使用以下公式:
BSA (m2) = sqrt [体重 (kg) × 身高 (cm) / 3600]
使用上述受试者数据计算BSA:
BSA (m2) = sqrt [61.0 × 156.8 / 3600] = 1.63 m2 - 接下来,使用以下适当的公式及上一步计算出的BSA值计算肝脏重量:
若体表面积(BSA)<1:
肝脏重量 (g) = 772 (g/m2) × 体表面积 (BSA) - 38
若体表面积(BSA)≥1:
肝脏重量 (g) = 772 (g/m2) × 体表面积 (BSA)
使用以下公式计算BSA;(注意:根据第2步 结果,BSA ≥1):
肝脏重量 (g) = 772 (g/m2) × 体表面积 (BSA)
肝脏重量 (g) = 772 (g/m2) × 1.63 m2 = 1258 g - 最后,使用以下公式计算肝脏维生素A浓度:
肝脏维生素A浓度 = TBS (µmol) × 肝脏中TBS所占比例 / 肝脏重量 (g)
使用上述受试者数据中的TBS值(364 µmol),假设肝脏中TBS所占比例为0.8(基于血清视黄醇水平低者患病率<2%,推断研究人群的维生素A营养状况充足),以及上一步计算出的肝脏重量(1258 g):
肝脏维生素A浓度 = 364 µmol × 0.8 / 1258 = 0.232 µmol/g 肝脏
4. 群体的模型预测TBS
- 为了使用超级受试者研究设计计算该群体(研究人群)的模型预测总维生素A储量(TBS),请采用以下针对育龄期女性开展的超级受试者研究所得的假设性建模结果(有关此方法的详细信息,请参见 Green 等人15):
假设性模型输出:
M(6) = 973.281 µmol
M(7) = 55.7646 µmol - 利用提供的超级受试者模型输出结果及以下公式计算该群体的总维生素A储量(TBS):
TBS = M(6) + M(7)
使用模型输出中第6和第7隔室的维生素A质量:
TBS = 973.281 + 55.7646 = 1029 µmol
注:如何根据模型输出计算复合系数 FaS 的示例超出了本概述的范围。欲了解更多信息,请参见 Green 等人12,15。
结果
本方案展示了如何利用视黄醇同位素稀释法,结合RID方程或质量平衡方程,对成人或儿童的全身维生素A储量(TBS)进行定量估算。当满足特定条件时,采用RID方程 2H 或 13使用碳标记的维生素A进行给药,采用液相色谱-串联质谱法(LC/MS/MS)或气相色谱-质谱法(GC/MS)测定血浆中标记与非标记视黄醇的浓度。RID方程需要基于质谱测定得到的血浆视黄醇特异性活性(示踪剂与示踪剂之比)、标记维生素A的口服剂量(µmol RE)以及一个复合系数的数值。 FaS复合系数的已发表数值 FaS 可获得;或者,可通过基于模型的房室模型对血浆视黄醇动力学数据进行分析,以估算特定人群的数值。RID 公式通常在给药后约 14 至 21 天应用,但如果提供相应的复合系数值,也可在更晚的时间点应用 FaS 是可获得的。本示例所示的TBS值为364 µmol。
当使用13C标记的维生素A进行给药,并采用气相色谱-燃烧-同位素比值质谱法(GC-C-IRMS)测定血浆中13C同位素丰度时,可应用质量平衡方程。该方程需要输入示踪物与被示踪物的比率(即血浆中测得的13C同位素丰度)以及用于校正13C标记维生素A剂量在TBS评估时刻的吸收和储存因素(系数)的数值。文献中已发表可用于该方程的系数值。质量平衡方程通常在给药后14天应用。本示例中所示TBS的值为155 µmol。
采用基于模型的血浆视黄醇动力学数据区室分析方法,并结合超级受试者设计,用于估算一组研究参与者的全身维生素A储存量(TBS),并确定系数FaS的数值,以便后续用于估算个体参与者的TBS。该组的TBS被计算为体内可交换维生素A储存池中的维生素A质量;而个体研究参与者的TBS则在服药后14天和/或更晚时间点,利用每位参与者的血浆视黄醇特异性活性值(SAp)以及相应模型推导出的在选定时间点的FaS系数,结合RID方程进行计算。本示例中所得TBS值为1029 µmol。
可通过将TBS转换为肝脏维生素A浓度,并将肝脏维生素A浓度与用于划分维生素A营养状况的临界值进行比较来解读TBS结果;需要注意的是,2015年提出的从缺乏到中毒的临界值范围,随着更多数据的积累,可能会被进一步优化2。本示例中所示的肝脏维生素A浓度为0.232 µmol/g 肝脏
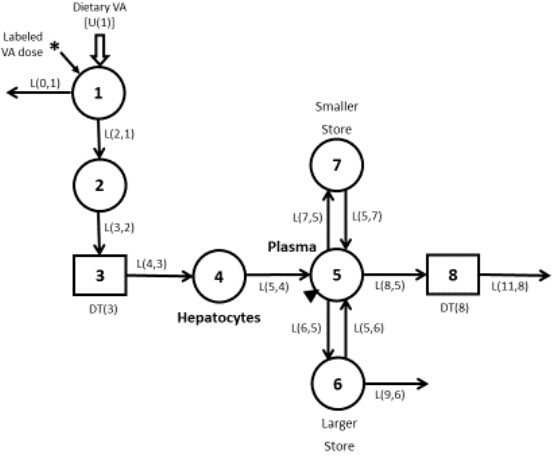
图1:人体全身体内维生素A代谢的房室模型。 圆圈代表房室;矩形代表延迟单元;组件之间的箭头表示分数转移系数 [L(I,J),即每天从房室J转移到房室I的视黄醇比例] 和延迟时间 [DT(I),即在延迟单元I中停留的天数]。房室1是摄入的示踪剂(*)和膳食维生素A [U(1)] 进入系统的位点。房室1至4代表消化、吸收以及乳糜微粒的加工过程,直至肝细胞(房室4)摄取,随后以视黄醇结合蛋白结合的形式将视黄醇分泌至血浆房室5,该房室为取样位点(三角形)。房室8表示组织对血浆视黄醇的不可逆摄取,且视黄醇不再循环回系统。血浆中的视黄醇也可与两个血管外池(较大的房室6和较小的房室7)中的维生素A进行交换,其中房室6和房室8为系统不可逆损失的位点。VA = vitamin A。本图改编自15。请点击此处查看此图的放大版本。
表1:理论成人和儿童在选定时间的复合系数 FaS 的估计值。建议在暴露后14天或更晚应用RID方程来估算成人的全身总β辐射(TBS)。缩写:GM = 几何平均数;NA = 不适用。本表经15修改。 请点击此处下载该表格。
表2:维生素A缺乏症的人群患病率临界值。 缩写:VAD = 维生素A缺乏症;MRDR = 改良相对剂量反应试验;WHO = 世界卫生组织。本表格改编自21。请点击此处下载该表格。
表3:91天超级受试者研究中每个时间点的参与者人数。所有参与者(n=105)均在第14天进行采血,每位参与者在91天研究期间被随机分配到第二个时间点,以确保每个时间点至少有7名参与者,每位参与者共提供2份血样。请点击此处下载该表格。
讨论
总之,稳定同位素方法可对成人和儿童的总身体水(TBS)进行定量估算,并可应用于社区环境1成人和儿童的总维生素A储量(TBS)可通过视黄醇同位素稀释法,结合同位素稀释(RID)方程或质量平衡方程进行估算。尽管这两个方程均基于相同原理 同位素稀释法相比,存在一些差异。简而言之,RID方程仅需采集一次血液样本,通常在约14-21天时应用,但如果具备相应的复合系数值,也可在更晚的时间点应用 FaS 是可获得的。关于复合系数的已发表数值 FaS 在给药后不同时间点可获取,用于 RID 方程计算15;或者,可采用基于模型的房室分析法确定特定人群的数值。质量平衡方程需要采集2次血液样本,一次在基线时,另一次在给药后14天。然而,如前所述,若需估算一组受试者的平均总生物素储量(TBS),则基线血液样本可仅采集5–6名参与者,并取其平均值 13个体的碳同位素丰度可作为基线水平的估计值 13血清中碳元素丰度
应用RID方程时,需注意将剂量表示为维生素A活性(µmol RE),而非标记的视黄醇酯的微摩尔数(µmol)。若使用已发表的FaS系数值,则应选择来源于相似人群(儿童或成人)且与测量SAp以估算总身体储存量(TBS)的时间点(研究日)相对应的FaS值。应用质量平衡方程时,必须考虑13C标记的维生素A剂量中13C的天然丰度,并将服药后血清中13C的丰度校正为基线时血清中13C的天然丰度,以获得准确的TBS估算值10。
基于模型的房室建模结合超级受试者研究设计,在社区环境中用于估算群体总身体水分(TBS)以及研究期间人群特异性的复合系数FaS值12,24。该方法的一个优势在于,模型推导出的复合系数FaS值相较于来自其他人群的已发表数值,可能为该群体中个体的TBS提供更准确的估计。该方法还为现场研究中的采血时间安排提供了更大的灵活性。例如,若受试者在其指定的同位素稀释法(RID)采血时间无法配合,血液样本可在稍后时间采集,并将相应模型推导出的复合系数FaS值代入RID方程,以估算其TBS12,24。
TBS 结果可通过将 TBS 转换为肝脏维生素 A 浓度,并将该值与建议的肝脏维生素 A 浓度分界值进行比较来解读,以对从缺乏到中毒的全范围维生素 A 营养状态进行分类2。尽管所提出的截断值表明 >1 µmol/g 肝脏表示维生素A过多症,近期研究表明在1-3 µmol/g之间未观察到不良效应,而组织病理学改变出现在 >3 µmol/g11,28. 更多数据正在 需要进一步研究人体肝脏维生素A浓度及其生理效应,以优化亚毒性及毒性状态分类的临界值。
尽管稳定同位素方法在评估维生素A营养状况时可提供总储存量(TBS)的定量估计,且被认为是评估营养状况的最佳方法,但由于其成本相对较高,且以下资源获取受限,目前尚未得到广泛应用:稳定同位素标记的维生素A以及配制和给药所需的专业技术;用于血浆分析的质谱仪及相应专业技术;研究设计和应用TBS估算方程所需的专业知识;以及基于模型的血浆视黄醇动力学数据分析所需的专业技能。对于新使用者而言,在研究的规划、实施和分析阶段,专家咨询或合作至关重要,以确保研究成功。
尽管存在挑战,近年来稳定同位素技术方法已取得进展,促进了其在社区环境中的应用12,29。未来采用该方法的研究有望产生关于全生命周期中维生素A代谢与需求、膳食维生素A原类胡萝卜素的生物效能,以及改善维生素A缺乏风险人群维生素A营养状况的干预措施的有效性和安全性的重要新信息。
披露
作者无任何利益冲突需要披露。
致谢
感谢 Cornelia Loechl 和 Veronica Lopez-Teros 对本方案所包含主题的指导。
材料
| 姓名 | 公司 | 目录编号 | 评论 |
|---|---|---|---|
| Excel | Microsoft | Microsoft Excel | |
| 德州仪器 TI-30XIIS 科学计算器 | Texas Instruments | TI-30XIIS |
参考文献
- Lietz, G., et al. Current capabilities and limitations of stable isotope techniques and applied mathematical equations in determining whole-body vitamin A status. Food and Nutr. 37, S87-S103 (2016).
- Tanumihardjo, S. A., et al. Vitamin A: biomarkers of nutrition for development. Am J Clin Nutr. 94 (2), 658s-665s (2011).
- Gannon, B., et al. Biofortified orange maize is as efficacious as a vitamin A supplement in Zambian children even in the presence of high liver reserves of vitamin A: a community-based, randomized placebo-controlled trial. Am J Clin Nutr. 100 (6), 1541-1550 (2014).
- Pinkaew, S., Udomkesmalee, E., Davis, C. R., Tanumihardjo, S. A. Vitamin A-fortified rice increases total body vitamin A stores in lactating Thai women measured by retinol isotope dilution: a double-blind, randomized, controlled trial. Am J Clin Nutr. 113 (5), 1372-1380 (2021).
- Haskell, M. J., et al. Daily consumption of Indian spinach (Basella alba) or sweet potatoes has a positive effect on total-body vitamin A stores in Bangladeshi men. Am J Clin Nutr. 80 (3), 705-714 (2004).
- Jamil, K. M., et al. Daily consumption of orange-fleshed sweet potato for 60 days increased plasma beta-carotene concentration but did not increase total body vitamin A pool size in Bangladeshi women. J Nutr. 142 (10), 1896-1902 (2012).
- Tang, G., et al. Green and yellow vegetables can maintain vitamin A body stores in Chinese children. Am J Clin Nutr. 70, 1069-1076 (1999).
- Haskell, M. J., Jamil, K. M., Peerson, J. M., Wahed, M. A., Brown, K. H. The paired deuterated retinol dilution technique can be used to estimate the daily vitamin A intake required to maintain a targeted whole body vitamin A pool size in men. J Nutr. 141 (3), 428-432 (2011).
- Valentine, A. R., Davis, C. R., Tanumihardjo, S. A. Vitamin A isotope dilution predicts liver stores in line with long-term vitamin A intake above the current Recommended Dietary Allowance for young adult women. Am J Clin Nutr. 98, 1192-1199 (2013).
- Gannon, B. M., Tanumihardjo, S. A. Comparisons among Equations Used for Retinol Isotope Dilution in the Assessment of Total Body Stores and Total Liver Reserves. J Nutr. 145 (5), 847-854 (2015).
- Engle-Stone, R., et al. Filipino Children with High Usual Vitamin A Intakes and Exposure to Multiple Sources of Vitamin A Have Elevated Total Body Stores of Vitamin A But Do Not Show Clear Evidence of Vitamin A Toxicity. Curr Dev Nutr. 6 (8), nzac115(2022).
- Green, M. H., Green, J. B., Ford, J. L. Better Predictions of Vitamin A Total Body Stores by the Retinol Isotope Dilution Method Are Possible with Deeper Understanding of the Mathematics and by Applying Compartmental Modeling. J Nutr. 150 (5), 989-993 (2020).
- Oxley, A., et al. Determination of Vitamin A Total Body Stores in Children from Dried Serum Spots: Application in a Low- and Middle-Income Country Community Setting. J Nutr. 151 (5), 1341-1346 (2021).
- Tang, G., Qin, J., Dolnikowski, G. G. Deuterium enrichment of retinol in humans determined by gas chromatography electron capture negative chemical ionization mass spectrometry. J Nutr Biochem. 9, 408-414 (1998).
- Green, M. H., Green, J. B. Use of Model-Based Compartmental Analysis and Theoretical Data to Further Explore Choice of Sampling Time for Assessing Vitamin A Status in Groups and Individual Human Subjects by the Retinol Isotope Dilution Method. J Nutr. 151 (7), 2068-2074 (2021).
- Ford, J. L., Green, J. B., Green, M. H. A Population-Based (Super-Child) Approach for Predicting Vitamin A Total Body Stores and Retinol Kinetics in Children Is Validated by the Application of Model-Based Compartmental Analysis to Theoretical Data. Curr Dev Nutr. 2 (11), nzy071(2018).
- Tanumihardjo, S. A. Vitamin A status assessment in rats with 13C4-retinyl acetate and gas chromatogrphy/combustion/isotope ratio mass spectrometry. J Nutr. 130 (11), 2844-2849 (2000).
- Institute of Medicine. Dietary reference intakes: vitamin A, vitamin K, arsenic, boron, chromium, copper, iodine, iron, manganese, molybdenum, nickel, silicon, vanadium and zinc. , National Academy Press. Washington, DC. (2001).
- Raica, N. Jr, Scott, B. S., Lowry, L., Sauberlich, H. E. Vitamin A concentration in human tissues collected from five areas in the United States. Am J Clin Nutr. 25, 291-296 (1972).
- Conditions for Scaling Back Universal Vitamin A Supplementation - Policy Brief. , Global Alliance for Vitamin A, Nutrition International, Helen Keller International, UNICEF. https://www.gava.org/resources-tools/ (2019).
- Indicators for assessing vitamin A deficiency and their application in monitoring and evaluating intervention programmes. , World Health Organization. https://www.who.int/nutrition/publications/micronutrients/vitamin_a_deficiency/WHO_NUT_96.10/en/ (1992).
- Olson, J. A. Recommended dietary intakes (RDI) of vitamin A in humans. Am J Clin Nutr. 45, 704-716 (1987).
- Yoshizumi, T., et al. A simple new formula to assess liver weight. Transplant Proc. 35 (4), 1415-1420 (2003).
- Ford, J. L., et al. Use of Model-Based Compartmental Analysis and a Super-Child Design to Study Whole-Body Retinol Kinetics and Vitamin A Total Body Stores in Children from 3 Lower-Income Countries. J Nutr. 150 (2), 411-418 (2020).
- Lopez-Teros, V., et al. Use of a Super-child Approach to Assess the Vitamin A Equivalence of Moringa oleifera Leaves, Develop a Compartmental Model for Vitamin A Kinetics, and Estimate Vitamin A Total Body Stores in Young Mexican Children. J Nutr. 147 (12), 2356-2363 (2017).
- Lopez-Teros, V., et al. The "Super-Child" Approach Is Applied To Estimate Retinol Kinetics and Vitamin A Total Body Stores in Mexican Preschoolers. J Nutr. 150 (6), 1644-1651 (2020).
- Green, M. H., Lopez-Teros, V., Avila-Prado, J., Green, J. B. Direct Use of Plasma or Milk Vitamin A Specific Activity Data to Model Retinol Kinetics and Predict Vitamin A Stores in Theoretical Lactating Women. J Nutr. 152 (12), 2993-2999 (2022).
- Olsen, K., et al. Serum retinyl esters are positively correlated with analyzed total liver vitamin A reserves collected from US adults at time of death. Am J Clin Nutr. 108 (5), 997-1005 (2018).
- Green, M. H., Ford, J. L., Green, J. B. Inclusion of Vitamin A Intake Data Provides Improved Compartmental Model-Derived Estimates of Vitamin A Total Body Stores and Disposal Rate in Older Adults. J Nutr. 149 (7), 1282-1287 (2019).