This protocol aims to explore the cellular composition and temporal placement of candidate cell-of-origin for leukemias that arise in utero by integrating single-cell and/or bulk RNA sequencing from hemogenic gastruloids with patient data.
需要JoVE订阅才能观看此内容。 请登录或开始免费试用
方法文章
Cell-of-Origin Discovery in Infant Leukemia through Integration of 3D Models and Patient Transcriptomic Data
本文内容
摘要
摘要
Pediatric hematological malignancies remain challenging to investigate and model due to the age group-specificity of certain genetic abnormalities. In utero origin has been demonstrated for a subset of pediatric leukemias, placing their respective cell of origin (CoO) during embryonic development. We recently reported a 3D hemogenic gastruloid (haemGx) model of embryonic blood formation derived from mouse embryonic stem cells, resolving the spatio-temporal complexity of developmental hematopoiesis. Importantly, it allows genetic engineering to introduce disease-relevant mutations. Using haemGx, we modeled the most common acute myeloid leukemia exclusive to infants (infAML), subtype t(7;12)(q36;p13), which arises in utero and is characterized by MNX1 overexpression. Here, we detail a method to define susceptibility to specific mutations that integrate phenotypic and transcriptional changes in the haemGx system and compares them with patient data. By proxy of our MNX1-overexpression haemGx, we show a pipeline from cell engineering to downstream analyses of leukemogenic potential. In particular, we focus on the clinical relevance of the model by integrating single-cell and/or bulk RNA sequencing from the haemGx platform with patient data to extract cellular composition and temporal placement of the putative CoO. This method is adaptable to the introduction of other oncogenic mutations, chromosomal rearrangements, or epigenetic modifications, as well as to chemical perturbations, including drug vulnerability and growth factor dependence. This flexibility allows for broad application across diverse disease contexts, enabling mechanistic dissection of how specific alterations disrupt early developmental trajectories with clinical relevance.
引言
Pediatric leukemias can exhibit age-specific genetic abnormalities that distinguish them from those in older patients. Age-specific features configure distinct biological properties of the lineages from which the malignancies arise—their cell of origin (CoO)1. In particular, identifying a CoO for infant leukemias (infAML) remains challenging. Leukemia initiation in utero2,3,4, is confounded by the spatio-temporal complexity of developmental hematopoiesis, which utilizes yolk sac (YS), aorta-gonad mesonephros (AGM), and fetal liver (FL) niches in a time-dependent manner for unique cell type specification (YS, AGM) and expansion/maturation (FL)5.
The identification of CoO has relied on the detection of leukemia-associated abnormalities (LAA), for example, cytogenetic aberrations or fusion genes in different hematopoietic compartments by fluorescence in situ hybridization (FISH) or polymerase-chain reaction (PCR)-based methods6. Functionally, the introduction of LAA in mice via transplantation of transduced hematopoietic cells or via germline genetic manipulation can confirm their leukemogenic potential by expansion of specific populations, albeit not always with complete recapitulation of clinical features7. The increasing availability of next-generation sequencing data has improved the characterization of transcriptional profiles and cellular compositions in both experimental models and patient samples8,9,10, allowing tracing potential CoO and understanding their trajectories. Advanced tools such as patient-derived organoids and induced pluripotent stem cell (iPSC) technology have allowed the investigation of LAA in physiologically relevant conditions to their origin, such as appropriate cellular backgrounds and/or supporting microenvironment11,12.
In infant forms, the identification of CoO is constrained by the availability of models that recapitulate the fetal environment in space and time, where CoO is likely to be found. Several pediatric abnormalities have been mapped to embryonic windows13,14, with direct evidence for t(8;21)/RUNX1-RUNX1T1 and t(7;12)/MNX1-ETV6 arising in utero15,16. The myeloproliferative disorder juvenile myelomonocytic leukemia (JMML) has been shown to arise from YS-specified erythro-myeloid progenitors (EMP) prior to FL colonization17. Similarly, the CoO for infant ALL harboring t(4;11)/KMT2A-AF4 was pinpointed at the FL lympho-myeloid primed progenitor (LMPP)18,19. Nevertheless, CoO discovery experiments are often performed by transplantation or ex vivo cultures, limiting the ability to simultaneously capture dynamic changes and supporting structures.
We recently used hemogenic gastruloids (haemGx) to model the rare form of infAML carrying t(7;12)(q36;p13)20, which results in ectopic MNX1 overexpression21. HaemGx is a scalable 3D model of developmental hematopoiesis derived from mouse embryonic stem cells (mESC), which achieves stepwise recapitulation of mesoderm formation, hemogenic endothelium (HE) specification, endothelial-to-hematopoietic transition (EHT), and hematopoietic progenitor emergence, in time-congruent YS-like and AGM-like niches20. The unique association of t(7;12) in infancy21,22, and the recent discovery of its antenatal origin16 are indicative of a development-stage-specific cell type underlying the leukemic effects of the translocation. In fact, MNX1 overexpression can transform FL but not adult hematopoietic cells23,24. Using haemGx, we placed its putative CoO at the HE-to-EMP transition, closely resembling transcriptional profiles observed in t(7;12) patient samples20.
Here, we describe an integrative approach to explore transcriptional profiles of LAA within an embryonic context using haemGx, with the overall goal of CoO discovery (Figure 1), based on our previous work on modeling t(7;12) AML in haemGx20. Protocol section 1 describes the use of engineered LAA in haemGx and downstream analyses to assess leukemogenic features, while protocol section 2 details an in silico method to infer the temporal placement of candidate CoO, comparing RNA sequencing from haemGx and patient data. This method is most suitable for the discovery of cell types involved in hematological malignancies with an embryonic component and has been optimized for use with mESC to ensure full compatibility with transcriptomic data.
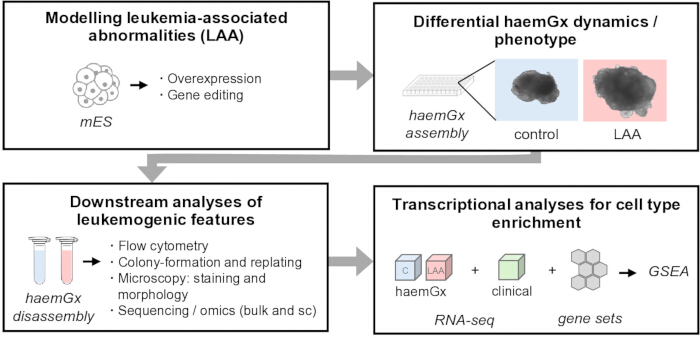
Figure 1: Overview of methodologies to be used for cell-of-origin discovery in leukemia by integrating haemGx phenotypic data with patient transcriptomics. This approach allows the engineering of leukemia-associated abnormalities in mESC to be investigated in a hemogenic gastruloid (haemGx) model via downstream molecular and bioinformatics analyses. Abbreviations: LAA = leukemia-associated abnormalities; mESC = mouse embryonic stem cells; haemGx = hemogenic gastruloid model; GSEA = gene set enrichment analysis. Please click here to view a larger version of this figure.
访问受限。请登录或开始试用以查看此内容。
方案
1. Use of engineered leukemia-associated abnormalities (LAA) in haemGx and downstream analyses to assess leukemogenic features
- Culturing mESC with LAA for haemGx aggregation
NOTE: mESC can be edited to introduce the LAA of interest by overexpression systems (here, using lentiviral transduction, MNX1 is overexpressed using a pWPT-LSSmOrange-PQR under the EF-1α promoter25), or gene editing approaches (e.g., CRISPR/Cas9 to introduce mutations). A control line (e.g., transduction by empty vector or Cas9-only control) is also generated. Various reporter lines can be used, for instance, Kdr(Flk1)-GFP26, Sox17-GFP27, or T/Bra-GFP28. It is strongly recommended to validate the LAA before proceeding; this can be achieved by qPCR and/or flow cytometry to assess overexpression (see example in Supplemental File 1 Supplemental Figure S1AB) or DNA sequencing for other genomic edits.- Coat tissue culture vessels with 0.1% gelatin in PBS for 10 min at room temperature (5 mL for a 25 cm2 flask).
- Prior to the addition of cells, discard all gelatin and add ES-LIF medium (500 mL of Glasgow MEM BHK-21, 50 mL of fetal bovine serum, 5 mL of glutamine supplement, 5 mL of MEM Non-Essential Amino Acids, 5 mL of sodium pyruvate solution (100 mM), and 1 mL of 2-Mercaptoethanol 50 mM). Murine Leukemia Inhibitory Factor (LIF) is added at 1,000 U/mL.
- Culture mESC at a density of 300,000 cells per T25 flask. Medium must be changed daily. When passaging, reseed the cells at the same density. Allow the cells to expand for at least two passages before using them for aggregation of haemGx. Once the culture reaches 60–80% confluency, prepare for aggregation.
NOTE: Appropriate maintenance and health of the mESC culture is crucial for haemGx assembly. Inspect cell culture under an inverted microscope daily to assess morphology and confluency. The culture should appear with compact, well-defined islands with smooth colony edges (Supplemental Figure S1C).
- Generation of haemGx from mESCs
- Culture haemGx in N2B27 medium (refer to Table 1 for recipe).
- Prewarm PBS containing Ca2⁺ and Mg2⁺, ES-LIF medium, N2B27, and Trypsin–EDTA in a 37 °C water bath before use.
- Remove the culture medium from the tissue culture flask and gently rinse the cells 2x with 5 mL of prewarmed PBS. Aspirate the PBS, then add 1 mL of prewarmed 0.25% Trypsin–EDTA to detach the cells. Incubate the flask at 37 °C for approximately 5 min or until the cells have completely detached from the surface. Gently pipette the suspension up and down with a 5 mL pipette to break up any remaining clumps.
- Add 5 mL of ES-LIF medium to neutralize the Trypsin–EDTA and gently rinse the culture surface to improve cell recovery. Transfer the cell suspension to a 15 mL centrifuge tube and spin at 400 × g for 5 min to pellet the cells.
- Carefully remove the supernatant and resuspend the pellet in 1 mL of ES-LIF medium. Mix thoroughly by pipetting to obtain a single cell suspension, then count the cells using Trypan blue and a hemocytometer.
NOTE: Cell viability must be at least 80%. - Prepare a working suspension at 10 cells/µL, which corresponds to 400 cells per well in a 40 µL droplet. Calculate the total number of cells required using this formula:
Total cells = number of wells × cells per well × 1.1
Where 1.1 accounts for a 10% excess to compensate for pipetting variability.
NOTE: This ensures sufficient volume and cell number for all wells while minimizing variation between aggregates. For 60 wells with 10% excess, this equals 2.64 × 10⁴ cells in 2.64 mL of N2B27 medium. - Transfer 2.64 × 10⁴ cells into 5 mL of prewarmed PBS in a clean 15 mL centrifuge tube and centrifuge at 400 × g for 5 min. Carefully aspirate the PBS without disturbing the cell pellet, then gently add another 5 mL of prewarmed PBS for a second wash. Disperse the pellet between the washes and centrifuge again at 400 × g for 5 min.
- Gently remove as much PBS as possible without disrupting the pellet. Resuspend the cells in 1 mL of warm N2B27 medium using a P1000 pipette to obtain a single cell suspension. Finally, add additional N2B27 to reach the required final volume (e.g., add 1.64 mL).
- Dispense 40 µL of the prepared cell suspension into each of the 60 inner wells of an ultra-low adherence U-bottom 96-well plate to initiate aggregation. To minimize evaporation and maintain consistent humidity across the plate, add approximately 150 µL of PBS to each of the outer wells. Cover the plate with the lid and verify the presence and even distribution of cells under a microscope. Following confirmation, incubate the plate for 48 h in a humidified incubator at 37 °C with 5% CO₂ to allow the cells to aggregate.
NOTE: The plate can be centrifuged briefly at this stage using a plate centrifuge to aid aggregation (400 × g for 3 min).
- Medium change and cytokine supplementation
NOTE: The medium is to be changed daily at the same time. Figure 2 depicts a schematic representation of the protocol. A detailed method for medium change for gastruloids in 96-well plates has been previously described29.- After 48 h, gently add 150 µL of fresh prewarmed N2B27 medium containing 100 ng/mL Activin A and 3 µM GSK3 inhibitor CHIR99021 to each well (this combination of Activin A + CHIR99021 is hereafter known as the AC pulse). Ensure the pipette tip contacts only the well wall, without disturbing the gastruloids.
- At 72 h, remove 150 µL of medium from each well to terminate the AC pulse. To avoid disturbing gastruloids, hold the pipette at approximately 30° near the bottom of the well and aspirate gently at ~50 µL/s.
- After removing the AC pulse, gently add 150 µL of fresh prewarmed N2B27 medium supplemented with VEGF and FGF2, each at a final concentration of 5 ng/mL, and incubate for an additional 24 h.
- At 96 h, remove 150 µL of medium from each well and replace it with 100 µL of fresh prewarmed N2B27 containing VEGF and FGF2 at the same concentrations as above.
- Continue the medium exchange process by removing 100 µL and adding 100 µL of N2B27 with VEGF and FGF2 per well every 24 h until 144 h.
- At 144 h, remove 100 µL of medium from each well and replace it with 100 µL of fresh N2B27 medium containing VEGF (5 ng/mL), FGF2 (5 ng/mL), and mSHH at a final concentration of 20 ng/mL.
- At 168 h, remove the mSHH-containing medium (100 µL per well) and replace it with 100 µL per well of prewarmed N2B27 supplemented with VEGF (5 ng/mL) and a cytokine cocktail consisting of mSCF (100 ng/mL), mTPO (20 ng/mL), and mFLT3L (100 ng/mL). Incubate for an additional 24 h, then repeat the same medium replacement at 192 h using the same cytokine cocktail.
- At 216 h, the protocol is complete; collect gastruloids for downstream analyses.
- Collection and dissociation of haemGx
NOTE: To enable detailed cellular and molecular analyses, gastruloids can be dissociated from their 3D structures into single-cell suspensions for downstream characterization at any time point. It is strongly recommended to confirm the persistence of the desired LAA until endpoint (e.g., by qPCR as shown in Supplemental Figure S1D).- Gently remove 100 µL of medium from each well using a single-channel pipette. Be sure not to disturb the gastruloids at the bottom of the wells.
- Using a P1000 pipette, transfer the remaining 100 µL of medium along with the gastruloid into a labelled 1.5 mL microcentrifuge tube. Allow the gastruloids to settle naturally at the bottom of the tube (1–2 min). Once settled, carefully remove the supernatant.
NOTE: Multiple gastruloids can be collected per tube. - Wash the sample by adding 1 mL of PBS (without Ca2⁺ or Mg2⁺) to remove residual medium.
- Centrifuge the tubes at 400 × g for 5 min at room temperature. Gently discard the PBS supernatant, leaving the gastruloid pellet untouched.
- Add 200 µL of prewarmed recombinant enzyme-based cell dissociation reagent. Ensure gastruloids are fully immersed in the solution. Place the tubes in a 37 °C water or pebble bath for 5 min to facilitate dissociation.
- After incubation, use a P200 pipette to vigorously pipette the sample up and down at least 10x to mechanically aid dissociation. Observe a small aliquot under the microscope to check for single-cell suspension. If large clumps remain, repeat the incubation step once more for 2–3 min and pipette again.
- Add 300 µL of ES-LIF medium to each tube to neutralize the cell dissociation reagent. Pipette up and down several times to ensure all cells are detached and there are no clumps.
- Centrifuge again at 400 × g for 5 min. Carefully discard the supernatant to remove residual enzyme and debris.
- Gently resuspend the resulting cell pellet in 200–1,000 µL of ES-LIF medium, depending on the pellet size and intended downstream applications.
- Downstream analysis: Colony forming and replating assay
NOTE: Optimal seeding concentrations need to be determined empirically, as haemGx cells may have different colony-forming capacity at the first plating. However, untransformed cells cannot replate indefinitely, and differences between conditions can be discerned at later replating (P3–5).- Plating on methylcellulose
- Thaw a prealiquoted 3 mL tube of methylcellulose (Mouse Methylcellulose Complete Media) on ice. Once fully thawed, vortex thoroughly to ensure the medium is well mixed, given the high viscosity of methylcellulose. Use the top speed setting for 1–3 periods of 5 s; adjust timings and repeats empirically. As vortexing introduces air bubbles, allow the methylcellulose to rest at room temperature until the bubbles dissipate completely.
NOTE: Ensure that the entire volume of the aliquot is being mixed; angle the tube while vortexing to check that the methylcellulose medium at the bottom/tip of the tube is also being mixed. Thorough mixing is critical to achieve uniform growth factor concentrations. - Meanwhile, prepare the gastruloid single-cell suspension for the colony-forming assay. Ensure that a total of 100,000 cells (or empirically determined optimal concentration) is resuspended in 300 µL of N2B27 medium.
- Once the methylcellulose is free of bubbles, carefully add the 300 µL cell suspension to the 3 mL of methylcellulose using a P1000 pipette. Dispense slowly into the methylcellulose medium immediately below the meniscus to minimize additional bubble formation; do not pipette to mix. Vortex the mixture thoroughly to achieve a uniform distribution of cells within the methylcellulose.
- Allow the methylcellulose medium to rest on ice for at least 5 min to eliminate any remaining bubbles. After debubbling, plate the medium into two wells of a 6-well plate by dispensing half the volume, typically 1.3–1.5 mL per well (corresponding to 50,000 cells per well), using a 5 mL serological pipette and pipettor.
NOTE: Make sure that the methylcellulose is aspirated and dispensed slowly using the low-speed setting on the pipettor and a continuous flow. - Add sterile PBS to the surrounding empty wells to maintain humidity and prevent drying. Incubate the plate at 37 °C with 5% CO₂ for 7–10 days before colony scoring.
- After 7–10 days of incubation, image the plates and score the colonies. To calculate colony-formation capacity (frequency), calculate the number of colonies/number of cells seeded.
NOTE: haemGx produce heterogeneous colonies encompassing hematopoietic and non-hematopoietic cells. Standard scoring of hematopoietic colonies can be used at late time points (192–216 h); however, earlier progenitor-like cells may produce undefined morphologies30. - Score total colony numbers in preliminary analyses and focus on the morphology of late replating colonies at later stages. Adjust colony scoring criteria empirically, but define a colony as having at least 50 cells.
NOTE: It is important for individual users to keep qualitative and quantitative scoring criteria constant. At different steps of the protocol, colonies are scored independently and blindly by a second observer to ensure consistency and reproducibility of results. Qualitative colony scoring is checked against cell morphology in cytospins (see below).
- Thaw a prealiquoted 3 mL tube of methylcellulose (Mouse Methylcellulose Complete Media) on ice. Once fully thawed, vortex thoroughly to ensure the medium is well mixed, given the high viscosity of methylcellulose. Use the top speed setting for 1–3 periods of 5 s; adjust timings and repeats empirically. As vortexing introduces air bubbles, allow the methylcellulose to rest at room temperature until the bubbles dissipate completely.
- Colony replating
- Prewarm PBS to room temperature and add 1.5 mL to each well. Gently resuspend the methylcellulose by slowly pipetting up and down using a P1000 pipette set to 500 µL. Avoid foaming up the medium.
- Once the methylcellulose has been fully dispersed with no visible clumps remaining, transfer the entire contents of each well into a 15 mL conical tube. Rinse the same well with an additional 1.5 mL of PBS to collect any remaining cells and pipette slowly to resuspend the remaining methylcellulose; add this suspension to the same tube. Perform a final rinse with 500 µL of PBS to recover residual cells and pool with the previous washes.
- Centrifuge the collected suspension at 400 × g for 5 min at room temperature to pellet the cells. Carefully aspirate the supernatant, then wash the pellet with 5 mL of PBS to remove any remaining methylcellulose.
- Centrifuge again under the same conditions (400 × g for 5 min). Discard the supernatant and resuspend the final cell pellet in 200–1000 µL of N2B27 culture medium (volume adjusted based on pellet size).
- Count viable cells using a hemocytometer.
- Replate the cells by following the same colony-forming assay preparation protocol described in Steps 1.5.1.1–1.5.1.5. Continue serial replating as required to assess colony-forming potential over successive generations.
- Dissociate colonies into cell suspensions at the desired endpoint as described in step 1.5.1 and subject them to downstream characterization, including cytospin preparations and Giemsa Wright staining for detailed cellular morphology (described in detail elsewhere31).
NOTE: In summary, section 1 describes the generation of haemGx that harbor LAA. Once the resulting phenotype is assessed in vitro, the transcriptomes of these cells are analyzed using a computational approach. Gene expression signatures derived from the haemGx model can be compared with bulk transcriptomic datasets from leukemia patients to understand phenotypic similarities. Using Gene Set Enrichment Analysis (GSEA), these signatures are mapped with known populations across differentiation time points to infer a temporal window of susceptibility to the LAA (section 2).
- Plating on methylcellulose

Figure 2: Timeline of haemGx protocol. Schematic representation of the generation of haemGx production from mESC cells over a 216 h protocol, highlighting the addition of an A/C pulse at 48 h, followed by the specific chemical cues of cytokines from 144 h to 216 h to promote the specification for hemato-endothelium. Abbreviations: mESC = mouse embryonic stem cells; haemGx = hemogenic gastruloid model. Please click here to view a larger version of this figure.
2. In silico method to infer the temporal placement of candidate CoO, comparing RNA-seq from haemGx and patient data
- Cell type mapping of bulk patient transcriptomic data using GSEA
NOTE: This analysis allows the mapping of cell types that are overrepresented in bulk RNA-seq data of specific patient subtypes compared to other classes using Gene Set Enrichment Analysis (GSEA)32. GSEA requires specific normalized units for RNA-sequencing data: https://docs.gsea-msigdb.org/#GSEA/GSEA_and_RNA-Seq/.- Download patient data from the appropriate repository, for example, TARGET data for pediatric acute myeloid leukemia (AML).
NOTE: TARGET data are accessible from multiple sources: UCSC Xena Browser: https://xenabrowser.net/datapages/33, cBioPortal https://www.cbioportal.org/datasets34, GDC Data Portal https://portal.gdc.cancer.gov/35 - Download clinical data and RNA-sequencing data in TPM or normalized counts to be compatible with GSEA (Supplemental Figure S2). For TARGET-AML, download TPM data and clinical data to identify the desired cohort. Select the patients to be included in the analysis making use of phenotype and clinical annotations (e.g., see example for cBioPortal, Supplemental Figure S3).
- Download cell type gene sets. Gene sets in a compatible format for GSEA are available from EnrichR36: https://maayanlab.cloud/Enrichr/#libraries. Download PanglaoAugmented 202137 for cell type gene sets, also available from PanglaoDB: https://panglaodb.se/index.htmL.
- Download and install GSEA software: https://www.gsea-msigdb.org/gsea/downloads.jsp.
- Prepare files for GSEA software using a custom gene set.
NOTE: This analysis can also be run using GSEA’s inbuilt signature collection MSigDB (https://www.gsea-msigdb.org/gsea/msigdb/index.jsp) for further biological insights. - Prepare the files required for GSEA according to the template (Supplemental Figure S4), populated in spreadsheets and saved as .txt files. Change the file extension to .gct, .cls, or .gmt accordingly:
.gct file: expression file with samples, genes, and expression values
.cls file: phenotype labels matching the .gct file; contains the classes/phenotypes to be compared.
.gmt file: gene set file containing gene set names and corresponding genes defining each set.
NOTE: Different gene nomenclatures can be used. Gene symbols often contain duplicated values that can affect results. Ensembl identifiers are preferred. - Upload all files into GSEA. Select Load Data | Method 1 | Browse for Files…
- Run GSEA to compare two phenotype classes.
- Select Run GSEA. Populate the required fields.
- Expression dataset: select the file containing counts for desired samples.
- Gene set database: select the gene sets to compute (e.g., PanglaoAugmented 2021).
- Number of permutations: 1,000 is the default (range: 1,000–10,000 for higher statistical resolution).
- Phenotype labels: select the .cls file containing phenotype labels for the categories to compare.
- Collapse/Remap to gene symbols: Depending on the format of the .gct file, select whether to remap gene identifiers to gene symbols to match gene set file (.gmt). Choose from three options:
- Collapse: if multiple gene identifiers map to the same gene symbol, GSEA will collapse them into a single gene by its maximum expression value. To be used for microarray datasets with probe IDs.
- Remap-only: converts gene identifiers without collapsing duplicates (i.e., gene identifiers in .gct do not match identifiers in .gmt).
- No collapse: does not convert gene identifiers (i.e., gene identifiers match identifiers in .gmt).
- Permutation type: phenotype (shuffles phenotype labels to compute gene statistics) or gene set (randomly reassigns genes in each set to compute probability of gene membership). Gene set is recommended for RNA-seq data, if fewer replicates are available (≤4) and to minimize phenotype variability.
- Chip platform: select the ID type of genes in the .gct file.
- Populate the basic fields.
Metric for ranking genes: for categorical classification (not continuous), choose Signal2Noise, tTest, (log2)Ratio_of_classes, or Diff_of_classes depending on data types. For RNA-seq data, choose Ratio_of_classes (absolute fold change between classes) or log2_Ratio_of_classes (relative fold change between classes).
NOTE: Parameters are adjustable depending on specific needs and data type. Refer to GSEA website for details. - Select Run. The status of the analysis is reported in the GSEA reports box. Once complete, click on COMPLETE to directly open the summary of the analysis. The full analysis is saved locally in the specified folder.
- To retrieve results and analysis, open the index file (index.html) to view a summary of results. Individual enrichments of gene sets with enrichment curves are also generated. To extract the leading edge (or core enriched genes that account for the enriched set), select all genes marked by “Yes” in the “core enriched” column for each gene set (access via index.html | Detailed enrichment results in html format | GS Details | Table: GSEA details)
NOTE: Additional downstream analysis of enriched genes in the leading edge can be conducted by gene ontology / term enrichment analysis (e.g., via EnrichR). - Visualization
Find gsea_report_*.tsv files for each phenotype in the folder to export results for graphical analysis.
- Download patient data from the appropriate repository, for example, TARGET data for pediatric acute myeloid leukemia (AML).
- Inference of differential cell type representation by timepoint in haemGx differentiation
NOTE: This analysis enables mapping bulk RNA-seq data from disease-modeled haemGx or patient samples onto a temporally resolved atlas of haemGx differentiation, with the aim of pinpointing differentially enriched cellular populations at specific developmental time points.- Retrieve bulk RNA-seq data from public databases (see 2.1.1 for TARGET AML) or RNA-seq sequenced at desired timepoints in (e.g. haemGx-MNX1 vs haemGx-EV at endpoint 216 h). Units must be compatible with GSEA (see 2.1.1).
- Retrieve cluster classifiers for normal haemGx differentiation protocol20 at specific timepoints from https://github.com/deniseragusa/haemGx-CoO/releases/tag/v1to be used as custom gene sets (.gmt).
NOTE: The haemGx classifier list was derived from single-cell RNA-seq of normal haemGx differentiation protocol and represent time-point resolved populations in haemGx. Ortholog mapping was applied using BioMart to be compatible in human / mouse comparisons. However, exact species matching is still limited by inherent differences in developmental processes between mouse and human. - Run GSEA and retrieve results as step 2.1.1.
- Visualization. A time-resolved UMAP image is available at https://github.com/deniseragusa/haemGx-CoO/releases/tag/v1 for visualization of cluster mapping.
访问受限。请登录或开始试用以查看此内容。
结果
We used haemGx to model the most common infAML subtype, t(7;12)(q36;p13), via MNX1 overexpression as a proxy, and to infer the developmental window of susceptibility and its clinical relevance to patient transcriptomics using GSEA.
To introduce LAA, we used lentiviral transduction to introduce MNX1 overexpression with the pWPT-LSSmOrange-MNX1-OE-PQR vector to overexpress MNX1 (mESC-MNX1) (Supplemental File 1 Supplemental Figure S1AB) and use...
访问受限。请登录或开始试用以查看此内容。
讨论
This protocol is amenable to model a variety of LAA that can be investigated in the context of embryonic hematopoietic development, with the advantage of spatio-temporal resolution and compatibility with established downstream molecular, functional, and biochemical analyses. Here, we focused on gastruloids that recapitulate hemato-endothelial specification to YS-like EMP and AGM-like HSPC emergence; however, other gastruloid / developmental organoid models that recapitulate specification of different tissues and organs c...
访问受限。请登录或开始试用以查看此内容。
披露
Authors have no conflicts of interest to declare.
致谢
DR was funded by the Little Princess Trust through the Children’s Cancer and Leukaemia Group CCLGA (CCLGA 2023 22 Pina) to CP, and NC3Rs - National Centre for Replacement, Reduction and Refinement of Animals in Research (NC/Z500677/1) to CP and Victor Hernandez-Hernandez. DR is the recipient of a European Hematology Association (EHA)-EMBL/EBI Computational Biology Training in Hematology (CBTH) award (CBTH39). AJ is funded by a Lady Tata Memorial Trust Scholarship (2022-2025) and Brunel University of London.
访问受限。请登录或开始试用以查看此内容。
材料
| 姓名 | 公司 | 目录编号 | 评论 |
|---|---|---|---|
| Activin A Plus | Qkine | Cat. #QK005 | Peptide, recombinant protein |
| B-27 Supplement (50x), serum free | Thermo Fisher Scientific | Cat. #17504044 | Medium supplement |
| CHIR99021 (Chiron) | BioGems | Cat. #2520691 | Peptide, recombinant protein |
| Gibco 2-Mercaptoethanol (50 mM) | Fisher Scientific | Cat. #11528926 | Reducing agent |
| Gibco DMEM/F-12, with GlutaMAX | Fisher Scientific | Cat. #10565018 | Medium |
| Gibco Glasgow's MEM | Fisher Scientific | Cat. #11570576 | Medium |
| Gibco Glutamax | Fisher Scientific | Cat. #35050038 | Medium Supplement |
| Gibco Neurobasal Medium | Thermo Fisher Scientific | Cat. #21103049 | Medium |
| Mouse Methylcellulose Complete Medium | R&D Systems | Cat. #HSC007 | Medium |
| Murine FGF-basic | PeproTech | Cat. #450-33 | Peptide, recombinant protein |
| Murine Flt3-Ligand | PeproTech | Cat. #250-31L | Peptide, recombinant protein |
| Murine LIF | PeproTech | Cat. #250-02 | Peptide, recombinant protein |
| Murine SCF | PeproTech | Cat. #250-03 | Peptide, recombinant protein |
| Murine Sonic Hedgehog (Shh) | PeproTech | Cat. #315-22 | Peptide, recombinant protein |
| Murine TPO | PeproTech | Cat. #315-14 | Peptide, recombinant protein |
| Murine VEGF165 | PeproTech | Cat. #450-32 | Peptide, recombinant protein |
| N-2 Supplement (100x) | Thermo Fisher Scientific | Cat. #17502048 | Medium supplement |
参考文献
- Bolouri, H., et al. The molecular landscape of pediatric acute myeloid leukemia reveals recurrent structural alterations and age-specific mutational interactions. Nat Med. 24 (1), 103-112 (2018).
- Cazzola, A., et al. Prenatal origin of pediatric leukemia: lessons from hematopoietic development. Front Cell Dev Biol. 8, 618164(2021).
- Greaves, M. F., Maia, A. T., Wiemels, J. L., Ford, A. M. Leukemia in twins: lessons in natural history. Blood. 102 (7), 2321-2333 (2003).
- MacMahon, B., Levy, M. A. Prenatal origin of childhood leukemia: evidence from twins. N Engl J Med. 270, 1082-1085 (1964).
- Sánchez-Lanzas, R., Jiménez-Pompa, A., Ganuza, M. The evolving hematopoietic niche during development. Front Mol Biosci. 11, 1488199(2024).
- Chopra, M., Bohlander, S. K. The cell of origin and the leukemia stem cell in acute myeloid leukemia. Genes Chromosomes Cancer. 58 (12), 850-858 (2019).
- Milne, T. A. Mouse models of MLL leukemia: recapitulating the human disease. Blood. 129 (16), 2217-2223 (2017).
- De Bie, J., et al. Single-cell sequencing reveals the origin and the order of mutation acquisition in T-cell acute lymphoblastic leukemia. Leukemia. 32 (6), 1358-1369 (2018).
- Li, Z., et al. The epigenetic state of the cell of origin defines mechanisms of leukemogenesis. Leukemia. 39 (1), 87-97 (2025).
- Bairakdar, M. D., et al. Learning the cellular origins across cancers using single-cell chromatin landscapes. Nat Commun. 16 (1), 8301(2025).
- Frenz-Wiessner, S., et al. Generation of complex bone marrow organoids from human induced pluripotent stem cells. Nat Methods. 21 (5), 868-881 (2024).
- Bourgine, P. E. Human bone marrow organoids: emerging progress but persisting challenges. Trends Biotechnol. 44, 11-21 (2025).
- Duguid, A., Mattiucci, D., Ottersbach, K. Infant leukaemia-faithful models, cell of origin and the niche. Dis Model Mech. 14 (10), dmm049189(2021).
- Mercher, T., Schwaller, J. Pediatric acute myeloid leukemia (AML): from genes to models toward targeted therapeutic intervention. Front Pediatr. 7, 405(2019).
- Wiemels, J. L., et al. In utero origin of t(8;21) AML1-ETO translocations in childhood acute myeloid leukemia. Blood. 99 (10), 3801-3805 (2002).
- Bousquets-Muñoz, P., et al. Backtracking NOM1::ETV6 fusion to neonatal pathogenesis of t(7;12)(q36;p13) infant AML. Leukemia. 38 (8), 1808-1812 (2024).
- Tarnawsky, S. P., Yoshimoto, M., Deng, L., Chan, R. J., Yoder, M. C. Yolk sac erythromyeloid progenitors expressing gain of function PTPN11 have functional features of JMML but are not sufficient to cause disease in mice. Dev Dyn. 246 (12), 1001-1014 (2017).
- Malouf, C., Ottersbach, K. The fetal liver lymphoid-primed multipotent progenitor provides the prerequisites for the initiation of t(4;11) MLL-AF4 infant leukemia. Haematologica. 103 (12), e571(2018).
- Malouf, C., et al. miR-130b and miR-128a are essential lineage-specific codrivers of t(4;11) MLL-AF4 acute leukemia. Blood. 138 (21), 2066-2092 (2021).
- Ragusa, D., et al. Dissecting infant leukemia developmental origins with a hemogenic gastruloid model. eLife. 14, RP102324(2025).
- Ragusa, D., Dijkhuis, L., Pina, C., Tosi, S. Mechanisms associated with t(7;12) acute myeloid leukaemia: from genetics to potential treatment targets. Biosci Rep. 43 (1), BSR20220489(2023).
- Espersen, A. D. L., et al. Acute myeloid leukemia (AML) with t(7;12)(q36;p13) is associated with infancy and trisomy 19: data from Nordic Society for Pediatric Hematology and Oncology (NOPHO-AML) and review of the literature. Genes Chromosomes Cancer. 57 (7), 359-365 (2018).
- Ragusa, D., et al. Engineered model of t(7;12)(q36;p13) AML recapitulates patient-specific features and gene expression profiles. Oncogenesis. 11 (1), 50(2022).
- Waraky, A., et al. Aberrant MNX1 expression associated with t(7;12)(q36;p13) pediatric acute myeloid leukemia induces the disease through altering histone methylation. Haematologica. 109 (3), 725(2023).
- Dalby, A., et al. Transcription factor levels after forward programming of human pluripotent stem cells with GATA1, FLI1, and TAL1 determine megakaryocyte versus erythroid cell fate decision. Stem Cell Rep. 11 (6), 1462-1478 (2018).
- Jakobsson, L., et al. Endothelial cells dynamically compete for the tip cell position during angiogenic sprouting. Nat Cell Biol. 12 (10), 943-953 (2010).
- Niakan, K. K., et al. Sox17 promotes differentiation in mouse embryonic stem cells by directly regulating extraembryonic gene expression and indirectly antagonizing self-renewal. Genes Dev. 24 (3), 312-326 (2010).
- Fehling, H., et al. Tracking mesoderm induction and its specification to the hemangioblast during embryonic stem cell differentiation. Development. 130 (17), 4217-4227 (2003).
- Baillie-Johnson, P., van den Brink, S. C., Balayo, T., Turner, D. A., Arias, A. M. Generation of aggregates of mouse embryonic stem cells that show symmetry breaking, polarization and emergent collective behaviour in vitro. J Vis Exp. (105), e53252(2015).
- Miller, C. L., Lai, B. Human and mouse hematopoietic colony-forming cell assays. Basic Cell Culture Protocols. , Humana Press. 71-89 (2005).
- Sarma, N. J., Takeda, A., Yaseen, N. R. Colony forming cell (CFC) assay for human hematopoietic cells. J Vis Exp. (46), e2195(2010).
- Subramanian, A., et al. Gene set enrichment analysis: a knowledge-based approach for interpreting genome-wide expression profiles. Proc Natl Acad Sci U S A. 102 (43), 15545-15550 (2005).
- Goldman, M. J., et al. Visualizing and interpreting cancer genomics data via the Xena platform. Nat Biotechnol. 38 (6), 675-678 (2020).
- De Bruijn, I., et al. Analysis and visualization of longitudinal genomic and clinical data from the AACR project GENIE biopharma collaborative in cBioPortal. Cancer Res. 83 (23), 3861-3867 (2023).
- Heath, A. P., et al. The NCI genomic data commons. Nat Genet. 53 (3), 257-262 (2021).
- Xie, Z., et al. Gene set knowledge discovery with Enrichr. Curr Protoc. 1 (3), e90(2021).
- Franzén, O., Gan, L. -M., Björkegren, J. L. M. PanglaoDB: a web server for exploration of mouse and human single-cell RNA sequencing data. Database (Oxford). 2019, baz046(2019).
访问受限。请登录或开始试用以查看此内容。
重印与许可
