This protocol integrates methylation arrays, immunohistochemistry, and transcript quantification to evaluate androgen receptor regulation in prostate cancer. The approach establishes a reproducible workflow that links molecular profiles to clinical outcomes, supporting biomarker-guided stratification and personalized therapeutic strategies.
研究文章
Correlation Between Androgen Receptor Expression and Prognosis in Prostate Cancer Patients: A Retrospective Study
本文内容
摘要
摘要
Metastatic prostate cancer (PC) initially responds to androgen deprivation therapy (ADT) but often progresses to castration-resistant prostate cancer (CRPC). Androgen receptor (AR) expression, partly regulated by promoter-associated CpG methylation, plays a pivotal role in disease progression and therapeutic resistance. In this study, 146 formalin-fixed, paraffin-embedded (FFPE) prostate-related tissue specimens representing five disease states—non-malignant prostate tissue, primary localized PC, hormone-naïve bone metastases, short-term castration metastases, and CRPC bone metastases—were evaluated. Genome-wide promoter methylation was profiled, and AR expression was quantified at transcript and protein levels. Nuclear AR H-score (0–300) was used as the principal protein-level measure. AR H-score differed across clinical states (one-way ANOVA, F = 13.72, p < 0.001). Using the cohort median promoter-methylation beta value (0.51195) as the binary cutpoint, the distribution of low versus high methylation did not differ significantly across the five clinical groups (χ2 = 8.42, df = 4, p = 0.077), whereas continuous promoter methylation was inversely correlated with AR H-score (r = -0.480, 95% CI -0.596 to -0.344, p < 0.001). Among the 134 malignant cases included in survival analyses, the AR-high stratum showed longer observed median PFS and OS than the AR-low stratum, while the MCA Kaplan-Meier curves showed substantial overlap. Accordingly, the data support stage-related AR remodeling and an inverse AR–methylation relationship, but do not establish a simple adverse-prognostic effect of high AR expression. The MCA remains exploratory and requires independent validation.
引言
Prostate cancer is one of the most common malignancies among men worldwide and remains a leading cause of cancer-related mortality1. The disease demonstrates substantial heterogeneity, ranging from indolent, localized lesions to highly aggressive metastatic forms2. Androgen signaling is central to the initiation and progression of prostate cancer, with the androgen receptor (AR) acting as a key transcription factor that regulates tumor growth and therapeutic response3. Androgen deprivation therapy (ADT) is the cornerstone of treatment for advanced disease and initially produces tumor regression in most patients4. Representative androgen-axis intervention points and contemporary AR-targeted treatment strategies are summarized in Figure 15,6. However, responses vary widely, and many cases ultimately progress to castration-resistant prostate cancer (CRPC)7. This clinical challenge highlights the need for biomarkers that can refine prognosis and, when supported by treatment-interaction evidence, predict differential benefit from a specific therapy.
AR expression has been proposed as a potential prognostic biomarker, but its clinical significance remains incompletely defined. Prior studies suggest that high AR levels may be associated with either favorable or adverse outcomes depending on disease context, tumor subtype, or treatment setting8,9. Moreover, emerging evidence indicates that epigenetic regulation, particularly promoter-associated CpG methylation, plays an important role in controlling AR expression and may contribute to therapy resistance10. Despite these insights, the combined prognostic value of AR expression and methylation status in prostate cancer has not been systematically characterized across different clinical stages11.
Biomarker terminology is used here according to clinical purpose. Diagnostic biomarkers identify the presence or characteristics of disease; prognostic biomarkers estimate the likelihood of a clinical outcome irrespective of a specific treatment; and predictive biomarkers identify differential likelihood of benefit or harm from a particular intervention12. In prostate cancer, prostate-specific antigen (PSA)-based and urine-based assays are used mainly for detection or risk assessment, whereas circulating tumor DNA (ctDNA), circulating tumor cells (CTCs), systemic inflammatory indices such as the neutrophil-to-lymphocyte ratio (NLR) and platelet-to-lymphocyte ratio (PLR), and tissue genomic classifiers have shown associations with metastasis, progression-free survival (PFS), overall survival (OS), or prostate cancer-specific mortality13,14,15,16. In the present study, AR expression and the AR Methylation Classifier (MCA) are evaluated as prognostic biomarkers because their associations are tested against PFS and OS without a biomarker-by-treatment interaction design; treatment-predictive utility is therefore not claimed.
The present study addresses this gap by integrating genome-wide promoter methylation profiles with AR expression data in prostate cancer tissues spanning non-malignant, localized, metastatic, and castration-resistant states17,18. By linking molecular alterations to clinical outcomes, the study aimed to define AR-related molecular subtypes, evaluate their relevance as prognostic biomarkers, and establish a reproducible analytical framework for biomarker development.
方案
All procedures involving human tissue were conducted in accordance with institutional ethical standards and the Declaration of Helsinki and were approved by the Institutional Review Board of Jinhua Municipal Hospital (approval no. 2026Y-24). Written informed consent was obtained from all participants before specimen collection and use of clinical data.
Study design, cohort assembly, and clinical grouping
This retrospective, single-center analytic cohort comprised 146 FFPE prostate-related specimens from patients evaluated through the Department of Urology, Jinhua Municipal Hospital. The cohort was assembled as a selected retrospective analytic series from archived specimens meeting prespecified tissue and data-availability criteria. Specimen-collection dates and a separate screening log were not available in the retrospective study records; therefore, an exact calendar study period and an independent screened/excluded denominator could not be reported, and the cohort is not described as a consecutive series. Eligible specimens had histologically verified target tissue, an assignable clinical disease state, sufficient evaluable tissue for the planned molecular assays, and linked clinicopathologic data. Specimens with extensive necrosis or hemorrhage, insufficient target tissue, or inadequate data for the planned analysis were excluded before construction of the final analytic file. The final analytic dataset contained non-malignant prostate tissue (n = 12), primary localized malignancy (n = 12), hormone-naïve bone metastases (HNBM; n = 14), short-term castration metastases (STCM; n = 4), and CRPC bone metastases (n = 104). Complete methylation, AR transcript, and IHC H-score fields were available for all 146 specimens; 134 malignant cases entered the survival analyses. STCM was operationally defined as a bone-metastasis specimen obtained after a brief 1–3-day period of androgen-ablation therapy and before development of castration-resistant progression. This short interval was used to capture the acute biological response to androgen withdrawal before longer-term adaptive or castration-resistant remodeling, consistent with the source disease-state framework19. Tissue origin was recorded explicitly: the non-malignant and localized malignant samples were prostate-derived, whereas the HNBM, STCM, and CRPC samples were derived from bone-metastatic lesions. No lymph-node or visceral-metastasis tissue was included as the analyzed molecular tissue source. Baseline characteristics are summarized in Table 1, measured variables and data sources are summarized in Table 2. The overall analytical flow is shown in Figure 2. For data provenance, all analyses were performed on the de-identified 146-record study dataset, and no external patient-level records were incorporated. Previously published or publicly available datasets cited in the manuscript were used only as methodological and contextual references and were not merged into the study dataset.
Specimen selection and sectioning
For each tissue block, a hematoxylin-eosin (H&E)-stained reference section was reviewed to identify the intended tissue compartment and a representative region for molecular analysis. Serial 5 µm sections corresponding to the reviewed region were then collected for nucleic-acid extraction; when substantial non-target tissue was present, the annotated target area was macrodissected before transfer to the extraction tube rather than using an unselected whole-block ribbon. Non-malignant and malignant regions from prostate specimens were handled separately. For metastatic cases, only the histologically confirmed bone-metastatic focus was sampled. Sections with extensive necrosis, hemorrhage, or insufficient evaluable target tissue were not selected for molecular analysis. This tissue-selection step was used to minimize dilution of tumor-associated methylation and expression signals by unrelated surrounding tissue.
DNA extraction, bisulfite conversion, and methylation profiling
Genomic DNA was isolated from pathologist-reviewed, target-enriched FFPE sections using an FFPE-compatible DNA extraction workflow; the details are provided in the Table of Materials. DNA quantity and purity were assessed before bisulfite conversion. DNA input ranged from 180.0 to 864.1 ng, A260/280 ranged from 1.64 to 2.01, bisulfite-conversion QC ranged from 0.920 to 1.000, and all 146 samples passed sample-level QC. For the present protocol, sample-level acceptance was operationally defined as A260/280 within 1.60–2.10, bisulfite-conversion QC ≥ 0.90, and acceptable built-in array-control performance; 146/146 samples met these criteria. The number of probes failing the per-sample detection criterion before filtering ranged from 1 to 1,788. Methylation profiling and preprocessing followed established Infinium workflows19,20,21. Probes with detection p > 0.05 in any sample were excluded, together with cross-reactive probes, probes mapped to methylation quantitative trait loci, and probes located within 5 bp of common single-nucleotide polymorphisms, in accordance with the cited EPIC-array filtering framework. Quantile normalization was applied before downstream comparisons, and methylation was represented as beta-values from 0 (unmethylated) to 1 (fully methylated). GRCh37/hg19 was used for genomic coordinate annotation. Promoter-focused analyses included TSS1500 (200–1500 bp upstream of the transcription start site), TSS200 (within 200 bp upstream of the transcription start site), and the 5′ untranslated region (5′ UTR). Consistent with the source MCA workflow, the promoter-focused filtered feature space comprised 121,944 CpG sites. Batch structure was assessed before downstream analysis, and no additional post-hoc batch-correction term was applied in the final analysis. No sample-level assay failure was present in the final dataset, and the final sample-level methylation dataset used for the present analyses contained 146 specimens.
AR transcript quantification
For transcript-level analysis, total RNA was extracted from deparaffinized FFPE sections using an FFPE-compatible RNA extraction workflow with DNase treatment, and RNA was reverse-transcribed to cDNA. Androgen receptor (AR) and glyceraldehyde-3-phosphate dehydrogenase (GAPDH) transcripts were quantified by real-time PCR in technical triplicate. RNA input ranged from 95.0 to 698.6 ng. Reactions used a 20 µL volume with 50 °C for 2 min and 95 °C for 10 min, followed by 40 cycles of 95 °C for 15 s and 60 °C for 1 min. Cycle threshold (Ct) denotes the amplification cycle at which fluorescence crosses the predefined detection threshold. Relative AR expression was calculated using the comparative Ct (2^-ΔΔCt) method22. GAPDH served as the endogenous control, and the mean ΔCt of the non-malignant prostate group was used as the biological calibrator. A 2 µL cDNA template input was specified for each 20 µL qPCR reaction. Assay performance was considered acceptable at 90–110% amplification efficiency with a standard-curve R2 ≥ 0.98; runs outside this range were repeated. Replicate Ct standard deviation ranged from 0.030 to 0.429; replicates with Ct SD > 0.5 were repeated, and persistent replicate failure was prespecified to result in sample exclusion. No final sample exceeded the 0.5 replicate-SD rule. No-template and no-reverse-transcription controls were included in each analytical batch. Specific reagent, assay, and instrument details are provided in the Table of Materials.
AR immunohistochemistry and scoring
For protein-level analysis, 4–5 µm serial FFPE sections were prepared, deparaffinized, rehydrated, and subjected to heat-induced epitope retrieval in high-pH Tris-EDTA buffer at 97 °C for 20 min. After cooling, sections were washed with the detection-system wash buffer and endogenous peroxidase activity was blocked for 5 min. A rabbit monoclonal anti-androgen receptor antibody, clone EPR1535(2), was used at a 1 : 500 dilution and incubated for 30 min at room temperature; full manufacturer and catalog information is provided in the Table of Materials. After washing, a horseradish peroxidase (HRP) polymer detection reagent was applied for 20 min, followed by 3,3′-diaminobenzidine (DAB) chromogen development for 10 min and hematoxylin counterstaining. Known AR-positive prostate tissue and omission of the primary antibody served as positive and negative controls, respectively. Nuclear AR staining was scored independently by two observers who were blinded to clinical group and survival outcome, using an H-score calculated as the sum of staining intensity (0–3) multiplied by the percentage of positive epithelial/tumor cells, yielding a 0–300 scale. An absolute difference of ≥20 H-score points between observers was used as the prespecified disagreement threshold and triggered joint review to obtain a consensus score. H-score was used as the principal protein-level AR measurement in Tables 3–9 and in the survival models; percentage-positive nuclei was retained only as a secondary descriptive readout. The cohort median H-score of 177.05 was used to define AR-high and AR-low categories. Individual pre-adjudication observer scores were not retained in the study records available for analysis; therefore, an interobserver agreement coefficient could not be calculated from the consensus H-scores.
Clinical outcomes and data integration
Clinical, pathologic, treatment, and survival endpoints were integrated with the molecular readouts to enable stage-aware analyses of AR regulation and prognosis. Survival analyses included 134 malignant cases: primary localized disease (n = 12), HNBM (n = 14), STCM (n = 4), and CRPC (n = 104); the 12 non-malignant controls were not included. Progression-free survival (PFS) was measured from the index treatment date—definitive local treatment for localized disease and initiation of systemic treatment for metastatic disease—to the first documented biochemical, radiographic, or clinical progression or death, whichever occurred first. Overall survival (OS) was measured from the same index date to death from any cause. Patients without an event were censored at the last documented follow-up. Among the 134 malignant cases, there were 110 PFS events and 87 deaths: localized disease, 6 PFS events/5 deaths; HNBM, 11/12; STCM, 2/4; and CRPC, 91/66. Median follow-up was 52.82 months overall and 90.36, 66.47, 65.50, and 47.82 months for localized disease, HNBM, STCM, and CRPC, respectively. Follow-up duration was recorded for each patient, and censoring was applied at the last documented contact. An absolute calendar follow-up cutoff was not available in the retrospective records used for this analysis.
Derivation of the AR methylation classifier (MCA)
An AR-focused methylation classifier (MCA) was derived within metastatic samples from promoter-associated CpG loci linked to canonical AR activity. Candidate loci were required to show an absolute correlation of at least 0.40 with the AR activity score and sufficient between-sample variability (SD > 0.15); loci showing an inverse relationship between promoter methylation and corresponding transcript abundance were prioritized. Unsupervised hierarchical clustering of the retained CpG beta-values was then used to identify two major methylation patterns. The cluster characterized by relative hypomethylation of AR-associated genes and higher AR activity was designated MCA-positive, whereas the relatively hypermethylated, lower-AR-activity cluster was designated MCA-negative. MCA status was subsequently integrated with disease state, AR expression, clinicopathologic variables, and survival analyses.
Validation and reproducibility checks
No independent external validation cohort was available for the MCA in the present study. Internal reproducibility was assessed at the clustering level using silhouette analysis, and the MCA-associated survival pattern was visualized descriptively with Kaplan-Meier curves. Because this approach does not constitute external validation and the displayed MCA survival curves show substantial overlap, MCA performance is interpreted as exploratory and requires confirmation in an independent cohort before clinical implementation.
Statistical analysis
Data preprocessing included methylation-array quality control, normalization, and batch assessment. Group contrasts for methylation and expression used parametric or rank-based procedures as appropriate, with false-discovery-rate control for high-dimensional methylation comparisons. AR differences across clinical states were assessed by one-way analysis of variance (ANOVA). Pearson or Spearman coefficients were used for continuous associations according to distributional assumptions; ordered Gleason categories were treated as categorical rather than unrestricted continuous variables in correlation analyses. Time-to-event outcomes were evaluated with Kaplan-Meier curves, log-rank testing, and multivariable Cox regression with hazard ratios and 95% confidence intervals. Analyses were performed using validated statistical software; software names, versions, and package details are listed in the Table of Materials. Two-sided p < 0.05 was considered statistically significant unless otherwise specified.
结果
AR protein expression differed across disease states. Figure 3 and Table 3 report the immunohistochemistry (IHC)-derived nuclear AR H-score (0–300), which was the principal protein-level AR measurement used throughout Tables 3–9 and the survival models. Mean H-score was 122.3 in non-malignant tissue, 127.0 in primary localized malignancy, 181.3 in HNBM, 182.6 in STCM, and 186.8 in CRPC; the overall group difference was significant (one-way ANOVA, F = 13.72, p < 0.001). Transcript-level AR measurements were analyzed separately.
Promoter methylation was analyzed both continuously and after dichotomization. The cohort median beta value of 0.51195 was used as the low/high methylation cutpoint. For the present analysis, this cutpoint was fixed before fitting the Kaplan-Meier and Cox outcome models and was then applied unchanged across all survival analyses. Using this binary definition, methylation-category distribution across the five clinical groups was not statistically significant (χ2 = 8.42, df = 4, p = 0.077; Cramer's V = 0.24). In continuous analyses, AR promoter methylation was inversely associated with nuclear AR H-score (r = -0.480, 95% CI -0.596 to -0.344, p < 0.001; Table 5). These findings support an inverse methylation–AR relationship while avoiding a claim of a significant binary group difference in this dataset.
Clinicopathological associations by clinical group were evaluated using contingency-table methods and are summarized in Table 4. Gleason grading was analyzed only in malignant specimens because Gleason score is not applicable to non-malignant prostate tissue; the non-malignant group was therefore excluded from Gleason-specific comparisons and Figure 4.
Associations between nuclear AR H-score and clinical or molecular variables are summarized in Table 5 and visualized in Figure 5. H-score was positively associated with PSA level (r = 0.674, 95% CI 0.575–0.754, p < 0.001), AR mRNA relative expression (r = 0.641, 95% CI 0.534–0.727, p < 0.001), and Eastern Cooperative Oncology Group (ECOG) performance status (ρ = 0.377, 95% CI 0.229–0.508, p < 0.001), and inversely associated with AR promoter methylation (r = -0.480, 95% CI -0.596 to -0.344, p < 0.001) and hemoglobin (r = -0.290, 95% CI -0.432 to -0.134, p < 0.001). Figure 5 presents these coefficients and 95% confidence intervals as a correlation forest plot. Gleason category is not displayed as a linear correlation because it is an ordered categorical variable.
Among the 134 malignant cases in the survival dataset, 61 were AR-low and 73 were AR-high by the median H-score cutpoint. The AR-high stratum had longer observed median PFS (18.9 vs 12.4 months) and OS (56.2 vs 33.4 months) than the AR-low stratum (Table 6). The direction and magnitude of adjusted associations should be interpreted together with the multivariable Cox models in Table 7. Figure 6 separately displays Kaplan-Meier curves for MCA-negative and MCA-positive metastatic cases; the substantial overlap of the curves indicates limited visual discrimination in the present cohort, so the MCA survival pattern is interpreted descriptively. Complementary survival-time distributions by key predictors are shown in Figure 7.
The PSA-level ANOVA model identified significant main and interaction effects for clinical group, AR category, metastatic status, Gleason score category, clinical group × AR category, and AR category × metastatic status (Table 8). Figure 8 visualizes the corresponding partial η2 effect sizes rather than raw group means: clinical group showed the largest effect (partial η2 = 0.361, p < 0.001), followed by clinical group × AR category (0.112, p = 0.003), AR category (0.109, p < 0.001), metastatic status (0.067, p = 0.002), Gleason score category (0.059, p = 0.004), and AR category × metastatic status (0.029, p = 0.045). Logistic regression results for high AR expression are reported in Table 9, with odds ratios and 95% confidence intervals displayed in Figure 9 on a logarithmic scale. Significant predictors included Gleason score ≥ 8, PSA > 20 ng/mL, metastatic status, bone-only metastases, visceral metastases, AR promoter methylation < median, ECOG ≥ 2, and hemoglobin < 12 g/dL, whereas age and STCM status were not statistically significant. The broader clinical classification and relevance of representative prostate cancer biomarkers are summarized in Table 10.
DATA AVAILABILITY:
The de-identified raw and processed data supporting the findings of this study are deposited in Figshare (DOI: https://doi.org/10.6084/m9.figshare.33421318.v2).
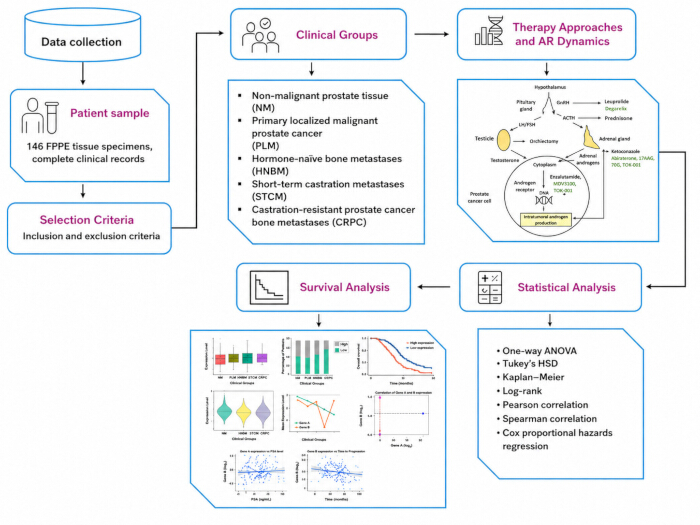
Figure 1: Androgen receptor signaling pathway and therapeutic intervention points. Schematic of androgen synthesis and AR signaling with representative therapeutic nodes, including GnRH modulation, CYP17 inhibition, and AR antagonism. Adapted and redrawn from Hou and Flaig6 under the Creative Commons Attribution license; changes were made to layout and labeling.
Abbreviations: AR, androgen receptor; GnRH, gonadotropin-releasing hormone; CYP17, cytochrome P450 17A1.Please click here to view a larger version of this figure.
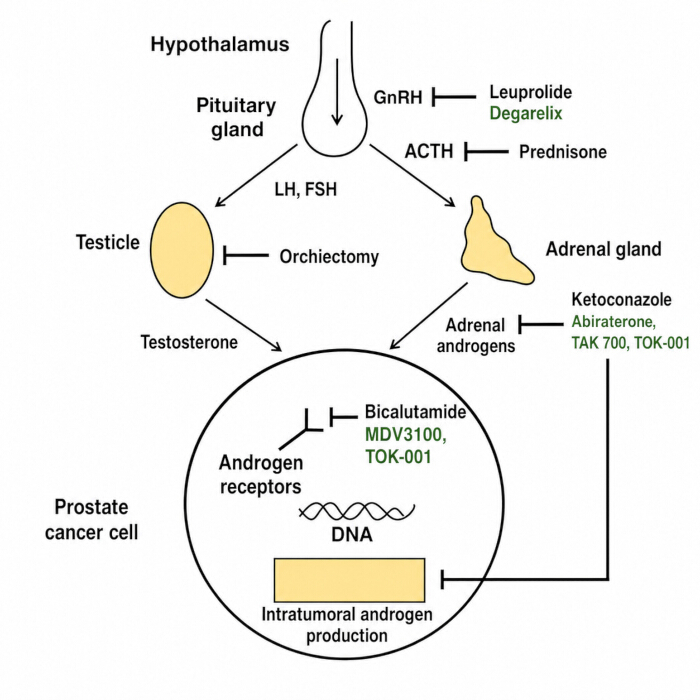
Figure 2: Study workflow and data integration. Flow diagram of specimen grouping, DNA methylation profiling, AR expression quantification (mRNA and IHC), and linkage to clinicopathologic variables and survival analyses.
Abbreviations: AR, androgen receptor; mRNA, messenger RNA; IHC, immunohistochemistry.Please click here to view a larger version of this figure.
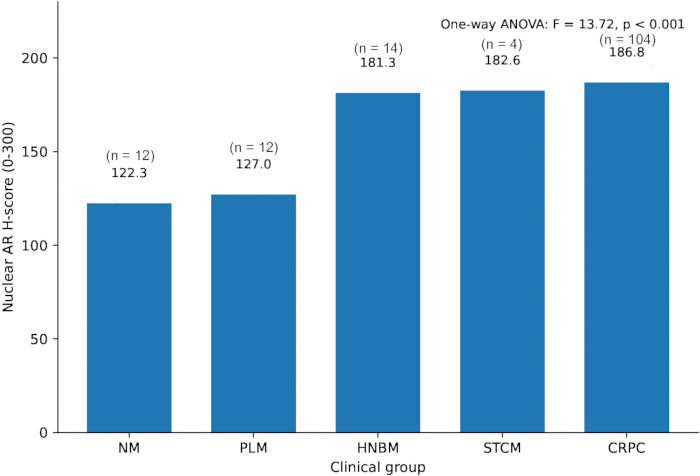
Figure 3: AR protein-expression distributions across clinical groups. The y-axis represents the IHC-derived nuclear AR H-score on a 0–300 scale, the principal protein-level AR measure used in the main analyses. Clinical groups are non-malignant prostate tissue, primary localized malignancy (PLM), hormone-naïve bone metastases (HNBM), short-term castration metastases (STCM), and CRPC bone metastases.
Abbreviations: AR, androgen receptor; IHC, immunohistochemistry; PLM, primary localized malignancy; HNBM, hormone-naïve bone metastases; STCM, short-term castration metastases; CRPC, castration-resistant prostate cancer.Please click here to view a larger version of this figure.
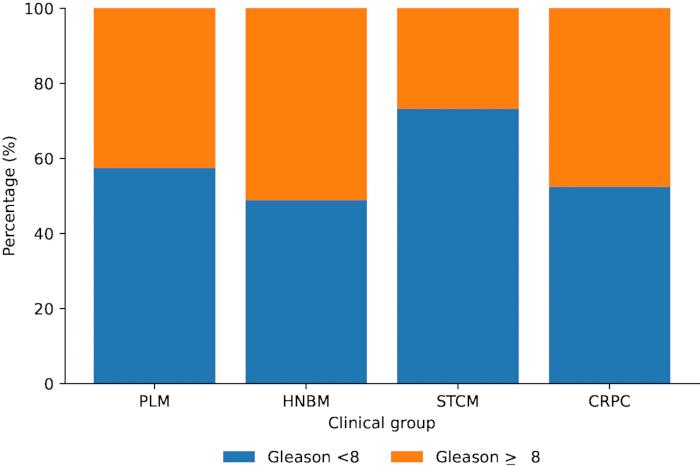
Figure 4: Distribution of high Gleason grade across malignant clinical groups. Stacked bars depict the proportion of Gleason <8 and Gleason ≥8 cases among malignant specimens only. The non-malignant group is excluded because Gleason grading is not applicable to benign prostate tissue.
Abbreviations: HNBM, hormone-naïve bone metastases; STCM, short-term castration metastases; CRPC, castration-resistant prostate cancer.Please click here to view a larger version of this figure.
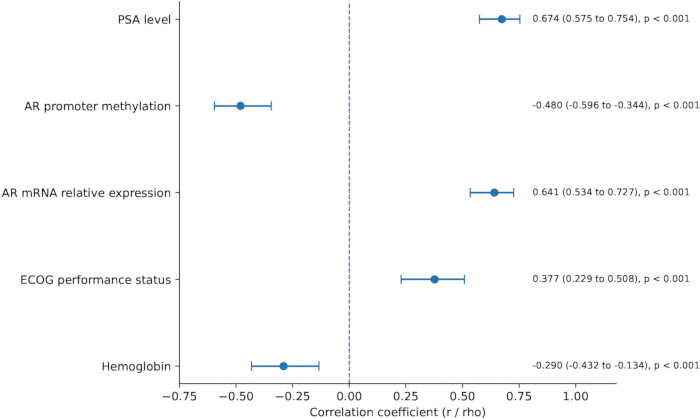
Figure 5: Associations of nuclear AR H-score with clinical and molecular variables. Forest plot of Pearson or Spearman correlation coefficients with 95% confidence intervals for PSA level, AR promoter methylation, AR mRNA relative expression, ECOG performance status, and hemoglobin. The vertical reference line at zero denotes no correlation. Gleason category is not included because it is an ordered categorical variable.
Abbreviations: AR, androgen receptor; PSA, prostate-specific antigen; mRNA, messenger RNA; ECOG, Eastern Cooperative Oncology Group.Please click here to view a larger version of this figure.
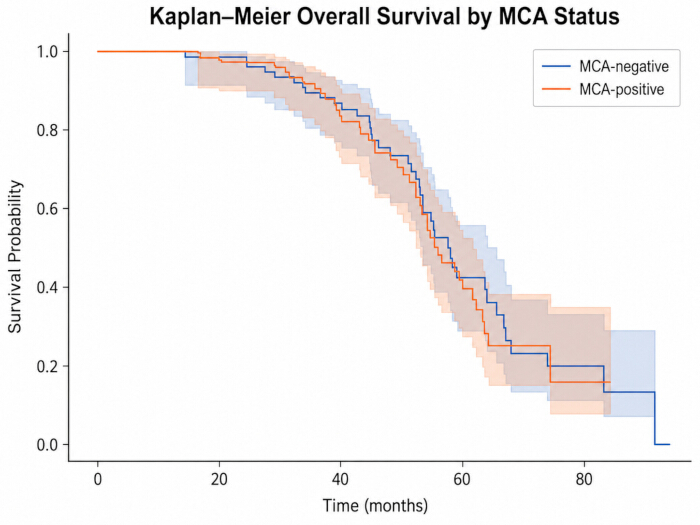
Figure 6: Kaplan-Meier overall-survival curves by AR Methylation Classifier (MCA) status. Curves compare MCA-negative and MCA-positive metastatic cases, with shaded confidence intervals. The substantial overlap indicates limited separation in this cohort; the MCA-associated survival pattern is therefore interpreted descriptively and as hypothesis-generating pending external validation.
Abbreviations: AR, androgen receptor; MCA, AR Methylation Classifier. Please click here to view a larger version of this figure.
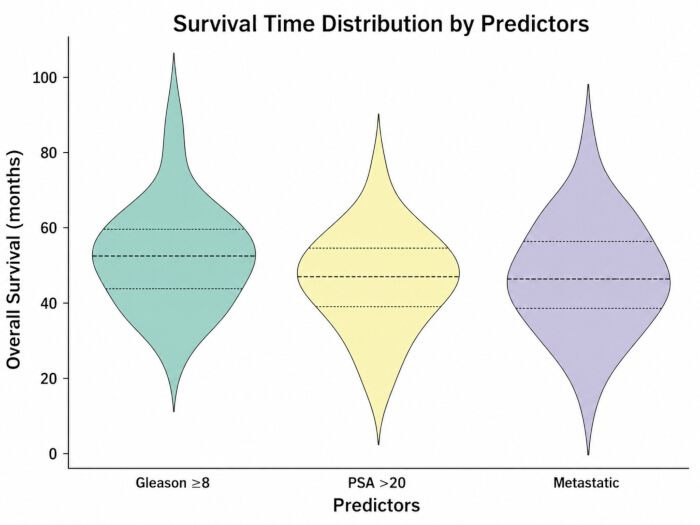
Figure 7: Violin plots of survival-time distributions by key predictors. Distributions of survival times across selected predictors, including Gleason category, PSA category, and metastatic status, provide a complementary descriptive view of risk stratification.
Abbreviations: PSA, prostate-specific antigen.Please click here to view a larger version of this figure.
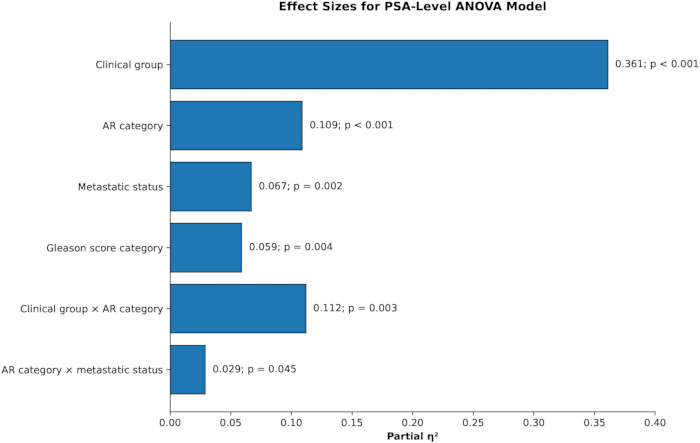
Figure 8: Effect sizes for the PSA-level ANOVA model. Horizontal bars display partial η2 for the main and interaction effects reported in Table 8: clinical group (0.361), AR category (0.109), metastatic status (0.067), Gleason score category (0.059), clinical group × AR category (0.112), and AR category × metastatic status (0.029). Corresponding p values are annotated beside each bar; larger partial η2 values indicate greater explained variance in PSA level.
Abbreviations: PSA, prostate-specific antigen; ANOVA, analysis of variance; AR, androgen receptor.Please click here to view a larger version of this figure.
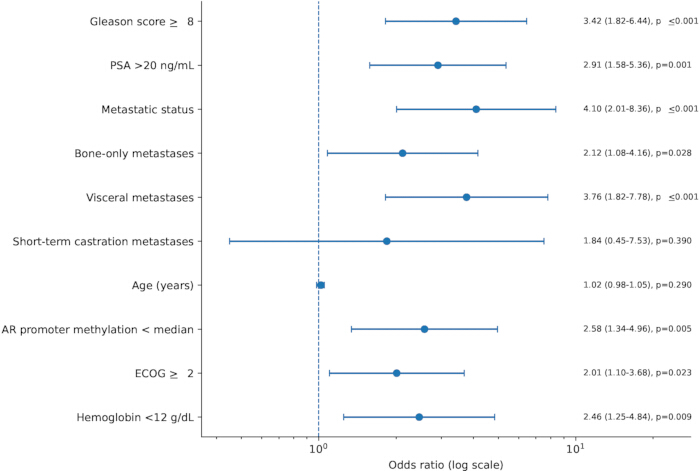
Figure 9: Forest plot of logistic-regression predictors of high AR expression. Odds ratios and 95% confidence intervals from Table 9 are displayed on a logarithmic x-axis; the promoter-methylation predictor is coded as AR promoter methylation < median.
Abbreviations: AR, androgen receptor. Please click here to view a larger version of this figure.
| Table 1. Baseline demographic and clinical characteristics of the cohort | ||
| Variable | Category / Unit | n (%) / Mean ± SD |
| Total specimens | — | 146 |
| Age | Years | 65.4 ± 7.2 |
| Age group | <60 / 60–69 / ≥70 | 38 (26.0) / 72 (49.3) / 36 (24.7) |
| Body mass index (BMI) | kg/m² | 27.1 ± 3.8 |
| Clinical group | NM / PLM / HNBM / STCM / CRPC | 12 / 12 / 14 / 4 / 104 |
| Prostate-specific antigen (PSA) | ng/mL | 18.6 ± 7.9 |
| Comorbidities | Hypertension / Diabetes / CVD / None | 46 (31.5) / 28 (19.2) / 18 (12.3) / 54 (37.0) |
| Performance status (ECOG) | 0 / 1 / ≥2 | 82 (56.2) / 44 (30.1) / 20 (13.7) |
| Molecular assay data available | Methylation / AR transcript / IHC H-score | 146 / 146 / 146 |
| Nuclear AR H-score category | Low (<median) / High (≥median) | 73 / 73 |
| Survival cohort | Malignant cases included | 134 |
| PFS events | Overall | 110 |
| Deaths | Overall | 87 |
| Median follow-up | Months | 52.82 |
Table 1: Baseline demographic and clinical characteristics of the cohort. Summary of age, body mass index (BMI), clinical stage, Gleason score, PSA, treatment type, metastatic status, ECOG status, follow-up, survival, and data availability providing the clinical context for molecular analyses.
Abbreviations: NM, non-malignant; PLM, primary localized malignancy; HNBM, hormone-naïve bone metastases; STCM, short-term castration metastases; CRPC, castration-resistant prostate cancer; CVD, cardiovascular disease; ECOG, Eastern Cooperative Oncology Group; AR, androgen receptor; IHC, immunohistochemistry; PFS, progression-free survival.
| Table 2. Overview of variables, predictors, sources, and biomarkers | |
| Category | Details |
| Variables | Nuclear AR H-score (0–300), AR mRNA relative expression, promoter-associated CpG methylation, clinical disease state, progression-free survival (PFS), and overall survival (OS). |
| Predictors | AR-high/AR-low category defined by the cohort median nuclear AR H-score; AR Methylation Classifier (MCA) status; and clinicopathologic variables used in the corresponding regression models. |
| Sources | Formalin-fixed, paraffin-embedded (FFPE) prostate tissue or histologically confirmed bone-metastatic tissue linked to clinical records. The final analytic file contained 146 records; no external patient-level dataset was merged into the primary analysis. |
| Biomarker readouts | AR mRNA relative expression by real-time PCR; nuclear AR H-score by immunohistochemistry; promoter-associated CpG methylation beta-values; and MCA status. |
| Clinical purpose | AR expression and MCA were evaluated as prognostic biomarkers. Treatment-predictive utility was not claimed because no biomarker-by-treatment interaction design was used. |
Table 2: Overview of variables, predictors, sources, and biomarkers. Listing of nuclear AR H-score, AR mRNA relative expression, promoter-associated CpG methylation, MCA status, data sources (FFPE tissue and clinical records), and the corresponding biomarker readouts.
| Table 3. One-way ANOVA of nuclear AR H-score across clinical groups | ||||
| Group | n | Mean nuclear AR H-score (0–300) | Overall F statistic | p value |
| Non-malignant (NM) | 12 | 122.3 | 13.72 | <0.001 |
| Primary localized malignant (PLM) | 12 | 127 | — | — |
| Hormone-naïve bone metastases (HNBM) | 14 | 181.3 | — | — |
| Short-term castration metastases (STCM) | 4 | 182.6 | — | — |
| CRPC bone metastases | 104 | 186.8 | — | — |
Table 3: One-way ANOVA of nuclear AR H-score across clinical groups. Comparison of mean IHC-derived AR H-score (0–300) among non-malignant, primary localized, HNBM, STCM, and CRPC groups, showing a significant overall group difference.
Abbreviations: ANOVA, analysis of variance.
| Table 4. Chi-square associations between clinical groups and clinicopathological features | ||||
| Variable | χ2 (df) | p value | Cramer’s V | Association / note |
| Gleason grade (<8 vs ≥8) | — | — | — | Non-malignant tissue excluded; Gleason distribution is presented descriptively among malignant groups because STCM (n = 4) yields sparse expected cells. |
| Tumor stage (T2 / T3 / T4) | 28.1 (8) | <0.001 | — | Higher T4 frequency in CRPC. |
| Lymph node status (+ / −) | 14.7 (4) | 0.005 | — | Positive lymph-node status more frequent in metastatic disease. |
| PSA category (<10 / 10–20 / >20 ng/mL) | 37.8 (8) | <0.001 | 0.36 | Higher PSA >20 ng/mL in CRPC. |
| Metastatic site pattern (bone-only / visceral / mixed) | 22.4 (6) | 0.001 | — | Visceral metastases more frequent in CRPC. |
| ECOG performance status (0–1 vs ≥2) | 11.2 (4) | 0.024 | 0.28 | ECOG ≥2 more common in CRPC. |
| AR promoter methylation (low vs high) | 8.42 (4) | 0.077 | 0.24 | Median-dichotomized methylation distribution did not differ significantly across the five clinical groups. |
Table 4: Chi-square associations between clinical groups and clinicopathological features. Associations of group classification with Gleason grade, tumor stage, PSA category, ECOG status, metastatic pattern, and the median-dichotomized AR promoter-methylation category. The methylation-category comparison is interpreted according to its reported chi-square p value rather than as evidence of a significant stage effect.
NOTE: — indicates an effect size or inferential result not reported for that comparison. Cramer’s V values shown are based on the evaluable cohort for the corresponding analysis.
| Table 5. Associations of nuclear AR H-score with clinical and molecular markers | |||||
| Marker | Test | r / ρ | 95% CI | p value | Interpretation |
| PSA level (ng/mL) | Pearson | 0.67 | 0.575–0.754 | <0.001 | Positive association with nuclear AR H-score |
| AR promoter methylation | Pearson | -0.48 | −0.596 to −0.344 | <0.001 | Higher methylation associated with lower nuclear AR H-score |
| AR mRNA relative expression | Pearson | 0.64 | 0.534–0.727 | <0.001 | Positive association between transcript-level AR and nuclear AR H-score |
| ECOG performance status | Spearman | 0.38 | 0.229–0.508 | <0.001 | Higher ECOG category associated with higher nuclear AR H-score |
| Hemoglobin (g/dL) | Pearson | -0.29 | −0.432 to −0.134 | <0.001 | Lower hemoglobin associated with higher nuclear AR H-score |
Table 5: Associations of nuclear AR H-score with clinical and molecular markers. Pearson or Spearman coefficients, 95% confidence intervals, and p values are reported for PSA level, AR promoter methylation, AR mRNA relative expression, ECOG performance status, and hemoglobin. The corresponding coefficients are visualized in Figure 5.
| Table 6. Kaplan–Meier survival summaries by AR H-score category and clinical group | ||||
| Variable | Category | n | Median PFS (months) | Median OS (months) |
| Nuclear AR H-score category | Low (<median) | 61 | 12.4 | 33.4 |
| High (≥median) | 73 | 18.9 | 56.2 | |
| Clinical group | Primary localized PC | 12 | 48 | ≥60 |
| Hormone-naïve bone metastases | 14 | 30 | 48 | |
| Short-term castration metastases | 4 | 18 | 28 | |
| CRPC bone metastases | 104 | 9 | 16 | |
Table 6: Kaplan-Meier survival summaries by AR H-score category and clinical group. Median PFS and OS estimates are shown for AR-low versus AR-high strata within the 134-case malignant survival cohort and for the clinical disease groups. MCA curves are displayed separately in Figure 6.
Abbreviations: PFS, progression-free survival; OS, overall survival.
| Table 7. Multivariable Cox proportional-hazards models for PFS and OS | ||||
| Predictor | PFS — adjusted HR (95% CI) | p value | OS — adjusted HR (95% CI) | p value |
| AR expression (per 50 H-score) | 0.78 (0.66–0.92) | 0.003 | 0.81 (0.68–0.97) | 0.021 |
| AR promoter methylation (per 10% increase) | 1.12 (1.04–1.21) | 0.004 | 1.10 (1.02–1.19) | 0.015 |
| Age at diagnosis (per 5 years) | 1.06 (0.98–1.14) | 0.135 | 1.07 (0.99–1.15) | 0.092 |
| log(PSA) | 1.18 (1.05–1.33) | 0.006 | 1.16 (1.03–1.32) | 0.017 |
| Gleason score ≥8 | 1.45 (1.02–2.07) | 0.039 | 1.41 (0.98–2.04) | 0.064 |
| ECOG ≥2 | 1.60 (1.10–2.34) | 0.014 | 1.55 (1.05–2.31) | 0.028 |
| Metastatic site — visceral vs bone-only | 1.72 (1.21–2.46) | 0.003 | 1.68 (1.17–2.41) | 0.005 |
| Hemoglobin (per 1 g/dL decrease) | 1.14 (1.04–1.25) | 0.007 | 1.12 (1.02–1.23) | 0.015 |
| ALP (per 50 U/L) | 1.07 (1.02–1.13) | 0.008 | 1.06 (1.01–1.12) | 0.024 |
| LDH (per 50 U/L) | 1.05 (1.01–1.09) | 0.021 | 1.04 (1.00–1.08) | 0.046 |
| NLR (per 1 unit) | 1.08 (1.02–1.15) | 0.012 | 1.07 (1.01–1.14) | 0.018 |
Table 7: Multivariable Cox regression for progression-free and overall survival. Adjusted hazard ratios and 95% confidence intervals are reported for nuclear AR H-score (per 50-point increase), AR promoter methylation, age, PSA, Gleason category, ECOG status, metastatic site, hemoglobin, alkaline phosphatase, lactate dehydrogenase, and neutrophil-to-lymphocyte ratio.
NOTE: HR <1 indicates a lower hazard and HR >1 a higher hazard for the specified unit/category.
Abbreviations: PFS, progression-free survival; OS, overall survival; ALP, alkaline phosphatase; LDH, lactate dehydrogenase; NLR, neutrophil-to-lymphocyte ratio.
| Table 8. ANOVA model for PSA level | |||||||
| Source / effect | SS | df | MS | F | p value | Partial η2 | Interpretation |
| Clinical group | 8257.9 | 4 | 2064.5 | 19.2 | <0.001 | 0.361 | Large effect |
| AR category | 1795.7 | 1 | 1795.7 | 16.7 | <0.001 | 0.109 | Moderate effect |
| Metastatic status | 1053.7 | 1 | 1053.7 | 9.8 | 0.002 | 0.067 | Small-to-moderate effect |
| Gleason score category | 924.7 | 1 | 924.7 | 8.6 | 0.004 | 0.059 | Small-to-moderate effect |
| Clinical group × AR category | 1849.4 | 4 | 462.4 | 4.3 | 0.003 | 0.112 | Moderate interaction |
| AR category × metastatic status | 440.9 | 1 | 440.9 | 4.1 | 0.045 | 0.029 | Small effect |
| Error | 14623.4 | 136 | 107.5 | — | — | — | — |
Table 8: ANOVA model for PSA levels: main and interaction effects. Sum of squares, degrees of freedom, mean squares, F statistics, p values, and partial η2 are reported for clinical group, AR category defined by the median H-score, metastatic status, Gleason score category, group × AR category, and AR category × metastatic status. The corresponding effect sizes are visualized in Figure 8.
NOTE: Residual term, SS = 14,623.4, df = 136, MS = 107.5. Partial η2 was calculated as (F × df_effect) / (F × df_effect + df_error).
| Table 9. Multivariable logistic-regression predictors of high nuclear AR H-score | ||||
| Predictor | OR | 95% CI | p value | Significance |
| Gleason score ≥8 | 3.42 | 1.82–6.44 | <0.001 | Significant |
| PSA >20 ng/mL | 2.91 | 1.58–5.36 | 0.001 | Significant |
| Metastatic status | 4.1 | 2.01–8.36 | <0.001 | Significant |
| Bone-only metastases | 2.12 | 1.08–4.16 | 0.028 | Significant |
| Visceral metastases | 3.76 | 1.82–7.78 | <0.001 | Significant |
| Short-term castration metastases | 1.84 | 0.45–7.53 | 0.390 | Not significant |
| Age (years) | 1.02 | 0.98–1.05 | 0.290 | Not significant |
| AR promoter methylation < median | 2.58 | 1.34–4.96 | 0.005 | Significant |
| ECOG ≥2 | 2.01 | 1.10–3.68 | 0.023 | Significant |
| Hemoglobin <12 g/dL | 2.46 | 1.25–4.84 | 0.009 | Significant |
Table 9: Logistic regression predictors of high nuclear AR H-score. Odds ratios are reported for Gleason ≥8, PSA >20 ng/mL, metastatic status, bone-only metastases, visceral metastases, ECOG ≥2, hemoglobin <12 g/dL, and AR promoter methylation < median as candidate predictors of the AR-high category; age and short-term castration metastasis status are also included in the model.
| Table 10. Conceptual classification and clinical relevance of representative prostate cancer biomarkers | ||||
| Biomarker category | Representative examples | Primary clinical role | Typical endpoints / use | Key source(s) |
| Diagnostic / detection-risk | PSA-derived tests, PHI, 4Kscore, PCA3, SelectMDx, ExoDx | Identify or refine the probability of clinically significant prostate cancer and support biopsy-related decisions | Cancer detection; clinically significant disease; biopsy decision support | Refs. 12–13 |
| Prognostic — liquid biopsy | ctDNA burden/alterations; circulating tumor cells (CTCs) | Estimate risk of progression or death and monitor molecular evolution | PFS, OS, progression risk, longitudinal disease monitoring | Ref. 13 |
| Prognostic — inflammatory | Neutrophil-to-lymphocyte ratio (NLR); platelet-to-lymphocyte ratio (PLR) | Provide host inflammatory/immune context for risk stratification | Overall mortality and progression risk; evidence remains heterogeneous | Ref. 16 |
| Prognostic — tissue genomic | Decipher, Genomic Prostate Score (GPS), Prolaris | Refine risk beyond conventional clinicopathologic classification | Biochemical recurrence, metastasis, prostate cancer-specific mortality | Ref. 15 |
| Prognostic — present study | Nuclear AR H-score; AR promoter methylation; AR Methylation Classifier (MCA) | Explore prognostic stratification based on association with clinical outcomes | PFS and OS; directly evaluated in the present cohort | Present study; Refs. 19 and 34 |
| Predictive | Biomarker showing a treatment-by-biomarker interaction | Identify differential benefit or harm from a specific treatment | Treatment-specific response/benefit; requires interaction-based validation | Conceptual distinction: Ref. 12 |
Table 10: Conceptual classification and clinical relevance of representative prostate cancer biomarkers. Summary of diagnostic, prognostic, and predictive biomarker categories, representative examples, principal clinical endpoints, and the role of AR expression/MCA in the present study.
讨论
This study shows that nuclear AR H-score varies across prostate-cancer disease states and is inversely associated with continuous promoter-associated CpG methylation. The binary methylation category defined by the cohort median did not differ significantly across the five clinical groups, so the epigenetic finding is best interpreted as a continuous methylation–AR association rather than as a categorical stage effect. Survival analyses also did not support a simple adverse-prognostic interpretation of higher AR expression: in the malignant survival cohort, the AR-high group had longer observed median PFS and OS, while MCA survival curves overlapped substantially. The prognostic interpretation should therefore remain context-dependent and exploratory, with external validation required before clinical use.
These findings extend prior work by examining AR-related molecular changes across five clinically defined states and by integrating methylation, transcript, protein, and clinical data. The increase in AR H-score across advanced disease states and the inverse continuous methylation–H-score association are biologically compatible with context-dependent regulation of AR signaling. Prior studies also show that AR-related biology and treatment response vary with the tumor microenvironment and with treatment context23,24. The current survival results reinforce why AR abundance should not be treated as a unidirectional risk marker: molecular AR activity, nuclear protein expression, disease state, and treatment setting may have different relationships with outcome. The MCA should therefore be viewed as a candidate stratifier whose prognostic value must be confirmed independently. The findings should also be interpreted within the broader prostate-cancer biomarker landscape; liquid-biopsy markers, inflammatory indices, and tissue genomic classifiers differ in biological source, assay platform, and intended endpoint. Accordingly, comparisons should emphasize incremental prognostic value, discrimination, calibration, and reproducibility rather than statistical significance alone. AR expression and MCA are treated here as prognostic rather than treatment-predictive biomarkers because no biomarker-by-treatment interaction was tested.
Promoter hypomethylation can create a permissive epigenetic state for AR transcription, but AR abundance and activity are also shaped by gene dosage, enhancer activity, splice variants, transcriptional co-regulators, post-translational stability, and treatment pressure25,26. Single-cell heterogeneity, quantitative protein-expression studies, AR-variant biology, metabolic reprogramming, phosphorylation, ferroptosis resistance, and autophagy provide additional mechanistic layers through which AR signaling may be maintained or remodeled27,28,29,30,31,32,33. The inverse methylation–H-score relationship observed here is therefore biologically plausible as one component of a broader AR-reactivation phenotype, but the observational design cannot establish causality. Prior studies also illustrate the context dependence of prognosis: Ylitalo et al. reported an MCA-positive bone-metastasis subtype with lower methylation of canonical AR-associated genes, higher AR activity, and a more favorable prognosis after ADT, whereas Crnalic et al. linked high nuclear AR staining in CRPC bone metastases to poorer outcome34. Other clinical studies likewise indicate that the prognostic meaning of AR expression can vary according to treatment state and disease setting35,36. These findings are not necessarily contradictory because they measure different biological layers, include different disease states, and use different endpoints. AR expression, methylation, disease state, and classifier context should therefore be interpreted jointly.
The most critical steps are accurate tissue annotation, preservation of nucleic-acid quality, avoidance of batch confounding, and consistent scoring of AR expression. Tumor-rich regions should be confirmed histologically before extraction because variable epithelial content can alter both methylation and expression estimates. FFPE-derived nucleic acids should be screened before array or PCR processing; samples failing prespecified quality criteria should be re-extracted from an alternative block when available rather than carried forward with ad hoc correction. For methylation arrays, sample identity, control-probe performance, probe filtering, normalization, genome annotation, and batch assessment should be documented before group comparisons. For IHC, batch controls, blinded scoring, a prespecified disagreement rule, and an interobserver agreement statistic improve reproducibility. These quality-control principles are consistent with established Infinium-array workflows and prior prostate-cancer methylation studies37. Common troubleshooting scenarios include low DNA yield, poor bisulfite-conversion performance, high probe-detection failure, unstable qPCR replicates, and uneven AR staining. Low-yield samples should be re-extracted from additional tissue, where possible; persistent array-control failure should result in sample exclusion according to the prespecified QC rule. qPCR replicate disagreement should trigger inspection of amplification curves and repeat testing rather than manual removal of individual wells. For heterogeneous IHC staining, the entire evaluable tumor area should be scored according to the same H-score rule, with adjudication by a second observer when prespecified disagreement limits are exceeded.
Limitations include the retrospective, single-center design; the small size of several subgroups, particularly the STCM group (n = 4); potential pre-analytical variability from FFPE and bone-specimen processing; and the possibility of residual confounding in survival models. Survival associations were not fully concordant across correlation, Kaplan-Meier, and Cox analyses, and the MCA curves showed substantial overlap. These findings preclude a definitive directional prognostic claim and emphasize the need for individual-level reanalysis and external validation. In addition, the methylation-expression associations are observational and do not establish causality, and the multiplicity inherent to high-dimensional methylation analysis requires strict quality control and false-discovery-rate adjustment. Compared with single-modality approaches such as AR immunohistochemistry, serum PSA, or isolated transcript measurements, the present workflow integrates epigenetic, transcript, protein, and clinical information in the same analytical framework. Its main translational value is the development of a molecular risk-stratification framework that could ultimately be reduced to a smaller targeted assay rather than replacement of routine pathology. Clinical implementation would require standardized pre-analytical handling, particularly for FFPE and decalcified bone specimens; a locked CpG feature set and MCA threshold; analytically validated methylation, qPCR, and IHC procedures; inter-laboratory concordance; and external calibration. A clinically useful assay should also demonstrate incremental value over established variables such as PSA, Gleason grade, ECOG status, and metastatic burden, with prespecified performance for PFS and OS. Liquid-biopsy adaptation may improve longitudinal sampling, but ctDNA/CTC assays also require harmonized collection, processing, detection thresholds, and prospective validation. Accordingly, the current workflow should be regarded as a prognostic-development framework rather than a treatment-selection test. Prospective multicenter validation and biomarker-by-treatment interaction studies are required before predictive or therapeutic claims can be made.
In summary, nuclear AR H-score varies by prostate-cancer disease state and shows an inverse relationship with continuous promoter methylation in the present study. Median-dichotomized methylation status did not differ significantly across clinical groups, and the survival results do not establish that higher AR expression is uniformly associated with worse outcome. MCA-based stratification remains hypothesis-generating because the displayed survival curves overlap and external validation is lacking. The workflow is therefore best viewed as a reproducible framework for studying AR/methylation relationships and for developing prognostic hypotheses that should be tested prospectively in larger, independent cohorts.
披露
The authors declare no competing financial or non-financial interests related to this work. OpenAI ChatGPT was used for English-language editing, editorial organization, and editorial reformatting/redrawing of Figures 4 and 9 based on author-provided content and data. It was not used to generate experimental observations or to make scientific conclusions. All scientific content, analyses, interpretations, figures, and conclusions were reviewed and verified by the authors, who take full responsibility for the manuscript.
致谢
The authors thank the patients and their families for participating in this study, and the clinical staff for their support in specimen collection and data management. No external funding was received for this study.
材料
| 姓名 | 公司 | 目录编号 | 评论 |
|---|---|---|---|
| Anti-Androgen Receptor antibody, clone EPR1535(2) | Abcam | ab133273 | Rabbit monoclonal antibody for FFPE IHC; used at 1:500; RRID: AB_11156085; Product URL: https://www.abcam.com/en-us/products/primary-antibodies/androgen-receptor-antibody-epr15352-ab133273 |
| EnVision FLEX, High pH (Link), HRP | Agilent / Dako | K8000 | High-pH antigen retrieval and HRP/DAB IHC detection system; RRID: AB_2890017; Product URL: https://www.agilent.com/store/en_US/Prod-K800021-2/K800021-2 |
| EZ DNA Methylation-Gold Kit | Zymo Research | D5005 | Bisulfite conversion of genomic DNA; RRID: N/A; Product URL: https://www.zymoresearch.com/products/ez-dna-methylation-gold-kit |
| GenomeStudio Methylation Module | Illumina | GenomeStudio v2011.1; Methylation Module 1.9.0 | Extraction and initial review of methylation-array fluorescence intensities; RRID: SCR_010973; Product URL: https://support.illumina.com/array/array_software/genomestudio.html |
| GraphPad Prism | GraphPad Software | Version 9.5.1 | Figure preparation and graphical quality control; RRID: SCR_002798; Product URL: https://www.graphpad.com/scientific-software/prism/ |
| High-Capacity cDNA Reverse Transcription Kit | Applied Biosystems / Thermo Fisher Scientific | 4368814 | Reverse transcription of FFPE RNA; RRID: N/A; Product URL: https://www.thermofisher.com/order/catalog/product/4368814 |
| IBM SPSS Statistics | IBM | Version 27.0 | Supplementary descriptive and inferential statistics; RRID: SCR_016479; Product URL: https://www.ibm.com/products/spss-statistics |
| Infinium MethylationEPIC BeadChip Kit (16 samples) | Illumina | WG-317-1001 | Genome-wide DNA methylation profiling; RRID: N/A; Product URL: https://support.illumina.com/array/array_kits/infinium-methylationepic-beadchip-kit.html |
| minfi package | Bioconductor | 1.48.0 | Infinium methylation-array preprocessing and QC; RRID: SCR_012830; Product URL: https://bioconductor.org/packages/minfi/ |
| QIAamp DNA FFPE Tissue Kit | QIAGEN | 56404 | Genomic DNA purification from FFPE tissue sections; RRID: N/A; Product URL: https://www.qiagen.com/us/products/discovery-and-translational-research/dna-rna-purification/dna-purification/genomic-dna/qiaamp-dna-ffpe-tissue-kit |
| QuantStudio 5 Real-Time PCR System, 384-well | Applied Biosystems / Thermo Fisher Scientific | A28140 | Real-time PCR instrument; RRID: SCR_020240; Product URL: https://www.thermofisher.com/order/catalog/product/A28140 |
| Qubit 4 Fluorometer | Invitrogen / Thermo Fisher Scientific | Q33238 | Fluorometric nucleic-acid quantification; RRID: SCR_026883; Product URL: https://www.thermofisher.com/us/en/home/brands/product-brand/qubit/qubit-fluorometer.html |
| R statistical environment | R Foundation for Statistical Computing | R 4.3.2 | Methylation preprocessing, statistical analysis, and figure generation; RRID: SCR_001905; Product URL: https://www.r-project.org/ |
| RNeasy FFPE Kit | QIAGEN | 73504 | Total RNA purification from FFPE tissue sections; RRID: N/A; Product URL: https://www.qiagen.com/us/products/discovery-and-translational-research/dna-rna-purification/rna-purification/total-rna/rneasy-ffpe-kit |
| Rotary microtome | Leica Biosystems | RM2235 | Sectioning of FFPE blocks (4–5 µm sections); RRID: SCR_026059; Product URL: https://www.leicabiosystems.com/histology-equipment/microtomes/p/leica-rm2235/ |
| survival package | CRAN / R | 3.5-7 | Kaplan–Meier and Cox regression; RRID: N/A; Product URL: https://cran.r-project.org/package=survival |
| survminer package | CRAN / R | 0.4.9 | Survival visualization; RRID: N/A; Product URL: https://cran.r-project.org/package=survminer |
| TaqMan Gene Expression Assay, human AR | Applied Biosystems / Thermo Fisher Scientific | Hs00171172_m1; catalog 4331182 | Androgen receptor transcript assay; RRID: N/A; Product URL: https://www.thermofisher.com/order/genome-database/details/gene-expression/Hs00171172_m1 |
| TaqMan Gene Expression Assay, human GAPDH | Applied Biosystems / Thermo Fisher Scientific | Hs02786624_g1; catalog 4331182 | Reference-gene assay; RRID: N/A; Product URL: https://www.thermofisher.com/taqman-gene-expression/product/Hs02786624_g1 |
| TaqMan Gene Expression Master Mix | Applied Biosystems / Thermo Fisher Scientific | 4369016 | Real-time PCR master mix; RRID: N/A; Product URL: https://www.thermofisher.com/order/catalog/product/4369016 |
参考文献
- Culig Z, Puhr M. Androgen receptor-interacting proteins in prostate cancer development and therapy resistance. Am J Pathol. 2024;194(3):324–334.
- Quistini A, et al. Androgen receptor signalling in prostate cancer: Mechanisms of resistance to endocrine therapies. Res Rep Urol. 2025;17:211–223.
- Zaidi S, et al. Molecular imaging of androgen receptor expression and glycolysis as biomarkers for clinical outcome in metastatic castration-resistant prostate cancer. medRxiv. 2025.
- Fujita N, et al. Real-world effects of novel androgen receptor axis-targeted agents in non-metastatic castration-resistant prostate cancer: Multi-institutional retrospective research. Prostate Int. 2024;12(1):46–51.
- Madan RA, et al. Androgen receptor-targeted therapies in prostate cancer: Evolving treatment landscape and future directions. Oncologist. 2024;29(6):503–512.
- Hou X, Flaig TW. Redefining hormone sensitive disease in advanced prostate cancer. Adv Urol. 2012;2012:978531.
- Melão BVLA, et al. Relationship between testosterone, androgen receptor and prostatectomy outcomes. Can J Urol. 2024;31(4):11931–11940.
- Chesner LN, et al. Androgen receptor inhibition increases MHC class I expression and improves immune response in prostate cancer. Cancer Discov. 2025;15(3):481–494.
- Li L, Cho KH, Yu X, Cheng S. Systematic multi-omics investigation of androgen receptor-driven gene expression and epigenetic changes in prostate cancer. Comput Biol Med. 2025;189:110000.
- Stitz R, et al. Clinical impact of real-time androgen receptor alteration monitoring on metastatic castration-resistant prostate cancer treatment in real-world settings. Int J Cancer. 2025;157(10):2124–2134.
- Trewartha D, et al. Regulation of androgen receptor protein stability by LIM domain only 2 in prostate cancer. Cell Rep. 2024;43(8):113917.
- Baston C, et al. How to Integrate Prostate Cancer Biomarkers in Urology Clinical Practice: An Update. Cancers. 2024;16(2):316.
- Matuszczak M, Schalken JA, Salagierski M. Prostate Cancer Liquid Biopsy Biomarkers’ Clinical Utility in Diagnosis and Prognosis. Cancers. 2021;13(13):3373.
- Pimenta R, et al. Evaluation of AR, AR-V7, and p160 family as biomarkers for prostate cancer: insights into the clinical significance and disease progression. J Cancer Res Clin Oncol. 2024;150:70.
- Boyer MJ, et al. Genomic classifiers and prognosis of localized prostate cancer: a systematic review. Prostate Cancer Prostatic Dis. 2025;28:103–111.
- Salciccia S, et al. Prognostic role of platelet-to-lymphocyte ratio and neutrophil-to-lymphocyte ratio in patients with non-metastatic and metastatic prostate cancer: A meta-analysis and systematic review. Asian J Urol. 2024;11(2):191–207.
- Urriola-Muñoz P, et al. Loss of the androgen receptor confers an immunosuppressive phenotype via TGFβ in prostate cancer cells. Mol Ther. 2024;32(4):1272–1287.
- Statz CM, et al. Dynamic modulation of androgen receptor activity by transcriptional elongation regulators in prostate cancer. Nat Commun. 2024;15(1):2398.
- Ylitalo EB, et al. A novel DNA methylation signature is associated with androgen receptor activity and patient prognosis in bone metastatic prostate cancer. Clin Epigenetics. 2021;13:133.
- Aryee MJ, et al. Minfi: a flexible and comprehensive Bioconductor package for the analysis of Infinium DNA methylation microarrays. Bioinformatics. 2014;30(10):1363–1369.
- Teschendorff AE, et al. A beta-mixture quantile normalization method for correcting probe design bias in Illumina Infinium 450k DNA methylation data. Bioinformatics. 2013;29(2):189–196.
- Livak KJ, Schmittgen TD. Analysis of relative gene expression data using real-time quantitative PCR and the 2(-Delta Delta C(T)) Method. Methods. 2001;25(4):402–408.
- Xu W, et al. Tumor microenvironment remodeling mediated by androgen receptor signaling and stromal cell interactions in prostate cancer. Front Oncol. 2024;14:1273952.
- Kanayama M, et al. Clinical outcomes of abiraterone acetate in metastatic castration-resistant prostate cancer stratified by AR-V7 status. BMC Cancer. 2024;24(1):365.
- Sun R, et al. Androgen Receptor Variants Confer Castration Resistance in Prostate Cancer by Counteracting Antiandrogen-Induced Ferroptosis. Cancer Res. 2023;83(19):3192–3204.
- McCoy CE, et al. Androgen receptor pathway inhibitors in advanced prostate cancer: ASCO guideline update. J Clin Oncol. 2024;42(24):2839–2851.
- Han S, et al. Single-cell transcriptome analysis reveals heterogeneity of androgen receptor activity in prostate cancer bone metastases. Nat Genet. 2024;56(3):350–361.
- Zhang Q, et al. Artificial intelligence-assisted quantification of androgen receptor expression for predicting prostate cancer prognosis. Comput Biol Med. 2024;169:107588.
- Li X, et al. Androgen receptor variant AR-V7 enhances prostate cancer stemness through NF-κB signaling activation. Mol Cancer Res. 2025;23(1):21–33.
- Song J, et al. Androgen receptor regulates metabolic reprogramming and lipid metabolism in prostate cancer cells. J Exp Clin Cancer Res. 2024;43(1):173.
- Wang T, et al. Phosphorylation of androgen receptor at serine-81 is critical for prostate cancer progression and treatment response. Oncogene. 2024;43(18):2913–2925.
- Li J, et al. Targeting androgen receptor-induced ferroptosis resistance in prostate cancer therapy. Redox Biol. 2024;70:103985.
- Yan Y, et al. Androgen receptor regulates autophagy and promotes prostate cancer progression via the mTOR pathway. Cell Death Dis. 2024;15(4):237.
- Crnalic S, et al. Nuclear androgen receptor staining in bone metastases is related to a poor outcome in prostate cancer patients. Endocr Relat Cancer. 2010;17(4):885–895.
- Hong SK, et al. Clinical impact of androgen receptor expression changes after androgen deprivation therapy in prostate cancer patients. World J Urol. 2024;42(1):113–121.
- Zhu Y, et al. Prognostic value of androgen receptor expression in prostate cancer patients after radical prostatectomy. BMC Urol. 2024;24(1):52.
- Zhao SG, et al. The DNA methylation landscape of advanced prostate cancer. Nat Genet. 2020;52:778–789.