Public transcriptomic and protein resources were integrated with experiments in glioma cells to characterize VCAM1 (vascular cell adhesion molecule 1) clinically and functionally. Across these analyses, VCAM1 was associated with adverse prognosis, altered immune composition, changes in cytokine production and in invasion-associated transcripts, and reduced susceptibility to apoptosis.
研究文章
Vascular Cell Adhesion Molecule 1 Is Associated With Immune Remodeling, Glioma Progression, and Tumor Cell Survival in U87 and U251 Cells
* These authors contributed equally
本文内容
摘要
摘要
The immunosuppressive microenvironment of glioma remains a major barrier to effective treatment. Vascular cell adhesion molecule 1 (VCAM1) regulates leukocyte adhesion and inflammatory signaling, but its relevance to glioma remains unresolved. Clinical and RNA sequencing (RNA-seq) data from The Cancer Genome Atlas (TCGA), gene co-expression information from LinkOmics, and protein expression data from the Human Protein Atlas (HPA) were integrated. Kaplan–Meier analysis, Cox regression, receiver operating characteristic (ROC) analysis, and nomogram construction were used to evaluate prognostic value. Computational deconvolution was used to characterize immune cell composition, and small interfering RNA (siRNA)-mediated knockdown in U87 and U251 glioma cells was performed to evaluate VCAM1 function. VCAM1 expression was higher in glioma tissues than in normal brain tissues and increased with tumor grade. Overall survival (OS) was shorter in patients with higher VCAM1 expression, and similar findings were observed for disease-specific survival (DSS) and progression-free interval (PFI). Macrophage, regulatory T-cell, and dendritic-cell infiltration estimates were associated with VCAM1 expression, and programmed cell death 1 ligand 2 (PDCD1LG2/PD-L2) expression showed a further positive association. In cell-based assays, VCAM1 depletion reduced IL-4, IL-10, and TNF-β expression; increased IFN-γ expression; reduced MMP2, MMP9, and N-cadherin transcript levels; increased E-cadherin transcript levels; enhanced apoptosis; and reduced phosphorylation of p65, AKT, and ERK. These findings suggest that VCAM1 is associated with immune composition, inflammatory signaling, glioma cell survival, and an invasion-associated transcriptional phenotype, supporting further evaluation as a prognostic biomarker and potential therapeutic target.
引言
Glioma constitutes the predominant primary malignant neoplasm of the central nervous system and represents the most malignant tumors arising in the brain1,2,3. Standard care generally involves maximal surgical removal4, followed by radiotherapy and chemotherapy, yet outcomes remain unsatisfactory5,6. Glioblastoma (GBM) is the most aggressive subtype. Median survival is only 14–18 months, and fewer than 10% of patients remain alive at 5 years7,8,9. Therapeutic failure is partly related to an immunosuppressive tumor microenvironment (TME) enriched in inhibitory immune populations10,11,12. These populations include tumor-associated macrophages (TAMs), regulatory T cells (Tregs), and myeloid-derived suppressor cells (MDSCs). Together with other recruited cells, they restrain antitumor immunity and facilitate progression13,14,15.
Vascular cell adhesion molecule 1 (VCAM1), a member of the immunoglobulin superfamily, is a membrane-associated glycoprotein16. Activated endothelial cells and certain immune populations express VCAM1, which supports leukocyte attachment and migration across the endothelium17. Dysregulated expression has been connected to invasion, angiogenesis, dissemination, and immune escape in several cancers18,19,20. Tumor-promoting effects have been described in lung, breast, and colorectal malignancies, whereas the contribution of VCAM1 to glioma remains unclear. Prior observations implicate VCAM1 in cytokine regulation, immune recruitment, and treatment resistance. The clinical importance of these relationships is unresolved, particularly in a disease where successful immunotherapy requires relief of local immune suppression.
Analyses of TCGA, HPA, and LinkOmics data were integrated with VCAM1-knockdown experiments to investigate the association of VCAM1 with glioma progression, immune-related phenotypes, and cell survival. Expression patterns, clinical outcomes, immune infiltration, cytokine production, invasion-associated transcripts, apoptosis, and downstream signaling activity were evaluated. The combined evidence connects VCAM1 with cytokine control and survival of glioma cells. These observations justify further assessment of VCAM1 as both a prognostic marker and a possible treatment target.
方案
The computational component relied on open-access TCGA, LinkOmics, and HPA resources. The study did not prospectively recruit participants, use identifiable patient information, or involve animals. Consequently, neither institutional review board (IRB) review nor informed consent applied. Before experiments, the human glioma cell lines were authenticated and confirmed to be free of mycoplasma. The Table of Materials lists the reagents, software, cell line identifiers, and equipment.
1. TCGA Dataset
Clinical annotations and RNA sequencing (RNA-seq) profiles, reported as fragments per kilobase of transcript per million mapped reads (FPKM), were retrieved for 669 The Cancer Genome Atlas (TCGA) low-grade glioma (LGG) and glioblastoma (GBM) cases. Normal brain specimens from the Genotype-Tissue Expression (GTEx) project served as the non-tumor reference group. Cases lacking clinical information or VCAM1 expression measurements were excluded. Following voom normalization, tumor and normal samples were compared using the limma package in R (version 4.0+). The false discovery rate (FDR) was controlled using the Benjamini–Hochberg procedure. Genes were considered differentially expressed when |log₂(fold change)| > 1 and adjusted p < 0.05.
2. LinkOmics database
Genes co-varying with VCAM1 were retrieved from LinkOmics (https://www.linkedomics.org/) through its LinkFinder module. Pearson coefficients were calculated, and associations meeting p < 0.01 after FDR adjustment were retained. Correlation distributions were displayed as volcano plots. The pheatmap R package was used to visualize the most strongly positive and negative gene sets. Gene Ontology (GO) terms and Kyoto Encyclopedia of Genes and Genomes (KEGG) pathways were assessed with clusterProfiler.
3. Human protein atlas (HPA) database
Representative immunohistochemistry (IHC) images for VCAM1 in normal brain and glioma were retrieved from HPA (https://www.proteinatlas.org/). For each image, staining strength, the fraction of positive cells, and intracellular localization were documented. HPA images provided qualitative confirmation at the protein level and were not treated as a quantitative validation cohort.
4. Survival analysis and prognostic evaluation
The R packages survival and survminer supported outcome analyses. Patients were divided at the median VCAM1 value. Log-rank tests were first used to examine overall survival (OS), followed separately by progression-free interval (PFI) and disease-specific survival (DSS). Cox proportional hazards models generated hazard ratios (HRs) with 95% confidence intervals (CIs). Sex and age were included in the multivariable analysis, along with isocitrate dehydrogenase (IDH) status and World Health Organization (WHO) grade. Proportionality was checked from Schoenfeld residuals.
5. ROC and time-dependent ROC analyses
Using OS as the classification endpoint, pROC generated receiver operating characteristic (ROC) curves and corresponding area under the curve (AUC) estimates. Censoring was incorporated with timeROC when calculating time-dependent performance at 1, 3, and 5 years.
6. Nomogram construction and calibration
A multivariable Cox model implemented in RMS served as the basis for the nomogram. Its inputs were VCAM1 abundance, WHO grade, IDH status, sex, and age. Agreement between observed and model-estimated survival was examined after 1 year and again after 3 and 5 years. The concordance index (C-index) summarized discrimination, and 1,000 bootstrap iterations were used to evaluate stability.
7. Immune infiltration analysis
Immune-cell abundance in each glioma sample was inferred independently with TIMER and CIBERSORT. Associations with VCAM1 were examined for macrophages, neutrophils, natural killer (NK) cells, and other immune subsets. Pearson or Spearman coefficients were chosen according to variable distribution. Stacked bars summarized immune composition after samples were separated into high- and low-VCAM1 groups.
8. Cell Culture and siRNA Transfection
U87 and U251 human glioma cells were purchased from a commercial repository. Short tandem repeat (STR) profiles were used to verify their identities, and mycoplasma tests were negative before use. Cultures were grown in complete medium at 37 °C under humidified 5% CO₂.
Either a VCAM1-directed small interfering RNA (siRNA) or a non-targeting control was introduced into the cells. Each well received 2 × 10⁵ cells and 50 nM siRNA. Equal proportions of transfection reagent and siRNA produced a 1:1 ratio. Unless noted otherwise, measurements were obtained 48 h later. Knockdown was verified by western blotting and quantitative real-time polymerase chain reaction (qRT-PCR).
9. Quantitative real-time PCR (qRT-PCR)
RNA was isolated with an RNA extraction reagent and converted to first-strand complementary DNA (cDNA) using a reverse-transcription kit. Quantitative real-time PCR (qRT-PCR) was used to measure VCAM1; IL-4, IL-10, TNF-β, and IFN-γ; and the invasion-associated markers MMP2, MMP9, E-cadherin, and N-cadherin. Reactions contained qPCR master mix and were run on a real-time instrument. GAPDH was the internal reference, and relative abundance was derived with the 2−ΔΔCt method.
Primer sequences available in the present manuscript were as follows:
VCAM1 forward: 5′-TGAGAAGTTTGGCAGTGGTG-3′
VCAM1 reverse: 5′-GGCAAACAGTTGACAGTGTCC-3′
GAPDH forward: 5′-GGAGCGAGATCCCTCCAAAAT-3′
GAPDH reverse: 5′-GGCTGTTGTCATACTTCTCATGG-3′
IL-4 forward:5′-ATGGGTCTCACCTCCCAACT-3′
IL-4 reverse:5′-GATGTCTGTTACGGTCAACTCG-3′
IL-10 forward:5′-GACTTTAAGGGTTACCTGGGTTG-3′
IL-10 reverse:5′-TCACATGCGCCTTGATGTCTG-3′
TNF-β (LTA) forward:5′-ATGACACCACCTGAACGTCTC-3′
TNF-β(LTA) reverse:5′-CTCTCCAGAGCAGTGAGTTCT-3′
IFN-γ(IFNG) forward:5′-TCGGTAACTGACTTGAATGTCCA-3′
IFN-γ(IFNG) reverse:5′-TCGCTTCCCTGTTTTAGCTGC-3′
MMP2 forward:5′-GATACCCCTTTGACGGTAAGGA-3′
MMP2 reverse:5′-CCTTCTCCCAAGGTCCATAGC-3′
MMP9 forward:5′-AGACCTGGGCAGATTCCAAAC-3′
MMP9 reverse:5′-CGGCAAGTCTTCCGAGTAGT-3′
E-cadherin(CDH1) forward:5′-ATTTTTCCCTCGACACCCGAT-3′
E-cadherin(CDH1) reverse:5′-TCCCAGGCGTAGACCAAGA-3′
N-cadherin(CDH2) forward:5′-TGCGGTACAGTGTAACTGGG-3′
N-cadherin(CDH2) reverse:5′-GAAACCGGGCTATCTGCTCG-3′
10. Flow cytometric analysis of apoptosis
At 72 h after transfection, apoptosis was measured by Annexin V-FITC/PI staining. Harvested cells were rinsed in cold phosphate-buffered saline (PBS) and processed according to the detection-kit protocol. Flow cytometry analysis software was used to evaluate the acquired events after debris and doublets had been gated out. Annexin V−/PI− events were classified as viable, Annexin V+/PI− events as early apoptotic, and Annexin V+/PI+ events as late apoptotic or necrotic. The experiment included three biological replicates.
11. Enzyme-linked immunosorbent assay (ELISA)
Supernatants obtained 48 h after transfection were assayed for IL-4, IL-10, TNF-β, and IFN-γ with enzyme-linked immunosorbent assay (ELISA) kits. Optical density was read at 450 nm and adjusted for cell count or total protein. Each of the three independent experiments contained duplicate wells.
12. Statistical analysis
The Shapiro-Wilk test assessed normality, after which Pearson or Spearman correlation was selected as appropriate. Student's t-test was used for two-group comparisons. For more than two groups, one-way analysis of variance (ANOVA) was followed by Tukey's post hoc procedure. Levene's test evaluated equal variance. Significance was defined as two-sided p < 0.05.
结果
VCAM1 expression is associated with prognosis and the immune context
VCAM1 abundance varied across tumor types rather than showing a universal increase. Relative to normal brain, glioma displayed a pronounced elevation (Figure 1A). Significant increases were found in glioblastoma (GBM) and lung adenocarcinoma (LUAD). Stomach adenocarcinoma (STAD) and esophageal carcinoma (ESCA) showed the same direction, as did head and neck squamous cell carcinoma (HNSC). The pattern was absent from pancreatic adenocarcinoma (PAAD), breast invasive carcinoma (BRCA), and several other cancers. The increase in VCAM1 was therefore context-dependent and especially evident in glioma.
Pan-cancer Cox analyses summarized the associations between VCAM1 abundance and overall survival (OS), disease-specific survival (DSS), and progression-free interval (PFI) as forest plots (Figure 1B–D). Immune analysis linked VCAM1 to macrophage, regulatory T-cell (Treg), and dendritic-cell infiltration (Figure 1E). Together, the pan-cancer outcome patterns and glioma immune profile supported further glioma-focused analyses.
Glioma samples contained more VCAM1 than normal brain samples in the direct tissue comparison (Figure 1F). Values rose across World Health Organization (WHO) grades and peaked in grade IV disease (Figure 1G). Relationships between VCAM1, clinicopathological variables, and molecular subtypes were visualized by the Sankey plot (Figure 1H). HPA immunohistochemistry (IHC) showed VCAM1-positive staining in representative glioma sections (Figure 1I). These images supplied qualitative protein evidence because they did not constitute a quantitative validation series. The magnitude and direction of these associations varied across tumor types; therefore, glioma-specific Kaplan-Meier curves are presented separately in Figure 2.
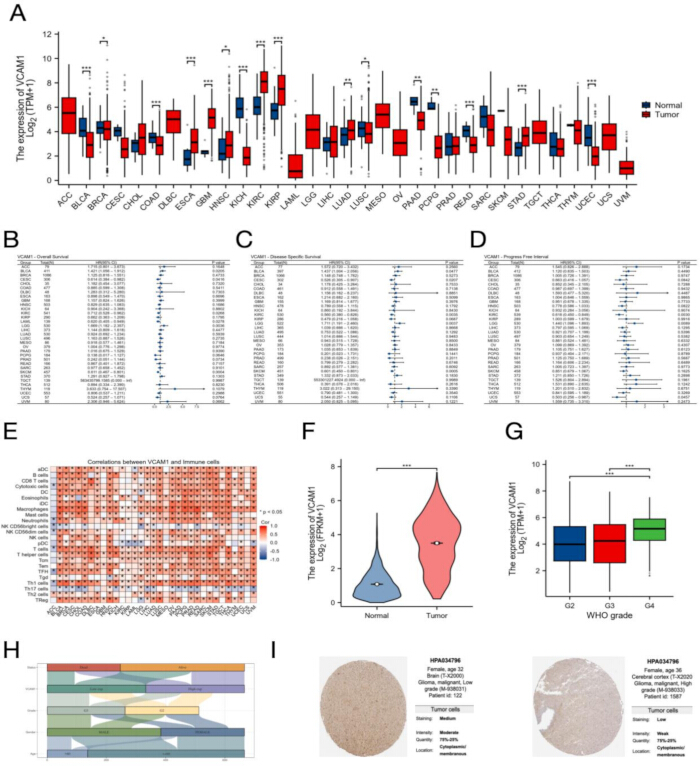
Figure 1: Clinical, expression, and immune features associated with VCAM1 in glioma. (A) TCGA pan-cancer comparison of VCAM1 abundance. (B–D) Forest plots summarizing pan-cancer associations between VCAM1 and overall survival (OS), disease-specific survival (DSS), and progression-free interval (PFI), respectively. (E) Heatmap relating VCAM1 to immune-cell estimates. (F) Tumor-versus-normal brain comparison. (G) Distribution across World Health Organization (WHO) grades. (H) Sankey representation of VCAM1 and clinicopathological variables. (I) Representative VCAM1 immunohistochemistry (IHC) from HPA. Please click here to view a larger version of this figure.
High VCAM1 expression identifies a poor-outcome glioma subgroup
Kaplan-Meier estimates consistently favored patients with lower VCAM1 expression. For disease-specific survival (DSS), the high-expression group had HR = 2.09 (95% confidence interval [CI]: 1.61–2.71; p < 0.001; Figure 2A). Progression-free interval was likewise shorter, with PFI HR = 1.68 (95% CI: 1.36–2.09; p < 0.001; Figure 2B). Overall survival followed the same direction, with OS HR = 2.01 (95% CI: 1.57–2.57; p < 0.001; Figure 2C). Together, the three endpoints characterized high-VCAM1 glioma as a poor-outcome subgroup.
A receiver operating characteristic (ROC) curve was generated with OS as the endpoint. The area under the curve (AUC) for VCAM1 was 0.819 (95% CI: 0.752–0.886; Figure 2D), consistent with moderate discrimination in this dataset. At 1, 3, and 5 years, time-dependent AUCs were 0.635, 0.609, and 0.627, respectively (Figure 2E).
Model-predicted survival closely tracked observed survival at 1, 3, and 5 years in the calibration analysis (Figure 2F). The resulting nomogram combined VCAM1 expression and WHO grade with sex, age, and isocitrate dehydrogenase (IDH) status (Figure 2G).
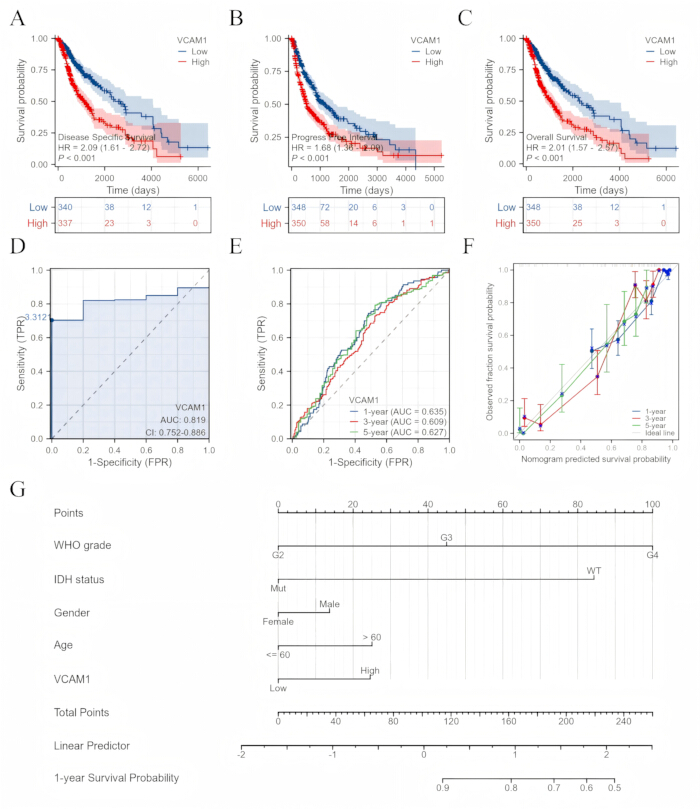
Figure 2: Assessment of VCAM1 as a prognostic variable. (A–C) Kaplan-Meier estimates presented in the order disease-specific survival (DSS), progression-free interval (PFI), and overall survival (OS). (D) Receiver operating characteristic (ROC) analysis; the area under the curve (AUC) reached 0.819. (E) Performance was evaluated after 1, 3, and 5 years. (F) Agreement between modeled and observed survival. (G) Nomogram containing VCAM1, sex, age, World Health Organization (WHO) grade, and isocitrate dehydrogenase (IDH) status. Please click here to view a larger version of this figure.
VCAM1 expression is associated with immune-infiltration patterns
Deconvolution revealed multiple immune populations whose estimated abundance varied with VCAM1. Macrophages and eosinophils showed positive relationships. Neutrophils followed the same direction, while NK CD56bright cells were inversely related to VCAM1 (Figure 3A). High- and low-VCAM1 groups also differed in their stacked immune-composition profiles (Figure 3B). These results connected VCAM1 with the immune architecture of glioma.
Individual scatter plots quantified the immune relationships. Macrophage infiltration increased with VCAM1 (R = 0.499, p < 0.001; Figure 3C), as did eosinophil infiltration (R = 0.431, p < 0.001; Figure 3D). Conversely, NK CD56bright infiltration declined as VCAM1 increased (R = −0.338, p < 0.001; Figure 3E). Plasmacytoid dendritic cells (pDCs) showed a further moderate inverse relationship (R = −0.283, p < 0.001; Figure 3F).
VCAM1 expression was next compared with programmed cell death 1 ligand 2 (PDCD1LG2/PD-L2) expression. A strong positive correlation was observed in low-grade glioma (LGG; rho = 0.651, p < 2.2 × 10⁻16; Figure 3G). The association remained significant in glioblastoma (GBM), although it was weaker (rho = 0.42, p = 2.49 × 10⁻8; Figure 3H). This correlation across glioma grades associated VCAM1 expression with an immunosuppressive signaling marker.
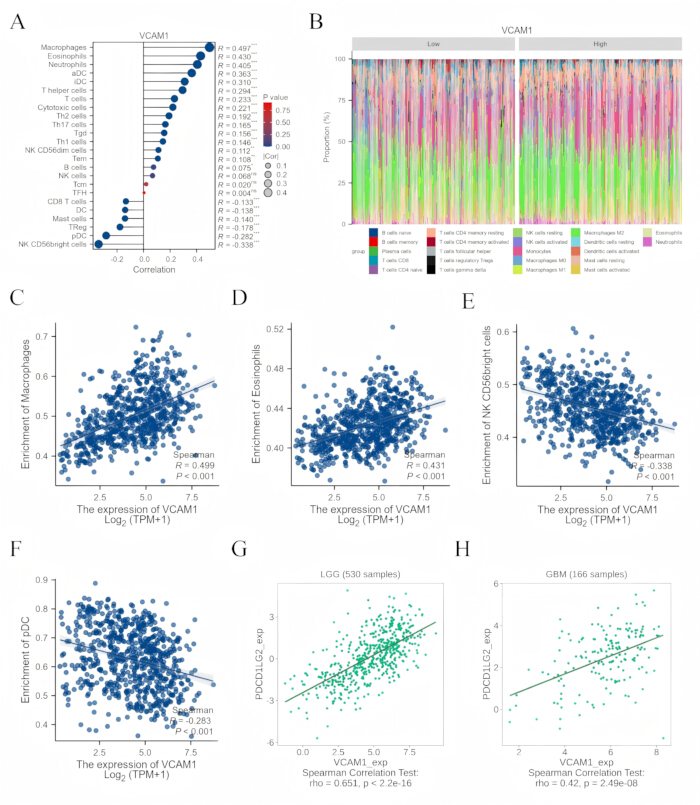
Figure 3: Relationship of VCAM1 to the glioma immune compartment. (A) Immune-cell estimates correlated with VCAM1. (B) Stacked cellular composition for high- and low-VCAM1 groups. (C–F) Pairwise plots for selected immune subsets. (G–H) Association between VCAM1 and programmed cell death 1 ligand 2 (PDCD1LG2/PD-L2) in low-grade glioma (LGG) and glioblastoma (GBM). Please click here to view a larger version of this figure.
VCAM1-related genes are enriched in immune and inflammatory pathways
Transcriptome-wide correlations were used to place VCAM1 within broader biological programs. Genes on both sides of the correlation distribution were displayed in a volcano plot (Figure 4A). Separate heatmaps of representative genes distinguished low- from high-VCAM1 samples (Figure 4B, C), revealing coordinated transcriptional differences between these groups.
Gene Ontology (GO) results for the high-VCAM1 group emphasized leukocyte migration and cytokine-mediated signaling. Antigen processing and presentation were also prominent. Kyoto Encyclopedia of Genes and Genomes (KEGG) analysis supported the immune-pathway pattern (Figure 4D). Low-VCAM1 profiles instead emphasized neuronal communication, synaptic function, and metabolism. The pathway-level contrast paralleled the immune-deconvolution findings.
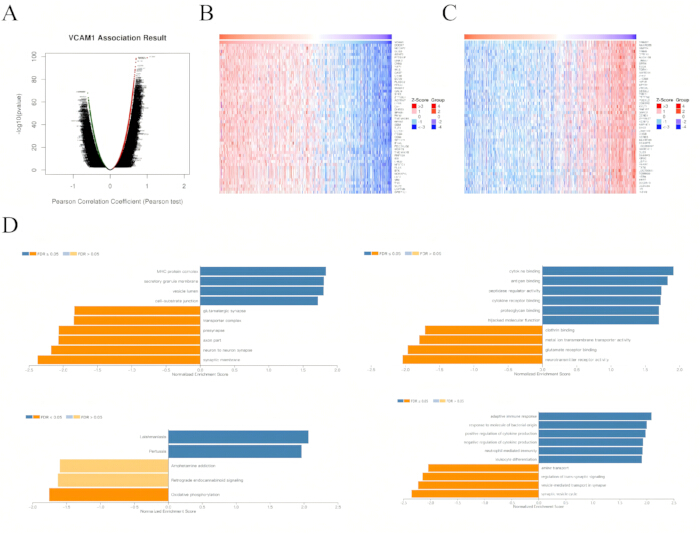
Figure 4: Transcriptional programs accompanying VCAM1 expression. (A) Volcano representation of VCAM1-correlated genes. (B–C) Representative heatmaps from the low- and high-VCAM1 groups. (D) Immune enrichment detected by Gene Ontology (GO) and supported by Kyoto Encyclopedia of Genes and Genomes (KEGG) analysis. Please click here to view a larger version of this figure.
VCAM1 depletion changes cytokine output, invasion-associated markers, and apoptosis in glioma cells
VCAM1 was depleted using small interfering RNA (siRNA) to assess the effects on signaling, cytokine production, invasion-associated transcripts, and apoptosis in glioma cells. Phosphorylated p65, AKT, and ERK decreased after knockdown, while the corresponding total-protein amounts changed little (Supplementary Figure 1). Western blot analysis demonstrated reduced phosphorylation of p65, AKT, and ERK following VCAM1 knockdown. VCAM1 depletion, therefore, affected pathway activation more clearly than the total abundance of these survival- and inflammation-related proteins.
In both glioma cell lines, quantitative real-time PCR (qRT-PCR) revealed distinct cytokine profiles following VCAM1 depletion. IL-4, IL-10, and TNF-β transcripts declined, whereas IFN-γ increased (Figure 5A, B).
VCAM1 knockdown also reduced MMP2, MMP9, and N-cadherin transcripts while increasing E-cadherin in both U87 and U251 cells (Figure 5C, D). This shift is consistent with a less mesenchymal, invasion-associated transcriptional phenotype, although migration and invasion were not measured directly. VCAM1 silencing also increased the apoptotic fraction in U87 and U251 cultures (Figure 5E). More apoptotic events occurred with si-VCAM1 than with si-NC, consistent with a survival-supporting role for VCAM1 under these assay conditions (Supplementary Figure 2). Western blot analysis demonstrated reduced phosphorylation of p65, AKT, and ERK following VCAM1 knockdown.
Secreted cytokines changed in the same direction as their transcript measurements. Enzyme-linked immunosorbent assay (ELISA) showed lower IL-4, IL-10, and TNF-β, but higher IFN-γ, after VCAM1 knockdown (Figure 5F, G). Taken together with increased apoptosis and reduced phosphorylation of p65, AKT, and ERK, these data link VCAM1 to inflammatory activity and glioma cell survival.
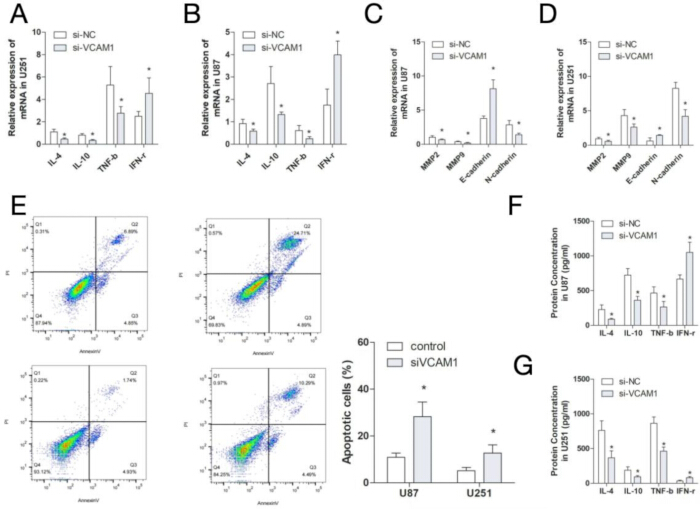
Figure 5: Cellular consequences of VCAM1 depletion. (A–B) Quantitative real-time PCR (qRT-PCR) measurements of IL-4, IL-10, TNF-β, and IFN-γ in U251 and U87 cells. (C–D) qRT-PCR measurements of MMP2, MMP9, E-cadherin, and N-cadherin in U87 and U251 cells. (E) Apoptosis after VCAM1 knockdown, measured by flow cytometry. (F–G) Enzyme-linked immunosorbent assay (ELISA) measurements of secreted cytokines in U87 and U251 cells. Results derive from three independent experiments. Please click here to view a larger version of this figure.
DATA AVAILABILITY:
All bioinformatics datasets analyzed in this study were obtained from publicly available resources, including The Cancer Genome Atlas (TCGA), the Genotype-Tissue Expression (GTEx) project, LinkOmics, and the Human Protein Atlas (HPA; ENSG00000162692). No new clinical, sequencing, genomic, or transcriptomic datasets were generated. The raw experimental data supporting the qRT-PCR, ELISA, flow cytometry, and western blot analyses are provided as Supplementary File 1.
Supplemental File 1: Raw dataset supporting the VCAM1-based prognostic nomogram. This file contains the de-identified, patient-level raw data underlying all analyses presented in the manuscript. Please click here to download this file.
It includes:
- Baseline clinicopathological variables for every enrolled patient (e.g., age, sex, tumor stage, histologic grade, and treatment regimen)
- VCAM1 expression measurements (e.g., immunohistochemical staining scores / quantitative expression values) used as the core biomarker predictor;
- Follow-up and outcome data, including survival time and survival status (overall survival and/or progression-free survival), together with the event indicator;
- Nomogram-derived predicted risk scores and the corresponding observed outcomes used to construct the ROC curves, calibration plots, and the decision curve analysis (DCA) presented in the main text and Supplementary Figure 1.
Supplementary Figure 1: Decision curve analysis of the VCAM1-based prognostic model. (A) Decision curve analysis showing the net clinical benefit of the prognostic model across a range of threshold probabilities. (B) One representative blot from three independent experiments is presented. Approximate expected sizes are 90 kDa for VCAM1, 65 kDa for p65, 60 kDa for AKT, 44/42 kDa for ERK1/2, and 36 kDa for GAPDH. U87 and U251 designations are used consistently. Please click here to download this file.
Supplementary Figure 2: xCell-based immune infiltration analysis according to VCAM1 expression in glioma. (A) Macrophage xCell scores in the high- and low-VCAM1 expression groups. (B) Regulatory T-cell (Treg) xCell scores in the high- and low-VCAM1 expression groups. Statistical significance was determined using the Wilcoxon rank-sum test. Please click here to download this file.
讨论
By combining public omics datasets with cell experiments, this work evaluated VCAM1 across clinical, immune, and functional dimensions of glioma. Expression was greater in tumors and rose with grade. Higher values coincided with worse overall survival (OS), while disease-specific survival (DSS) and progression-free interval (PFI) showed the same adverse pattern. Prior studies have associated VCAM1 with aggressive behavior in other malignancies16,17,18,19,20. The analysis adds glioma-specific links to immune composition, cytokine phenotypes, and invasion-associated transcriptional markers.
Macrophage, dendritic-cell, and regulatory T-cell (Treg) estimates varied with VCAM1 abundance. The additional relationship with PDCD1LG2 (PD-L2) places VCAM1 within an immunosuppressive microenvironmental context10,11,12,13,14,15,16,17. Functional assays were directionally consistent with this interpretation. Depleting VCAM1 changed several cytokines, shifted MMP2, MMP9, E-cadherin, and N-cadherin transcripts toward a less mesenchymal pattern, and enhanced apoptosis, suggesting contributions to inflammatory communication, invasion-associated transcription, and tumor-cell persistence.
These findings can be interpreted through several, potentially overlapping processes. By supporting leukocyte adhesion, VCAM1 could influence immune-cell entry into glioma tissue16,17. Its participation in cytokine networks may also help sustain a tumor-supportive, partially suppressive environment10,11,12,13,14,15,16,17. The correlation with PD-L2 further links VCAM1 to immune evasion biology. The accompanying reduction in MMP2, MMP9, and N-cadherin, and the increase in E-cadherin, are consistent with diminished mesenchymal transcription, but they do not, by themselves, demonstrate reduced cell migration or invasion. The present data therefore position VCAM1 as a potential interface among inflammation, immune regulation, and glioma progression.
Several constraints temper this interpretation. The limited normal-brain reference set reduces confidence in tumor-versus-normal comparisons. TCGA also represents selected populations, which may restrict generalizability. Immune composition was inferred computationally rather than measured directly in tissue or by flow cytometry. Selection effects inherent to public datasets cannot be excluded, and independent cohorts are needed. Moreover, knockdown offers only preliminary mechanistic evidence and does not replace in vivo validation. The marker measurements in Figure 5C, D were not accompanied by direct migration or invasion assays. Further work should elucidate how VCAM1 regulates cytokine output, invasive behavior, and potential interactions with immune checkpoint pathways.
In summary, VCAM1 marked a glioma phenotype characterized by unfavorable outcome, altered immune infiltration, cytokine changes, invasion-associated transcriptional changes, and reduced apoptosis. Prospective cohorts, direct migration and invasion assays, and in vivo experiments are required before these observations can inform clinical practice. If independently confirmed, targeting VCAM1 could be evaluated alone or together with immunotherapy.
披露
The authors declare that the research was conducted without any commercial or financial relationships that could be construed as a potential conflict of interest.
Author Contributions:
Mengmeng Liu and Si-Cong Jiang conceived and designed the study, developed the methodology, performed the investigations, and prepared the original manuscript draft. Wei Chen performed the formal analysis, curated the data, and contributed to manuscript preparation. Jiaxin Zhang performed the investigations and formal analysis. Zhengrong Wei conceived and supervised the study and reviewed and edited the manuscript.
致谢
This work was supported by the National Natural Science Foundation of China (No. 82560570) and the Science and Technology Program of Jiangxi Provincial Administration of Traditional Chinese Medicine (Grant No. SZYYB20245782).
材料
| 姓名 | 公司 | 目录编号 | 评论 |
|---|---|---|---|
| ABI StepOnePlus Real-Time PCR System | Applied Biosystems | N/A | qRT-PCR instrument |
| Annexin V-FITC/PI Apoptosis Detection Kit | Vazyme | A211-02 | Flow cytometric apoptosis assay |
| BD FACSCanto II Flow Cytometer | BD Biosciences | N/A | Apoptosis analysis |
| Dulbecco’s Modified Eagle’s Medium (DMEM) | Thermo Fisher Scientific | 12491015 | Cell culture medium |
| Fetal Bovine Serum (FBS) | Sigma-Aldrich | F4135 | Final concentration: 10% |
| FlowJo | BD Biosciences | N/A | Flow cytometry data analysis |
| GraphPad Prism | GraphPad Software | N/A | Version 9.0 |
| Human IFN-γ ELISA Kit | Thermo Fisher Scientific | KHC4021 | Cytokine measurement |
| Human IL-10 ELISA Kit | Thermo Fisher Scientific | 88-7106-88 | Cytokine measurement |
| Human IL-4 ELISA Kit | Thermo Fisher Scientific | KHC0041 | Cytokine measurement |
| Human TNF-β ELISA Kit | Thermo Fisher Scientific | BMS202 | Cytokine measurement |
| Lipofectamine 2000 | Thermo Fisher Scientific | 11668027 | siRNA transfection reagent |
| Penicillin–Streptomycin Solution | Thermo Fisher Scientific | 15240062 | Final concentrations: 100 U/mL penicillin and 100 µg/mL streptomycin |
| R Statistical Software | R Foundation for Statistical Computing | N/A | Version 4.0+ |
| Reverse Transcription Kit | Takara | R026A | cDNA synthesis |
| siRNA Negative Control (si-NC) | RiboBio | N/A | Non-targeting siRNA |
| SYBR Green PCR Master Mix | Thermo Fisher Scientific | 4309155 | qRT-PCR |
| TRIzol Reagent | Thermo Fisher Scientific | 10296010 | Total RNA extraction |
| U251 Human Glioma Cell Line | FuHeng Cell Center | N/A | RRID: CVCL_0021 |
| U87 Human Glioma Cell Line | FuHeng Cell Center | N/A | RRID: CVCL_0022 |
| VCAM1-Targeting siRNA | RiboBio | N/A | Sequence: 5′-GGAGUACUUGAACAUCCUU-3′ |
参考文献
- Xu S, et al. Immunotherapy for glioma: Current management and future application. Cancer Lett. 2020;476:1-12.
- Yasinjan F, et al. Immunotherapy: a promising approach for glioma treatment. Front Immunol. 2023;14:1255611.
- Schaff LR, Mellinghoff IK. Glioblastoma and other primary brain malignancies in adults: a review. JAMA. 2023;329(7):574-587.
- Kalluri AL, et al. Implications of molecular classifications in glioma surgery. J Neurooncol. 2025;171(3):559-569.
- Zeng Z, et al. NcRNAs: multi-angle participation in the regulation of glioma chemotherapy resistance. Int J Oncol. 2022;60(6).
- Mao F, et al. LRIG proteins in glioma: functional roles, molecular mechanisms, and potential clinical implications. J Neurol Sci. 2017;383:56-60.
- Wang LB, et al. Proteogenomic and metabolomic characterization of human glioblastoma. Cancer Cell. 2021;39(4):509-528.
- Alifieris C, Trafalis DT. Glioblastoma multiforme: pathogenesis and treatment. Pharmacol Ther. 2015;152:63-82.
- Wang G, Wang W. Advanced cell therapies for glioblastoma. Front Immunol. 2022;13:904133.
- Khan F, et al. Macrophages and microglia in glioblastoma: heterogeneity, plasticity, and therapy. J Clin Invest. 2023;133(1).
- Berger G, et al. STING activation promotes robust immune response and NK cell-mediated tumor regression in glioblastoma models. Proc Natl Acad Sci U S A. 2022;119(28):e2111003119.
- White J, et al. The tumour microenvironment, treatment resistance and recurrence in glioblastoma. J Transl Med. 2024;22(1):540.
- Lee AH, et al. Neoadjuvant PD-1 blockade induces T cell and cDC1 activation but fails to overcome the immunosuppressive tumor-associated macrophages in recurrent glioblastoma. Nat Commun. 2021;12(1):6938.
- van Hooren L, et al. CD103(+) regulatory T cells underlie resistance to radio-immunotherapy and impair CD8(+) T cell activation in glioblastoma. Nat Cancer. 2023;4(5):665-681.
- Lin H, et al. Understanding the immunosuppressive microenvironment of glioma: mechanistic insights and clinical perspectives. J Hematol Oncol. 2024;17(1):31.
- Kong DH, et al. Emerging roles of vascular cell adhesion molecule-1 (VCAM-1) in immunological disorders and cancer. Int J Mol Sci. 2018;19(4).
- Guo Q, et al. Liver sinusoidal endothelial cell expressed vascular cell adhesion molecule 1 promotes liver fibrosis. Front Immunol. 2022;13:983255.
- Deddens LH, et al. Imaging neuroinflammation after stroke: current status of cellular and molecular MRI strategies. Cerebrovasc Dis. 2012;33(4):392-402.
- Zhang S, et al. Radial glial cell-derived VCAM1 regulates cortical angiogenesis through distinct enrichments in the proximal and distal radial processes. Cereb Cortex. 2020;30(6):3717-3730.
- Wang Y, et al. Intratumoral erythroblastic islands restrain anti-tumor immunity in hepatoblastoma. Cell Rep Med. 2023;4(5):101044.