This protocol describes a method integrating motivational interviewing with bedside activities of daily living training to support the rehabilitation of patients with post-stroke depression, with a focus on improving functional independence and psychological engagement.
需要JoVE订阅才能观看此内容。 请登录或开始免费试用
方法文章
Effects of MI-Guided Bedside ADL Training on Functional and Emotional Outcomes In Post-Stroke Depression: A Retrospective Cohort Study
* These authors contributed equally
本文内容
摘要
摘要
Post-stroke depression (PSD) impedes recovery and is often insufficiently addressed by conventional rehabilitation. This retrospective cohort study presents a structured protocol for integrating motivational interviewing (MI) with bedside activities of daily living (ADL) training, including standardized bedside rehabilitation procedures and repeated functional and psychological assessments in PSD patients. In a retrospective cohort of 174 patients, participants were assigned to either an MI-guided ADL training group or a conventional rehabilitation group. Functional independence, emotional status, and serum monoamine neurotransmitter levels were assessed at multiple time points using standardized scales and biochemical analysis. The results showed that the MI-ADL group was associated with improved functional and emotional outcomes compared with the conventional rehabilitation group, accompanied by increased levels of key monoamine neurotransmitters: 5-hydroxytryptamine (5-HT), norepinephrine (NE), and dopamine (DA). This protocol provides a structured and reproducible bedside rehabilitation approach for combining psychological motivation with functional rehabilitation. However, as this was a retrospective cohort study, these findings are hypothesis-generating, and further prospective studies are needed to confirm causal relationships.
引言
Post-stroke depression (PSD) is the most common neuropsychiatric complication among stroke patients, affecting approximately one-third of stroke survivors1,2. Its clinical manifestations are complex. Besides typical depressive symptoms, it often involves cognitive decline, sleep disorders, and other complex presentations, which seriously affect patients' enthusiasm for recovery, delay neurological recovery, and increase family and societal burdens3,4,5. To address these challenges, this protocol describes a method integrating motivational interviewing (MI) with bedside activities of daily living (ADL) training, with the overall goal of improving functional independence and emotional outcomes in PSD patients.
Multiple studies have suggested a statistically significant association between post-stroke depressive symptoms and limitations in basic or instrumental activities of daily living6,7,8.
At present, clinical management of PSD mainly relies on drug therapy and conventional rehabilitation training9. However, antidepressant drugs have variable efficacy and potential side effects, while conventional rehabilitation can improve physical function but often provides limited support for psychological motivation. Compared with drug-only treatment, psychological therapy alone, or standard rehabilitation without integrated mental health support, this combined method targets both mood and daily function simultaneously10,11.
MI is a patient-centered psychological counseling method that uses specific communication strategies to help patients resolve conflicting emotions during behavioral changes and enhance their intrinsic motivation12. The main focus of this protocol is the method of MI‑guided bedside ADL training, delivered within a structured clinical rehabilitation setting. Combining it with bedside ADL training may yield a synergistic effect, improving physical function and enhancing psychological engagement. However, the effectiveness and mechanism of this integrated approach still need to be verified13,14.
Based on the monoamine neurotransmitter hypothesis of depression, dysfunction of the 5‑HT, NE, and DA systems is a key physiological basis of depression15,16. To explore whether MI‑guided ADL is associated with changes in these systems through psychological-neural pathways, this study compared outcomes between the MI‑guided protocol and conventional rehabilitation. The method integrates motivational interviewing into bedside ADL training and includes multi‑time‑point neurotransmitter monitoring to assess potential mechanisms.
This study employed a retrospective cohort design to compare the MI-guided ADL training protocol with conventional rehabilitation in patients with post-stroke depression (PSD). The primary hypothesis was that the MI-ADL group would be associated with greater improvements in functional independence (measured by the Modified Barthel Index), depressive symptoms (measured by the Hamilton Depression Rating Scale and Self-Rating Depression Scale), and serum levels of monoamine neurotransmitters (5-HT, NE, DA) compared with the conventional rehabilitation group, and that these differences would be sustained at 6‑month follow‑up. The secondary hypothesis was that the MI-ADL protocol would demonstrate acceptable safety and feasibility. This study is expected to provide clinical and mechanistic evidence for the integrated approach and to inform future prospective research.
This protocol incorporates multi‑time‑point assessment of functional performance, emotional status, and serum neurotransmitter levels to evaluate the effectiveness of the integrated approach. This method is designed for clinicians, rehabilitation specialists, and clinical researchers who manage patients with post‑stroke depression (PSD). It provides a structured and reproducible strategy that integrates psychological and functional rehabilitation.
The potential of this method includes improving patient motivation and adherence, enhancing activities of daily living, and enabling mechanism-based evaluation through neurotransmitter monitoring. By addressing both physical and psychological aspects of recovery, it supports more comprehensive and individualized patient care than conventional rehabilitation.
访问受限。请登录或开始试用以查看此内容。
方案
Ethical Statement:
This study was approved by the Ethics Committee of the Fujian University of Traditional Chinese Medicine Affiliated Rehabilitation Hospital (Approval No.: 2023KY-046-002). All procedures adhered strictly to the principles of the Declaration of Helsinki. Because this study involved only retrospective analysis of de-identified data extracted from routine electronic medical records, the Ethics Committee granted a waiver of individual informed consent for research purposes. All patients had provided general written consent for the use of their medical records for clinical research at the time of hospital admission, as required by institutional policy. Patient privacy and data security were protected by storing all personal information using anonymous coding methods, and access to research data was granted only to authorized researchers. Research data will be retained for 5 years after study completion and then destroyed in accordance with institutional regulations.
1. Research Subjects and Study Design
- Identify the eligible study population
- Conduct a retrospective cohort study.
NOTE: This study was purely observational and retrospective. No prospective allocation or experimental assignment of rehabilitation modalities was performed. All rehabilitation procedures were conducted as part of routine clinical care, and treatment exposure was identified retrospectively from electronic medical records. - Access the electronic medical record system of Fujian University of Traditional Chinese Medicine Affiliated Rehabilitation Hospital. Retrieve all medical records of patients diagnosed with post-stroke depression (PSD) who were hospitalized between July 2023 and December 2025.
- Apply the predefined inclusion and exclusion criteria to screen all retrieved records. Identify and select all cases that meet the eligibility criteria for further analysis.
- Review the rehabilitation methods documented in each patient’s medical record. 1.1.5. Assign patients who received motivational interviewing (MI) combined with bedside activities of daily living (ADL) training to the MI-ADL group.
- Assign patients who received only conventional rehabilitation treatment to the conventional rehabilitation group.
- Confirm sample size and grouping. Ensure that each group includes 87 patients. Confirm that a total of 174 eligible patients are included in the final analysis. Refer to Figure 1 for the study grouping and patient selection workflow.
- Conduct a retrospective cohort study.
- Participant Selection and Group Formation
- Screen all electronic medical records (EMR) of patients diagnosed with post-stroke depression (PSD) who were hospitalized at Fujian University of Traditional Chinese Medicine Affiliated Rehabilitation Hospital between July 2023 and December 2025.
- Screen a total of 286 patient records. Apply the inclusion and exclusion criteria to all screened records. Exclude 112 records after eligibility assessment.
- Exclude 78 records that do not meet the inclusion criteria, including age outside 40–75 years, absence of neuroimaging confirmation, or hospitalization duration of less than 6 weeks.
- Exclude 24 patients who declined participation according to the clinical records. Exclude 10 records with incomplete medical records or missing key assessment data. Include the remaining 174 eligible patients for analysis.
- Review the rehabilitation exposure documented retrospectively in each patient’s electronic medical record.
NOTE: Classify the eligible patients retrospectively into two naturally occurring cohorts based on the rehabilitation protocol documented in the electronic medical records during hospitalization. - Assign patients who received motivational interviewing-guided bedside activities of daily living (ADL) training to the MI ADL group (n = 94).
- Assign patients who received conventional ADL training without any motivational interviewing component to the conventional rehabilitation group (n = 156).
- Perform 1:1 propensity score matching (PSM) using a caliper value of 0.02 to reduce confounding, minimize selection bias, and improve baseline comparability between the two retrospective cohorts.
NOTE: The rehabilitation modality received by each patient was determined during routine clinical care and was not assigned by the investigators. - Include age, sex, stroke type (ischemic/hemorrhagic), time from stroke onset to enrollment (days), baseline Hamilton Depression Rating Scale-17 (HAMD-17) score, and baseline Modified Barthel Index (MBI) score as matching covariates.
- Generate 87 matched pairs after propensity score matching.
The final propensity score-matched cohort consisted of 87 patients in the MI ADL group and 87 patients in the conventional rehabilitation group (total N = 174). - Include patients with a stroke diagnosis confirmed by neuroimaging. Include patients who meet diagnostic criteria for post-stroke depression (PSD). Select patients aged 40–75 years with a hospitalization period of at least 6 weeks and complete medical records17,18.
NOTE: Use the 40–75-year age range to support clinical representativeness while reducing confounding from uncommon stroke etiologies in younger patients and comorbidities, cognitive decline, or reduced communication ability in older patients. - Exclude patients with severe cognitive impairment or aphasia that affects effective communication. Exclude patients with other severe physical diseases. Exclude patients with incomplete medical records or missing key data19,20.
- Extract all basic clinical characteristics, intervention plans, and assessment data for the included cases from the electronic medical record system.
- Verify the completeness of all extracted data.
- Refer to the participant flowchart (Figure 1) for a visual summary of the screening, exclusion, matching, and final sample derivation.
- Treatment: Conventional rehabilitation group
- Administer a standardized 6-week rehabilitation plan according to the hospital’s established clinical pathway for post-stroke depression (PSD). Provide physical therapy focused on motor function, balance, and transfer training21.
- Apply neurodevelopmental therapy techniques to regulate abnormal muscle tone. Conduct joint range-of-motion training to prevent contractures.
- Perform sitting-to-standing balance training and indoor walking training according to each patient’s functional level. Deliver physical therapy for 30 min per session, once daily, 5 times per week22.
- Provide occupational therapy to improve activities of daily living (ADL). Include training in personal self-care activities and simulated household and community activities.
- Deliver occupational therapy for 30 min per session, once daily, 5 times per week. Provide routine psychological support concurrently with physical and occupational therapy.
- Deliver psychological support through basic psychological counseling, rehabilitation encouragement, and health education. Cover disease explanation, confidence building, and emotional support during psychological support.
- Use a supportive and instructive communication style throughout routine psychological support. Do not use a structured psychotherapeutic model for this support component.
- Treatment: MI-ADL group
- Provide motivational interviewing (MI)-guided personalized bedside ADL training in addition to conventional rehabilitation.
- Ensure that all therapists delivering the MI-ADL intervention have passed standardized assessments verifying accurate and consistent application of MI techniques.
- Administer the MI-ADL intervention for 6 weeks, with 3 sessions per week and 45 min per session. Structure each MI-ADL session into four consecutive stages.
- Establish a therapeutic alliance with the patient during the engagement stage for 5–10 min using empathic communication. Use the decisional balance technique during the focused exploration stage for 10–15 min to help the patient clarify specific and feasible ADL goals.
- Guide the patient during the focused exploration stage to explore ambivalent psychological aspects of behavior change. Use strategic questioning during the evocation stage for 10–15 min to evoke and strengthen the patient’s internal motivation for change.
- Reinforce the patient’s sense of self-efficacy during the evocation stage. Collaboratively formulate a step-by-step ADL training plan with the patient during the planning stage for 10–15 min.
- Immediately initiate practical implementation of the ADL training plan to convert motivation into concrete action23,24,25.
- Detection indicators
- Functional independence evaluation
- Use the Modified Barthel Index (MBI) as the standardized assessment tool for evaluating activities of daily living26.
- Assess feeding, bathing, grooming, dressing, bowel control, bladder control, toilet use, chair/bed transfer, ambulation on a level surface, and stair climbing. Score each item according to the degree of assistance required to complete the task.
- Calculate the total MBI score from 0 to 100 points. Classify a score of 100 as complete self-care, 75–95 as mild functional impairment, 50–70 as moderate functional impairment, 25–45 as severe functional impairment, and 0–20 as total dependence.
- Assign trained rehabilitation therapists to conduct the assessment. Perform the assessment through patient and caregiver interviews combined with direct observation of patient performance.
- Emotional status assessment indicators: Hamilton Depression Scale (HAMD)27:
- Use the 17-item Hamilton Depression Rating Scale (HAMD) to assess depressive symptom severity.
- Evaluate the following symptom domains: depressed mood, guilt feelings, suicide, initial insomnia, middle insomnia, late insomnia, work and interests, retardation, agitation, psychic anxiety, somatic anxiety, gastrointestinal symptoms, general somatic symptoms, genital symptoms, hypochondriasis, weight loss, and insight.
- Apply a 5-point scoring system (0–4) for most HAMD items. Assign a score of 0 for absent symptoms, 1 for mild symptoms, 2 for moderate symptoms, 3 for severe symptoms, and 4 for very severe symptoms.
- Apply a 3-point scoring system (0–2) for the HAMD items designed for 3-point evaluation. Assign a score of 0 for absent symptoms, 1 for mild-to-moderate symptoms, and 2 for severe symptoms for the 3-point items.
- Calculate the total HAMD score for each patient after completion of all item assessments.
- Interpret total HAMD scores according to the following criteria: interpret scores >35 as potentially indicating severe depression, scores >20 as indicating mild-to-moderate depression, and scores <8 as indicating absence of depressive symptoms.
- Assign psychiatrists or psychotherapists who have received standardized and consistent training to administer the HAMD assessment.
- Conduct all HAMD assessments using structured interviews to ensure assessment objectivity, consistency, and accuracy.
- Emotional status assessment indicators: Zung Self-rating Depression Scale (SDS)28
- Use the Zung Self-Rating Depression Scale (SDS) to evaluate patients’ subjective depressive symptoms experienced during the previous week. Use the SDS to assess patients’ subjective emotional experience related to depression.
- Administer the 20-item SDS questionnaire covering four symptom domains: pervasive affective disturbances, physiological disturbances, psychomotor disturbances, and psychological disturbances.
- Score each SDS item using a 4-point scale ranging from 1 to 4. Reverse-score the 10 designated reverse-scored SDS items before calculating the total score.
- Calculate the raw SDS score by summing the scores of all 20 items. Multiply the raw SDS total score by 1.25 to obtain the standard score. Round the calculated standard score to the nearest whole number.
- Interpret the SDS standard score according to the Chinese norm criteria.
- Define the SDS cut-off value for depression screening as 53 points. Classify SDS standard scores between 53 and 62 as mild depression, scores between 63 and 72 as moderate depression, and scores above 72 as severe depression.
- Instruct patients to complete the SDS questionnaire independently in a quiet environment. Read each SDS item aloud when patients are unable to complete the questionnaire independently because of physical limitations.
- Record patients’ verbal responses accurately when assessor-assisted SDS administration is required.
- Neurochemical observation indicators
- Collect all blood samples between 7:00 and 9:00 in the morning after patients have fasted for 12 h. Use standardized fasting morning collection procedures to minimize potential interference from circadian rhythm variation and dietary factors.
- Draw a 5 mL venous blood sample from the patient’s antecubital vein. Transfer the collected blood sample into a serum-separating vacuum blood collection tube without anticoagulant.
- Allow the blood sample to stand at room temperature for 30 min to permit natural coagulation. Centrifuge the coagulated blood sample at 1510 × g for 15 min at 4 °C.
- Separate the upper serum layer immediately after centrifugation. Aliquot the separated serum into labelled 1.5 mL microcentrifuge tubes (generic descriptor; specific product information is provided in the Table of Materials).
- Store all serum aliquots in an ultra-low-temperature freezer at −80 °C until batch testing and analysis.
Pause point: One can take a pause here during this process. - Quantify serum levels of 5-hydroxytryptamine (5-HT), norepinephrine (NE), and dopamine (DA) using a High-Performance Liquid Chromatography coupled with Electrochemical Detection (HPLC-ECD) system. Perform all analytical procedures according to the laboratory’s established Standard Operating Procedures.
- Perform chromatographic separation using a C18 reversed-phase column (4.6 mm × 250 mm, 5 µm particle size).
- Maintain the chromatographic column temperature at 35 °C throughout the analysis.
- Prepare the mobile phase using 100 mmol·L-1 sodium acetate, 85 mmol·L-1 citric acid, 0.4 mmol·L-1 di-n-butylamine, 1.5 mmol·L-1 sodium octanesulfonate, 0.2 mmol·L-1 ethylenediaminetetraacetic acid (EDTA), and 18% (v/v) methanol.
- Adjust the mobile phase pH to 4.5 using phosphoric acid. Filter the freshly prepared mobile phase through a 0.22 µm membrane before use.
- Degas the filtered mobile phase using ultrasonication before chromatographic analysis. Set the chromatographic flow rate to 0.9 mL·min-1.
- Use an injection volume of 20 µL for each sample. Set the total chromatographic run time to 30 min per sample.
- Use an amperometric electrochemical detector (DECADE II, Antec Scientific, Zoeterwoude, Netherlands) equipped with a glassy carbon working electrode and an Ag/AgCl reference electrode.
- Set the detector potential to +0.65 V. Set the detector sensitivity to 1 µA full scale. Use 3,4-dihydroxybenzylamine (DHBA, 100 ng·mL-1) as the internal standard. Spike each serum sample with a fixed concentration of DHBA before injection to correct for recovery and matrix effects.
- Include quality-control samples containing low, medium, and high concentrations of 5-HT, NE, and DA at the beginning, middle, and end of each assay run. Use the quality-control samples to ensure assay accuracy, precision, and inter-run comparability.
- Use limits of detection (LOD) of 0.5 nmol·L-1 for 5-HT, 0.3 nmol·L-1 for NE, and 0.3 nmol·L-1 for DA. Use limits of quantification (LOQ) of 2.0 nmol·L-1 for 5-HT, 1.0 nmol·L-1 for NE, and 1.0 nmol·L-1 for DA.
- Study Timeline and Blinding Procedure
- Conduct all scale assessments, including the Modified Barthel Index (MBI), Hamilton Depression Rating Scale (HAMD), and Zung Self-Rating Depression Scale (SDS), at four predetermined assessment time points.
- Complete the initial baseline assessment before the start of the intervention period.
- Conduct the first post-intervention assessment at 4 weeks after the start of the intervention.
- Conduct the second post-intervention assessment at 6 weeks after the start of the intervention and use this assessment as the endpoint evaluation for the intervention period.
- Conduct the long-term follow-up assessment at 6 months after the start of the intervention.
- Collect serum samples at three predetermined time points for neurochemical analysis.
- Obtain the first serum sample before the start of the intervention period as the baseline specimen.
- Collect the second serum sample 4 weeks after the start of the intervention.
- Collect the final serum sample 6 weeks after the start of the intervention and use this collection as the endpoint specimen assessment.
- Blind all assessors responsible for data extraction and outcome analysis to patient group allocation to minimize assessment bias. Remove all rehabilitation-group identifiers, including “MI-ADL” and “conventional rehabilitation,” from the electronic medical record dataset during data extraction.
- Replace all original group identifiers with coded labels, including “Group A” and “Group B,” before data analysis. Assign a separate researcher who is not involved in data extraction or statistical analysis to maintain the group-code linkage key.
- Provide the statistician only with the coded dataset for all statistical analyses, including repeated-measures analysis of variance (ANOVA).
- Perform all statistical analyses without disclosure of actual patient group identities to the statistician. Maintain the blinding procedure until completion of all statistical analyses.
- Functional independence evaluation
- Follow-up data collection
- Data sources
- Collect all follow-up data from the hospital’s electronic medical record system and post-discharge management files.
- Obtain follow-up information from assessment records completed during hospitalization, outpatient review appointments, and telephone follow-ups conducted after discharge.
- Follow-up time points and windows
- Collect follow-up data at four predetermined time points to assess the sustainability and safety of the interventions. Complete the baseline assessment (T0) within 1 week before the start of the intervention.
- Conduct the first short-term follow-up assessment (T1) at 4 weeks ± 3 days after the start of the intervention.
- Conduct the second short-term follow-up assessment and endpoint assessment (T2) at 6 weeks ± 3 days after the start of the intervention.
- Conduct the long-term follow-up assessment (T3) at 6 months ± 7 days after the start of the intervention.
- Follow-up indicators
- Record dynamic changes in functional independence, emotional state, and quality of life at each follow-up time point. Record adverse events and recurrence events throughout the follow-up period.
- Data sources
- Sample size calculation
- Perform a post hoc power analysis using G*Power software to assess the statistical power of the observed sample size.
- Use an odds ratio (OR) of 3.5 for the association between depression and stroke outcomes based on a prior prospective epidemiological study29.
- Apply a two-sided significance level (α) of 0.05 for the power analysis.
- Include the final matched sample consisting of 87 patients per group (total N = 174) in the analysis.
- Confirm that the post hoc power calculation provides > 95% power to detect an effect of this magnitude.
- Verify that the sample size is adequate for the primary outcome analyses.
- Statistical methods
- Conduct all statistical analyses using SPSS software. Set the two-tailed significance level at α = 0.05. Consider differences statistically significant when p < 0.05.
- Test the normality of continuous variables, including MBI, HAMD, SDS scores, and neurotransmitter levels, using the Shapiro-Wilk test.
- Report normally distributed measurement data as mean ± standard deviation. Report count data as number (percentage).
- Use two-sample t-tests for between-group comparisons of normally distributed continuous variables, including age, baseline MBI score, and time from stroke onset to admission.
- Use the chi-square test or Fisher’s exact test, as appropriate, for categorical variables, including proportion of PSD onset, hypertension, diabetes, stroke type, lesion side, antidepressant use, and adverse reactions.
- Apply repeated-measures analysis of variance (ANOVA) to evaluate the time effect, group effect, and time × group interaction effect for the main outcome (MBI), serum neurotransmitters, HAMD, and SDS scores measured repeatedly at T0, T1, T2, and T3.
- Perform simple effect analysis when a significant group × time interaction effect is detected.
- Adjust P-values using the Bonferroni correction during simple effect analysis.
- Perform between-group comparisons at each time point using two-sample t-tests when normality and homogeneity of variance assumptions are met including T0–T3 for clinical scales and T0–T2 for serum neurotransmitters.
NOTE: Perform between-group comparisons at T0–T3 for clinical scales and at T0–T2 for serum neurotransmitters. - Categorize clinical efficacy according to the HAMD-17 score reduction rate from baseline to week 6.
- Define a significant effect as a HAMD-17 score reduction ≥ 50%.
- Define an effective outcome as a HAMD-17 score reduction of 25%–49%.
- Define an invalid outcome as a HAMD-17 score reduction < 25%.
- Use the chi-square test to compare the distribution of efficacy categories between groups.
- Report effect sizes for repeated-measures ANOVA as partial η2.
- Interpret partial η2 values ≥ 0.01 as small effects, ≥ 0.06 as medium effects, and ≥ 0.14 as large effects.
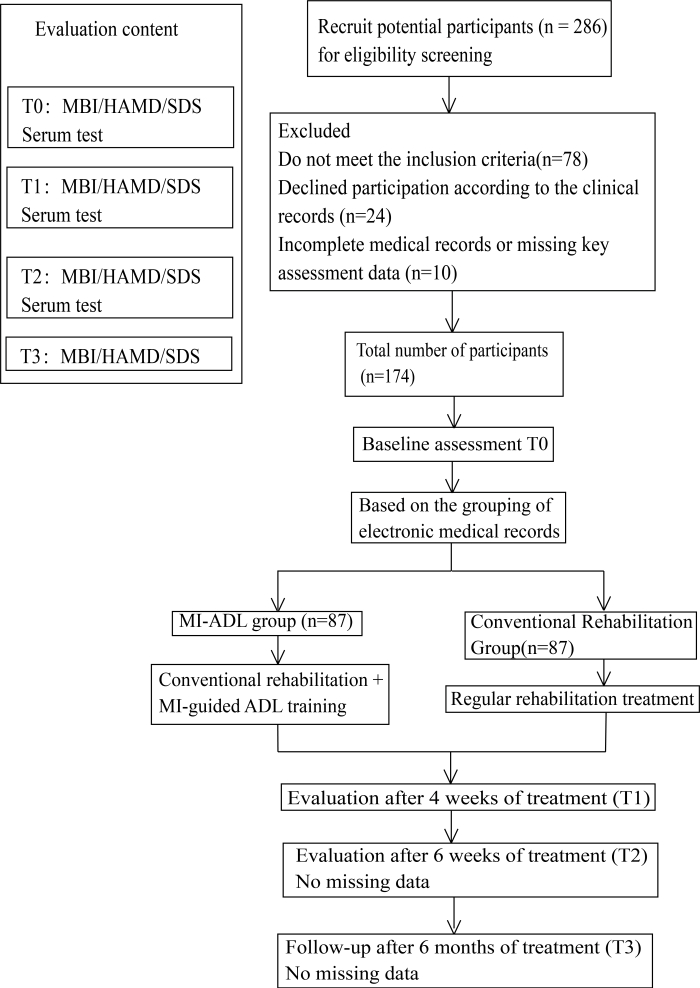
Figure 1: Flowchart of patient selection, grouping, and assessment time points.Flowchart showing patient screening, exclusion, enrollment, group allocation, intervention period, and follow-up assessments. A total of 286 patients with post-stroke depression were screened, and 174 eligible patients were assigned to either the MI-guided activities of daily living (MI-ADL) rehabilitation group or the conventional rehabilitation group. Outcome assessments were performed at baseline (T0), 4 weeks (T1), 6 weeks (T2), and 6 months (T3). Please click here to view a larger version of this figure.
访问受限。请登录或开始试用以查看此内容。
结果
Participant Flow and Baseline Comparability
A total of 286 medical records of patients with PSD were screened. After applying the inclusion and exclusion criteria, 112 records were excluded (78 did not meet inclusion criteria, 24 declined participations according to clinical records, and 10 had incomplete data). The remaining 174 patients were enrolled and underwent 1:1 propensity score matching, resulting in 87 patients in the MI‑ADL group and 87 patients in the conventional rehabilitation g...
访问受限。请登录或开始试用以查看此内容。
讨论
In this retrospective cohort study, MI-guided bedside ADL training was associated with significantly greater improvements in functional independence (MBI), depressive symptoms (HAMD-17 and SDS), and serum levels of monoamine neurotransmitters (5‑HT, NE, DA) compared with conventional rehabilitation. These improvements were sustained at the 6‑month follow‑up. Consistent with previous reports describing the clinical burden of PSD and its negative impact on rehabilitation outcomes30...
访问受限。请登录或开始试用以查看此内容。
致谢
Funding was provided by Fujian Provincial Guided Science and Technology Program in 2023(2023Y0037).
Consent to Publish
The manuscript has neither been previously published nor is under consideration by any other journal. The authors have all approved the paper's content.
访问受限。请登录或开始试用以查看此内容。
材料
| 姓名 | 公司 | 目录编号 | 评论 |
|---|---|---|---|
| 1.5 mL microcentrifuge tube (labeled, sterile) | Eppendorf (Hamburg, Germany) / Sigma-Aldrich | EP022600028 (North America) | Generic descriptor “1.5 mL microcentrifuge tube” used in text; Eppendorf tube |
| 3,4-Dihydroxybenzylamine (DHBA) internal standard | Sigma-Aldrich (St. Louis, MO, USA) | 377679 | Internal standard for HPLC-ECD |
| 5-Hydroxytryptamine (5-HT) standard | Sigma-Aldrich (St. Louis, MO, USA) | H9523 | Reference standard for HPLC-ECD |
| Dopamine (DA) standard | Sigma-Aldrich (St. Louis, MO, USA) | H8502 | Reference standard for HPLC-ECD |
| Electrochemical Detection (HPLC-ECD) system | Agilent Technologies, Santa Clara, CA, USA | Agilent 1260 Infinity II | |
| G*Power software (version 3.1.9.7) | Heinrich-Heine-Universität Düsseldorf, Germany | Software (no catalog number) | RRID:SCR_013726 (for G*Power v3.1) |
| Mobile phase components (sodium acetate, citric acid, di-n-butylamine, sodium octanesulfonate, EDTA, methanol, phosphoric acid) | Sigma-Aldrich / Merck / Sinopharm (various) | No single catalog number (standard laboratory reagents) | Reagents for HPLC-ECD mobile phase |
| Norepinephrine (NE) standard | Sigma-Aldrich (St. Louis, MO, USA) | A9512 | Reference standard for HPLC-ECD |
| Serum-separating vacuum blood collection tube (5 mL) | BD (Becton, Dickinson and Company, Franklin Lakes, NJ, USA) | 367986 (5 mL, PET plastic, gold Hemogard closure, SST™ gel separator) | Alternative cat. nos. 367983 (3.5 mL) or 367955 also suitable |
| SPSS software (version 25.0) | IBM Corp. (Armonk, NY, USA) | Software (no catalog number) | RRID:SCR_002865 |
| ZORBAX SB-C18 reversed-phase column | Agilent Technologies | chromatographic separation column |
参考文献
- Liu, L., Xu, M., Marshall, I. J., Wolfe, C. D., Wang, Y., O’Connell, M. D. Prevalence and natural history of depression after stroke: a systematic review and meta-analysis of observational studies. PLoS Medicine. 20 (3), e1004200 (2023).
- Ignacio, K. H. D. et al. Prevalence of depression and anxiety symptoms after stroke in young adults: a systematic review and meta-analysis. Journal of Stroke and Cerebrovascular Diseases. 33 (7) (2024).
- Ja’afar, N. L., Mustapha, M., Mohamed, M., Hashim, S. A review of post-stroke cognitive impairment and the potential benefits of stingless bee honey supplementation. Malaysian Journal of Medical Sciences. 31 (3), 75–91 (2024).
- Robinson, R. G., Jorge, R. E., Starkstein, S. E. Poststroke depression: an update. Journal of Neuropsychiatry and Clinical Neurosciences. 36 (1), 22–35 (2024).
- Maggio, M. G. et al. Understanding the family burden and caregiver role in stroke rehabilitation: insights from a retrospective study. Neurological Sciences. 45 (11), 5347–5353 (2024).
- Mohammed, S., Haidar, J., Ayele, B. A., Yifru, Y. M. Post-stroke limitations in daily activities: experience from a tertiary care hospital in Ethiopia. BMC Neurology. 23 (1), 364 (2023).
- Andrenelli, E. et al. Features and predictors of activity limitations and participation restriction 2 years after intensive rehabilitation following first-ever stroke. European Journal of Physical and Rehabilitation Medicine. 51 (5), 575–585 (2015).
- Gobezie, M. et al. Post-stroke limitations on activities of daily living and associated factors in public tertiary hospitals in Amhara regional state, Ethiopia: a multicenter cross-sectional study. Health Science Reports. 9 (2), e71884 (2026).
- Zhao, F. et al. Clinical practice guidelines for post-stroke depression in China. Brazilian Journal of Psychiatry. 40 (3), 325–334 (2018).
- Kalbouneh, H. M., Toubasi, A. A., Albustanji, F. H., Obaid, Y. Y., Al-Harasis, L. M. Safety and efficacy of SSRIs in improving poststroke recovery: a systematic review and meta-analysis. Journal of the American Heart Association. 11 (13), e025868 (2022).
- Verrienti, G., Raccagni, C., Lombardozzi, G., De Bartolo, D., Iosa, M. Motivation as a measurable outcome in stroke rehabilitation: a systematic review of the literature. International Journal of Environmental Research and Public Health. 20 (5), 4187 (2023).
- Emery, R. L., Wimmer, M. Motivational Interviewing. StatPearls Publishing,. Treasure Island, FL (2026).
- Nguyen, T. T. P., Hoang, H. B., Vu, H. T. T. Effectiveness of multifaceted interventions including motivational interviewing and home-based rehabilitation program for improving mental and physical health in stroke patients: a randomized controlled trial. International Journal of Nursing Studies Advances. 7, 100259 (2024).
- Zhu, S. et al. Effectiveness of behavioural interventions with motivational interviewing on physical activity outcomes in adults: systematic review and meta-analysis. BMJ. (2024).
- Cui, L. et al. Major depressive disorder: hypothesis, mechanism, prevention and treatment. Signal Transduction and Targeted Therapy. 9 (1), 30 (2024).
- Li, S. J. et al. Nucleus accumbens deep brain stimulation improves depressive-like behaviors through BDNF-mediated alterations in brain functional connectivity of dopaminergic pathway. Neurobiology of Stress. (2023).
- Shiraishi, R. et al. Association between sarcopenic obesity and changes in skeletal muscle mass and quality in patients with stroke who undergo convalescent rehabilitation. JMA Journal. 8 (2), 517–525 (2025).
- Pan, C. et al. Psychopathological network for early-onset post-stroke depression symptoms. BMC Psychiatry. 23 (1), 114 (2023).
- Ibic, M. et al. Cognitive and emotional impairments in acute post-stroke patients: a cross-sectional study. Medicina. 61 (10), 1739 (2025).
- Stahl, B. et al. Intensive social interaction for treatment of poststroke depression in subacute aphasia: the CONNECT trial. Stroke. 53 (12), 3530–3537 (2022).
- Shahid, J., Kashif, A., Shahid, M. K. A comprehensive review of physical therapy interventions for stroke rehabilitation: impairment-based approaches and functional goals. Brain Sciences. 13 (5), 717 (2023).
- An, H. S., Kim, D. J. Effects of activities of daily living-based dual-task training on upper extremity function, cognitive function, and quality of life in stroke patients. Osong Public Health and Research Perspectives. 12 (5), 304–313 (2021).
- Chen, H. M., Lee, H. L., Yang, F. C., Chiu, Y. W., Chao, S. Y. Effectiveness of motivational interviewing in regard to activities of daily living and motivation for rehabilitation among stroke patients. International Journal of Environmental Research and Public Health. 17 (8), 2755 (2020).
- Substance Abuse and Mental Health Services Administration. Enhancing Motivation for Change in Substance Use Disorder Treatment: Updated 2019. Substance Abuse and Mental Health Services Administration, Rockville, MD. (2019).
- Bischof, G., Bischof, A., Rumpf, H. J. Motivational interviewing: an evidence-based approach for use in medical practice. Deutsches Ärzteblatt International. 118 (7), 109–115 (2021).
- Santos Barros, V. dos et al. Barthel index is a valid and reliable tool to measure the functional independence of cancer patients in palliative care. BMC Palliative Care. 21 (1), 124 (2022).
- Wang, X., Xie, Z., Du, G. Research on the intervention effect of vibroacoustic therapy in the treatment of patients with depression. International Journal of Mental Health Promotion. 26 (2), 149–160 (2024).
- Liu, L. et al. The gaps between the self and professional evaluation in mental health assessment of COVID-19 cluster cases. Frontiers in Psychology. 12, 614193 (2021).
- Whyte, E. M., Mulsant, B. H., Vanderbilt, J., Dodge, H. H., Ganguli, M. Depression after stroke: a prospective epidemiological study. Journal of the American Geriatrics Society. 52 (5), 774–778 (2004).
- Liu, L. et al. Natural history of depression up to 18 years after stroke: a population-based South London stroke register study. Lancet Regional Health – Europe. 40, 100882 (2024).
- Wada, Y. et al. Effect of post-stroke depression on functional outcomes of patients with stroke in the rehabilitation ward: a retrospective cohort study. Archives of Rehabilitation Research and Clinical Translation. 5 (4), 100287 (2023).
- Debebe, E. Y., Biyadgie, M., Chekol, H. A., Asmare, L., Yigzaw, Z. A. Prevalence and associated factors of post-stroke depression among patients on follow-up at medical referral clinics of Bahir Dar city public specialized hospitals. BMC Neurology. 24, 470 (2024).
- Blake, J. J., Gracey, F., Whitmore, S., Broomfield, N. M. Comparing the symptomatology of post-stroke depression with depression in the general population: a systematic review. Neuropsychology Review. 34 (3), 768–790 (2024).
- Yi, Y. et al. Effectiveness of non-pharmacological therapies for treating post-stroke depression: a systematic review and network meta-analysis. General Hospital Psychiatry. 90, 99–107 (2024).
- Yan, N., Hu, S. The safety and efficacy of escitalopram and sertraline in post-stroke depression: a randomized controlled trial. BMC Psychiatry. 24 (1), 365 (2024).
- Rodoshi, Z. N. et al. Comparative efficacy of selective serotonin reuptake inhibitors and serotonin-norepinephrine reuptake inhibitors in the management of post-stroke depression: a systematic review of randomized controlled trials. Cureus. 17 (5), e84784 (2025).
- Langerak, A. J. et al. Stroke patients’ motivation for home-based upper extremity rehabilitation with eHealth tools. Disability and Rehabilitation. 46 (22), 5323–5333 (2024).
- Tooley, E. M., Kolahi, A. Motivating behavioral change. Medical Clinics of North America. 106 (4), 627–639 (2022).
- Zhang, B. R., Yang, X. Motivational interviewing in postoperative rehabilitation and chronic disease management: current findings and future research directions. World Journal of Psychiatry. 15 (1), 102737 (2025).
- Wintle, E., Taylor, N. F., Harding, K., O’Halloran, P., Peiris, C. L. Physical therapist-delivered motivational interviewing and health-related behaviour change: a systematic review and meta-analysis. Brazilian Journal of Physical Therapy. 29 (1), 101168 (2025).
- Mou, H. et al. Motivational interviewing for improving functional and psychosocial outcomes among stroke survivors. Cochrane Database of Systematic Reviews. 4 (4), CD016110 (2025).
- Feng, X. et al. Inflammatory pathogenesis of post-stroke depression. Aging and Disease. 16 (1), 209–238 (2024).
- Jiang, Y. et al. Monoamine neurotransmitters control basic emotions and affect major depressive disorders. Pharmaceuticals. 15 (10), 1203 (2022).
- Tseng, Y. T., Han, D. S., Lai, J. C. Y., Wang, C. H., Wang, T. G., Chen, H. H. The effects of rehabilitation potential on activities of daily living in patients with stroke in Taiwan: a prospective longitudinal study. Journal of Rehabilitation Medicine. 56, jrm27028 (2024).
- Fu, Y. et al. The effect of motivational interviewing on patients with early post-stroke depression: a quasi-experimental study. BMC Psychiatry. 25 (1), 248 (2025).
- Zhan, Q., Kong, F. Mechanisms associated with post-stroke depression and pharmacologic therapy. Frontiers in Neurology. 14, 1274709 (2023).
- Bilgin, A., Muz, G., Yuce, G. E. The effect of motivational interviewing on metabolic control and psychosocial variables in individuals diagnosed with diabetes: systematic review and meta-analysis. Patient Education and Counseling. 105 (9), 2806–2823 (2022).
- Shahzadi, M., Hafeez, S., Abbas, Q., Ehsaan, S., Khan, M. U. The leading role of evidence-based practices in the treatment of patients with substance use disorders: a systematic review. Journal of the Pakistan Medical Association. 73 (8), 1675–1683 (2023).
- Bastos Maia, M., Martins, P. M., Figueiredo-Braga, M. Outcomes and challenges of motivational interviewing in dual diagnosis treatment: a systematic review. Journal of Dual Diagnosis. 21 (1), 56–69 (2025).
访问受限。请登录或开始试用以查看此内容。