In a prospective cohort of 200 patients with gastrointestinal stromal tumor (GIST) receiving first-line imatinib, a baseline five-metabolite plasma panel independently predicted progression-free survival. Internal validation showed improved discrimination and calibration over a clinical benchmark, supporting further external evaluation of the panel as a prognostic risk-stratification tool.
研究文章
A 5-Metabolite Plasma Panel Predicts Progression-Free Survival and Adds Prognostic Value in Imatinib-Treated Gastrointestinal Stromal Tumors
本文内容
摘要
摘要
Among patients with gastrointestinal stromal tumor receiving first-line imatinib, outcomes vary substantially, and traditional stratification based on KIT/PDGFRA genotype and tumor burden does not fully explain individual prognostic differences. Baseline plasma metabolomics may noninvasively reflect the tumor–host systemic state and provide additional prognostic information. This single-center prospective cohort study aimed to develop and internally validate a baseline plasma–based metabolomic risk score and to assess its incremental discrimination, calibration, and clinical net benefit over a clinical benchmark model. Patients with gastrointestinal stromal tumor receiving first-line imatinib were enrolled from 2019 to 2023 and followed until June 30, 2025. Baseline plasma samples were collected before the first dose of imatinib, and liquid chromatography–tandem mass spectrometry (LC-MS/MS)–derived metabolomic features were processed using quality-control procedures and normalization. An elastic-net penalized Cox model was used to select metabolites and construct the risk score, with 0.632+ bootstrap resampling used for optimism correction, time-dependent receiver operating characteristic analysis for discrimination, calibration analysis, and decision curve analysis for exploratory net-benefit assessment. A total of 200 patients were included, with 5178.64 person-months of follow-up and 104 progression-free survival events. A five-metabolite panel was identified, and in the development cohort, the fitted continuous metabolomic risk score showed an apparent association with progression-free survival. Compared with the clinical benchmark model, the combined model improved the C-index by 0.06 and showed overall higher time-dependent area under the curve (AUC) values over 0–36 months. Calibration at 1 and 2 years was close to the ideal line, and decision curve analysis showed higher model-based net benefit across the evaluated threshold ranges. The baseline five-metabolite plasma panel, therefore, provides incremental prognostic information beyond conventional clinical factors. External validation and prospective impact studies are required before the score can be used to guide clinical management.
引言
Gastrointestinal stromal tumor (GIST) is the most common mesenchymal tumor of the gastrointestinal tract and is generally considered to arise from Cajal interstitial cells1. The introduction of imatinib has substantially changed the treatment landscape of advanced GIST and established tyrosine kinase inhibition (TKI) as the standard first-line treatment for unresectable or metastatic disease2. However, despite being under the same first-line treatment, patients show considerable heterogeneity in progression-free survival (PFS), indicating that conventional clinicopathological and molecular factors do not fully capture individual differences in prognosis2. Current risk assessment mainly relies on KIT/PDGFRA genotype, tumor burden, primary tumor characteristics, and mitotic activity, but these variables alone remain insufficient to explain the wide variability in outcomes observed among patients treated with imatinib3,4.
Metabolic reprogramming is an important feature of tumor progression and treatment response. Under tyrosine kinase inhibitor pressure, alterations in immunometabolism, fatty acid oxidation, and central carbon metabolism may reflect changes in both tumor biology and the host systemic state5. Plasma metabolomics provides a minimally invasive approach to capture these systemic metabolic alterations and may therefore offer prognostic information complementary to conventional clinical and molecular factors6. Compared with repeated tissue sampling, plasma-based metabolomic profiling can provide a more practical means of obtaining a baseline biological signature before treatment initiation.
Nevertheless, gaps remain in the current evidence. Prospective studies evaluating baseline plasma metabolomics for prognosis in patients receiving first-line imatinib are still limited. Existing studies have been predominantly retrospective or based on relatively small cohorts and have often lacked rigorous quality control, batch-effect correction, and blinded statistical pipelines7. In addition, few studies have evaluated whether metabolomic information provides incremental value beyond an established clinical benchmark in terms of discrimination, calibration, and clinical net benefit. Meanwhile, metabolomic biomarkers have rarely been condensed into compact and interpretable prognostic panels suitable for external validation and subsequent clinical-impact evaluation8. Although imaging and circulating tumor DNA (ctDNA) can further improve prognostic assessment, their implementation can depend on equipment availability, sampling time points, and repeated testing, which may restrict routine use in some clinical settings9. Therefore, there remains a need for a compact and reproducible prognostic tool that can be obtained before treatment initiation and that complements established clinical and molecular predictors.
The study objective was to develop and internally validate, in a single-center prospective cohort of patients with GIST receiving first-line imatinib, a PFS-oriented metabolomic risk score derived from baseline plasma. The authors further aimed to assess its incremental prognostic value over a prespecified clinical benchmark model by evaluating discrimination, calibration, and clinical net benefit, and to examine the robustness of the model through prespecified and additional sensitivity analyses.
方案
Study design
This study was a single-center, prospective, cohort study. The enrollment period was from January 1, 2019, to December 31, 2023; the follow-up cutoff date was June 30, 2025. All participants signed written informed consent before enrollment. Approval was obtained from the institutional ethics committee of the center (approval number:2019CZRMYYEC-011). Metabolomics laboratory personnel and statistical analysts performed data processing and modeling under blinded conditions until database lock, after which unblinding was performed uniformly. A comprehensive list of all materials, reagents, instruments, and software used in this study, along with their manufacturers and catalog numbers, is provided in the Table of Materials.
Study population
Eligibility criteria: Inclusion criteria included: age 18–85 years; pathologically confirmed GIST; unresectable locally progressive or distant metastatic disease planned to receive imatinib as first-line therapy; baseline plasma collection completed within 7 days before the first dose of imatinib; complete baseline imaging assessment with measurable target lesions; provision of tumor tissue for KIT/PDGFRA genotyping. Exclusion criteria included: prior exposure to any tyrosine kinase inhibitor; absolute contraindications to imatinib; PDGFRA D842V mutation (excluded from the primary analysis and included in the prespecified sensitivity analysis); baseline plasma sample with hemolysis index exceeding the threshold or more than one freeze–thaw cycle; absence of any evaluable post-baseline imaging follow-up.
Sample size estimation and enrollment scale: The final model to be developed in this study was planned to include no more than 9 degrees of freedom (clinical/molecular 4 degrees of freedom: genotype 1, tumor burden 1–2, primary site 1, Eastern Cooperative Oncology Group (ECOG) 1; metabolite coefficients 5 degrees of freedom). According to the rule of events per variable (EPV) ≥10, the required number of PFS events was ≥90. Considering that among advanced GIST patients receiving first-line imatinib, the proportion of progression or death within 24 months is approximately 50%, the expected number of events among 200 participants was about 100. Using the approximate shrinkage factor s≈E/(E+df), with E = 100 and df = 9, s ≈ 0.917, meeting the prespecified target of s ≥ 0.90. Taking into account the number of events, shrinkage factor, and feasibility, a total of 200 participants were planned for enrollment, and prospective enrollment and follow-up of 200 participants were completed.
Power and overfitting assessment
In addition to the prespecified event-per-variable and shrinkage calculations, a Cox-model sensitivity power analysis was performed for the continuous metabolomic risk-score effect. With 104 observed PFS events, a two-sided alpha of 0.05, and a hazard ratio (HR) of 1.58 per 1-standard-deviation (SD) increase, Schoenfeld's approximation yielded 99.7% power. Under a conservative assumption that 50% of the variance in the risk score was explained by the remaining covariates (partial R-squared = 0.50), power remained 91.0%, corresponding to a requirement of approximately 101 events for 90% power. With a prespecified maximum of 9 model degrees of freedom, the observed event-to-parameter ratio was 11.6, and the approximate shrinkage factor was 104/(104+9) = 0.920. Candidate metabolite screening was restricted to no more than 20 features before elastic-net penalization, and these calculations were considered together with the penalized modeling and .632+ bootstrap validation when assessing overfitting risk. The 9-degree-of-freedom calculation was used as a planning heuristic based on the intended final model size and does not fully capture the additional uncertainty introduced by data-driven screening across 3,591 metabolomic features. Therefore, overfitting was assessed primarily through full-pipeline bootstrap validation, in which all preprocessing, screening, tuning, and feature-selection steps were repeated within each resample.
Measurement of baseline clinical and molecular variables
Clinical variables: Age, sex, ECOG performance status (categorized as 0–1 vs ≥2), primary site (stomach vs non-stomach), sum of the longest diameters of target lesions at baseline (mm, taking the measurement from the most recent baseline imaging), and presence or absence of prior curative-intent surgery were recorded. DNA was extracted from formalin-fixed paraffin-embedded tissue or fresh-frozen tissue using a commercially available DNA/RNA extraction kit, with unified lot numbers and procedures. A short-read next-generation sequencing platform was used to sequence KIT exons 9, 11, 13, and 17 and PDGFRA exons 12, 14, and 1810; library preparation was performed using a commercially available sequencing library preparation kit, sequencing was paired-end 150 bp, and the mean targeted coverage depth was ≥500×. Sequence reads were aligned, and variants were called using standard short-read alignment and variant-calling software; locus-level calling thresholds were variant allele frequency ≥5% and number of supporting reads ≥2011. All positive results were reviewed by a second molecular pathologist. For the prespecified primary clinical benchmark, genotype was coded as a binary variable (KIT exon 11 vs others). To address the established prognostic heterogeneity of KIT exon 9 tumors under standard-dose imatinib, an additional disease-specific sensitivity analysis recoded genotype into three categories: KIT exon 11, KIT exon 9, and other genotypes.
Imatinib treatment and follow-up management
Dosing regimen: The initial daily dose of imatinib was recorded at treatment initiation. Most patients received 400 mg/day, whereas 13 patients (6.5%) started at a dose other than 400 mg/day, as summarized in Table 1. During follow-up, all documented treatment interruptions, dose reductions, dose resumptions, and dose changes were recorded with their corresponding dates and daily doses. For grade ≥3 toxicities as defined by the Common Terminology Criteria for Adverse Events (CTCAE) version 5.012, treatment was temporarily withheld and, after recovery to grade 1 or baseline, could be resumed at 300 mg/day; recurrent toxicity could result in reduction to 200 mg/day or permanent discontinuation. Dose escalation to 600–800 mg/day after radiologic progression was permitted when clinically indicated13. Because PFS ended at first radiologic progression, dose changes occurring after the PFS event did not contribute to the dose-intensity analysis.
For sensitivity analysis, pre-progression imatinib exposure was summarized as a time-varying relative dose intensity (RDI). At each follow-up time, RDI was calculated as the cumulative documented imatinib dose received from treatment initiation to that time, divided by the reference cumulative dose of 400 mg/day over the same number of elapsed days. Treatment-interruption days contributed 0 mg, and dose reductions or higher doses contributed according to the documented daily dose. Thus, RDI values below 1.0 represented lower-than-reference cumulative exposure and values above 1.0 represented higher exposure. RDI was updated over follow-up and entered as a time-varying covariate in an extended Cox model.
Follow-up schedule: After enrollment, contrast-enhanced computed tomography (CT) of the chest, abdomen, and pelvis was performed every 12 weeks (magnetic resonance imaging was performed when contrast enhancement was not feasible) until study termination. All clinical assessments were recorded in the electronic medical record and the study database, and dates and reasons were recorded for treatment discontinuation, therapy change, loss to follow-up, and death.
Endpoint definition and imaging evaluation
Primary endpoint: Progression-free survival (PFS), defined as the time from the date of the first dose of imatinib to the first radiologic progression or death; participants without an event were censored at the date of the last progression-free follow-up. Radiologic progression was determined according to the response evaluation criteria in solid tumors (RECIST) version 1.114. Imaging assessment procedures: All imaging was independently interpreted by two radiologists with ≥10 years of oncologic imaging experience; discordant cases were adjudicated by a third senior radiologist. The progression date was defined as the date of the imaging report that first concluded progression. When progression was observed on unscheduled imaging, dual independent reads were likewise performed, and such events were counted toward the primary endpoint.
Plasma collection and processing
Within 7 days before the first dose of imatinib, 6 mL of peripheral venous blood was collected in the early morning after an overnight fast, using dipotassium ethylenediaminetetraacetic acid (K2-EDTA) anticoagulant vacuum blood collection tubes. The time from blood draw to the first centrifugation was controlled within 30 min, with centrifugation at 4 °C, 2000 × g, for 10 min. The supernatant was subjected to a second centrifugation in a prechilled centrifuge (4 °C, 12 000 × g, 10 min), aliquoted at 0.5 mL per tube, and stored at −80 °C. Each sample was allowed only one freeze–thaw. The hemolysis index was assessed spectrophotometrically at 414 nm. To minimize hemolysis-related distortion of the plasma metabolomic profile, samples exceeding the study-defined operational cutoff of A414>0.20 were excluded15. The cutoff was used as a study-specific preanalytical QC criterion rather than as a universal metabolomics threshold.
Metabolite extraction used a methanol protein precipitation method: 100 µL of plasma was mixed with 400 µL of prechilled methanol containing an isotope-labeled internal standard mixture comprising [13C6]-glucose, [13C5,15N]-glutamate, d3-leucine, d4-citric acid, d5-phenylalanine, d9-carnitine, and d7-cholesterol, each at a working concentration of 250 ng/mL in the precipitation solvent. Thus, 100 ng of each internal standard was introduced into each sample extraction. The mixture was vortexed for 30 s, incubated at −20 °C for 30 min, and centrifuged at 15 000 × g for 10 min at 4 °C. The supernatant was dried under nitrogen, reconstituted in 100 µL of 50% methanol, filtered through a 0.22 µm membrane, and 5 µL was injected. The isotope-labeled standards were used to monitor extraction and analytical performance and to support sample-level normalization and semi-quantitative correction; they were not used as analyte-specific calibration standards for absolute quantification. The complete list of internal standards and concentrations is provided in Supplementary Table 1.
The internal-standard mixture was designed for broad analytical monitoring and normalization rather than one-to-one isotope-dilution quantification of every metabolite in the final panel. Among the five retained metabolites, [13C5,15N]-glutamate and d4-citric acid were analyte-matched isotopologues of glutamate and citric acid, respectively. In contrast, d9-carnitine served as a class-related surrogate for carnitine/acylcarnitine signals and was not an analyte-matched internal standard for palmitoylcarnitine. No analyte-matched isotope-labeled internal standards for kynurenine or lysophosphatidylcholine [LPC(16:0)] were included in the untargeted assay. Accordingly, the present risk score was derived from normalized semi-quantitative feature intensities rather than isotope-dilution absolute concentrations.
LC-MS/MS acquisition and quality control
The instrument platform consisted of an ultrahigh-performance liquid chromatography system coupled to a high-resolution mass spectrometer. Reversed-phase chromatography–positive ion mode: Column, a reversed-phase C18 column (2.1×100 mm, 1.8 µm); mobile phase A, 0.1% formic acid in water; mobile phase B, 0.1% formic acid in acetonitrile; flow rate, 0.35 mL/min; column temperature, 40 °C; gradient, 0–1 min 2% B, 1–12 min linear to 98% B, 12–14 min 98% B, 14.1–17 min 2% B for re-equilibration. Electrospray ionization (ESI) positive ion mode acquisition range m/z 70–1000, resolution 60 000 (m/z 200), automatic gain control (AGC) 3e6, maximum injection time 100 ms; data-dependent acquisition Top10, normalized collision energy (NCE) 20/40/60.
Hydrophilic interaction chromatography–negative ion mode: Column, an amide-based hydrophilic interaction chromatography column (2.1×100 mm, 1.7 µm); mobile phase A, 25 mM ammonium formate in water (pH 9.0); mobile phase B, acetonitrile; flow rate, 0.30 mL/min; column temperature, 35 °C; gradient, 0–2 min 90% B, 2–12 min linear to 50% B, 12–14 min 50% B, 14.1–18 min 90% B for re-equilibration. ESI negative ion mode acquisition range m/z 70–1000, resolution 60 000, AGC 3e6, maximum injection time 100 ms; data-dependent acquisition Top10, NCE 20/40/6016.
Run order and calibration: Before each day’s runs, mass calibration was performed with the vendor's mixed calibration solution. The injection order of all samples was generated as a complete randomization by the R software, with the first 10 injections used for system equilibration. One pooled QC plasma was injected every 10 injections, and blank samples were placed at the beginning and end of each batch. Quality control criteria: Features with relative standard deviation (RSD) >30% in pooled QC were removed; features with mean peak area in blanks exceeding 10% of the mean peak area in samples were removed; after quality control–based robust LOESS signal correction (QC-RLSC; LOESS, locally estimated scatterplot smoothing) correction of retention time drift, the RSD of internal standard peak areas was required to be ≤20%. Between-batch differences were corrected nonlinearly by the QC-RLSC method, and metrics before and after correction were fully reported in QC samples. To visually assess batch structure, principal component analysis (PCA) was specified for the retained feature matrix before and after QC-RLSC correction using the same normalization and scaling pipeline. PC1 versus PC2 score plots should identify analytical batch and highlight pooled QC injections; the paired plots are to be reported as Supplementary Figure 1.
Features processing and metabolite annotation
Raw LC-MS files were processed using commercial LC-MS data-processing software for peak picking, alignment, and gap filling, with parameters including minimum peak intensity 1e6, mass deviation ≤5 ppm, and retention time window 0.3 min. Subsequently, QC-RLSC signal correction and sample-level internal standard normalization were performed, followed by probability quotient normalization (PQN) and log2 transformation. Features with a non-missing rate <80% were excluded. Before imputation, sample-level missingness was calculated separately within each acquisition mode as the percentage of retained mode-specific features with missing values for each sample. Median and interquartile range were then summarized across samples. Because the two acquisition modes comprised distinct feature sets, sample-level missingness was not pooled across modes. For the retained features, residual sporadic missing values were imputed using k-nearest neighbors (KNN) imputation with k = 10 in the log2-transformed feature space. Pareto scaling was then applied to the completed data matrix before univariable screening and penalized Cox modeling. Features were retained if the non-missing rate across samples was ≥80%. Annotation used MS/MS spectral matching against reference metabolomic databases, with a spectral matching score ≥70 and retention-time consistency error ≤0.2 min17, and annotation levels were assigned according to the Metabolomics Standards Initiative (MSI). MSI Level 1 was assigned only when identity was confirmed against an authentic reference standard under the same analytical conditions using orthogonal evidence such as retention time and MS/MS characteristics. Isotope-labeled compounds included primarily as internal standards for analytical monitoring or normalization were not, by themselves, used to upgrade an annotation to Level 1. Accordingly, glutamate and palmitoylcarnitine were conservatively retained as MSI Level 2 in the present dataset. Although [13C5,15N]-glutamate was an analyte-matched isotopologue, it was used as an internal standard rather than as the prespecified authentic reference for formal MSI Level 1 confirmation. In addition, d9-carnitine is not an isotope-labeled palmitoylcarnitine standard and therefore does not establish Level 1 identification of palmitoylcarnitine.
Candidate metabolite screening and dimensionality reduction
To reduce collinearity, pairwise Pearson correlation coefficients among features were pruned (if |r| ≥ 0.90, one of the pair was removed). Univariable Cox regression was then performed, with the Benjamini–Hochberg method controlling the false discovery rate and q< 0.10 set as the pre-screening threshold, limiting the number of candidates to ≤ 20. Finally, feature compression was conducted using an elastic-net penalized Cox proportional hazards model (α = 0.5; 10-fold cross-validation to determine λ), reducing the metabolite dimension to 3–6 metabolites and outputting standardized coefficients. This sequence of correlation pruning, univariable Cox screening with Benjamini–Hochberg FDR control, candidate-number restriction, and elastic-net penalized Cox selection constituted the complete metabolite-selection pipeline. During internal validation, this entire sequence was re-executed de novo within each bootstrap replicate.
Internal model validation and incremental value assessment
The clinical benchmark model included the following prespecified covariates: genotype (binary: KIT exon 11 vs others), baseline tumor burden (sum of the longest diameters of target lesions, continuous), primary site (binary: stomach vs non-stomach), and ECOG (binary: 0–1 vs ≥2). Because the prespecified binary genotype variable grouped KIT exon 9 together with other molecular subtypes, the authors additionally evaluated a disease-specific strengthened clinical benchmark in sensitivity analysis. In this model, genotype was represented by separate indicator terms for KIT exon 11, KIT exon 9, and other genotypes, while tumor burden, primary site, and ECOG were retained unchanged. The metabolomic risk score was then added to this strengthened benchmark, and incremental performance was reassessed using the same bootstrap validation framework. On this basis, a metabolomic risk score composed of a linear combination of the five retained metabolites was introduced. For risk-score construction, the final preprocessed abundance of each retained metabolite was standardized as Zj = (Xj−μj)/σj, where μj and σj were calculated once from the entire development cohort (N = 200) after completion of the prespecified preprocessing pipeline. These cohort-derived means and standard deviations were treated as fixed model parameters and are part of the locked scoring specification. The risk score was calculated as the weighted sum of the five Z-scores plus the model intercept.
RiskScore = 0.38 × ZKynurenine + 0.29 × ZPalmitoylcarnitine - 0.33 × ZLPC(16:0) - 0.28 × ZCitricAcid + 0.21× ZGlutamate + 0.08. (1)
For future external research validation under the same analytical workflow, the sample should be analyzed under the same locked assay and preprocessing workflow, including pooled-QC-based batch correction, internal-standard normalization, PQN/log transformation, and the same feature-processing steps, and then standardized using the fixed development-cohort μj and σj values. The normalization constants must not be recalculated from the individual patient or from each new analytical batch. Because untargeted LC-MS signal scales depend on the analytical platform and preprocessing workflow, mean and standard deviation values reported in external cohorts are not interchangeable and were not used to define the present score. The complete coefficient-based single-patient scoring workflow is summarized in Supplementary Table 2. In the development cohort, the association between the fitted metabolomic risk score and PFS was summarized by the apparent hazard ratio (HR) per +1 standard deviation of the risk score. Because the score coefficients were estimated using the same cohort, this HR was considered a development-sample association estimate rather than an optimism-corrected validation estimate. Internal validation was therefore based primarily on the .632+ bootstrap-corrected measures of discrimination, calibration, and prediction error.
Internal validation was performed using 1,000 .632+ bootstrap replicates. In each replicate, a bootstrap sample was drawn with replacement from the N = 200 development cohort, and all data-dependent model-building steps were repeated de novo within that bootstrap sample. Specifically, the metabolomic feature-selection pipeline included pairwise correlation pruning using the prespecified |r|≥0.90 criterion, univariable Cox regression with Benjamini–Hochberg FDR control at q<0.10, restriction of the candidate set to ≤20 features, and elastic-net penalized Cox regression with α = 0.5 and 10-fold cross-validation for λ selection. Metabolites and coefficients were therefore allowed to vary across bootstrap replicates. The clinical benchmark model and the combined model were subsequently refitted within each replicate, and bootstrap-derived performance was evaluated using the same .632+ framework to obtain optimism-corrected Harrell C-index, integrated AUC, Brier score, and calibration slope. All data-dependent preprocessing and model-development steps, including standardization, residual missing-value imputation, scaling, feature screening, penalized selection, tuning, and coefficient estimation, were re-estimated within each bootstrap replicate. Posterior penalization was implemented by multiplying regression coefficients by the global shrinkage factor, and when necessary, the final model was generated via intercept and slope recalibration. For risk stratification and Kaplan–Meier visualization, the metabolomic risk score was divided into tertiles according to its empirical distribution in the N = 200 development cohort. Because both the fitted risk scores and the tertile cut-points were derived from the full development cohort, the tertile-specific Kaplan–Meier curves, log-rank comparison, tertile-trend HR, and tertile-specific median PFS estimates were regarded as apparent descriptive estimates and were not interpreted as internally validated performance measures. The 33.3rd and 66.7th percentiles of the risk-score distribution were used as the two cut-off points, defining T1 (low risk), T2 (intermediate risk), and T3 (high risk). The continuous risk score remained the primary form used for effect estimation, whereas tertile grouping was used for descriptive risk stratification and survival visualization. Kaplan–Meier curves were generated using the complete individual event and censoring times. Numbers at risk were calculated at the landmark times of 0, 12, 24, and 36 months for graphical presentation only and were not used to construct the survival curves or estimate median PFS.
Under the same validation framework as the clinical benchmark model, performance differences before and after adding the metabolomic risk score were compared. The primary criteria included absolute improvements in C-index and 1–3-year integrated time-dependent area under the curve (iAUC) (target improvement ≥0.05 with 95% confidence intervals not crossing 0), the p-value of the penalized likelihood ratio test, changes in Brier score, and improvements in calibration slope. Decision curve analysis was performed to calculate net benefit at 1 year and 2 years, with the risk threshold range set at 20%–50%, and the net benefit was compared against the “treat all” and “treat none” strategies. Decision curve analysis was considered an exploratory decision-analytic assessment and was not interpreted as evidence that score-guided changes in follow-up or treatment improve patient outcomes.
Handling of missing data and sensitivity analyses
Missing data: Missing clinical and molecular covariates were handled by multiple imputation using chained equations (m = 20, including the outcome and all covariates), and coefficients and variances after imputation were combined using Rubin’s rules. For metabolomic data, features with a non-missing rate <80% were excluded before modeling. Residual sporadic missing values among the retained features were imputed using k-nearest neighbors (KNN) with k = 10 in the log2-transformed feature space before Pareto scaling and statistical modeling. Participants with at least one evaluable post-baseline imaging assessment who were subsequently lost to follow-up were retained and censored at the date of their last evaluable imaging. Patients with no evaluable post-baseline imaging assessment were excluded because PFS could not be ascertained.
Sensitivity analyses: Firstly, repeat the entire modeling workflow after including cases with the PDGFRA D842V mutation. Secondly, test nonlinearity of tumor burden using restricted cubic splines (3 knots) and compare with the linear-term result. Thirdly, recompute the endpoint using first progression defined by the Choi criteria in place of RECIST 1.1 and compare with the main analysis. Fourthly, repeat the clinical-benchmark comparison using disease-specific genotype coding (KIT exon 11, KIT exon 9, and other genotypes) to determine whether the incremental value of the metabolomic score remained after explicitly accounting for the prognostic contribution of KIT exon 9. Fifthly, evaluate whether the prognostic association of the metabolomic risk score remained after accounting for pre-progression imatinib exposure by adding time-varying RDI to the Cox model. Because RDI is a post-baseline treatment variable and may itself be influenced by toxicity or baseline patient condition, this analysis was treated as a sensitivity analysis rather than incorporated into the prespecified baseline clinical benchmark.
Statistical methods
Statistical analyses were performed using statistical computing software. Dedicated statistical packages were used for Cox regression, penalized regression, survival curve visualization, time-dependent receiver operating characteristic analysis and integrated area under the curve estimation, Brier score and calibration assessment, multiple imputation, decision curve analysis, and QC-RLSC correction. A two-sided significance threshold was set at p<0.05; multiple comparisons were controlled using the Benjamini–Hochberg method. Primary analyses were conducted after database lock according to the predefined analysis plan. Additional disease-specific genotype and dose-intensity sensitivity analyses were subsequently performed to address reviewer concerns and are explicitly identified as such.
结果
Study participants, follow-up, and outcome overview
A total of 274 patients with GIST were screened. Of these, 74 (27.0%) were excluded because of prior TKI therapy, absence of baseline plasma, incomplete baseline imaging, PDGFRA D842V mutation, plasma hemolysis above the predefined threshold, or absence of any evaluable post-baseline imaging follow-up. The remaining 200 patients were included in the primary analysis, while the 7 patients with PDGFRA D842V were evaluated separately in the prespecified sensitivity analysis (Figure 1). The median age of enrolled patients was 59.4 years, with a predominance of men (56.50%) and gastric primary site (60.50%); most patients had good performance status (ECOG 0–1 accounted for 86.50%). All patients had metastatic/unresectable disease, and the KIT exon 11 mutation accounted for 58.50% (Table 1). The median follow-up time and its 95% CIs were estimated using the reverse Kaplan–Meier method, the 95% CI of the event proportion was calculated using the Clopper–Pearson exact interval, and person-time was measured in months. As of June 30, 2025, a total of 5178.64 person-months were accrued, with a median follow-up time of 26.43 months (95% CI: 24.76–28.32 months). During this period, 104 progression-free survival (PFS) events occurred (52.00%, 95% CI: 44.84%–59.10%), and 96 patients were censored (Table 2).
Quality of metabolomics data and platform performance
After QC-RLSC batch correction, the feature-level relative standard deviation (RSD) of metabolite features in pooled QC samples decreased from 30.04% [23.98%–38.22%] before correction to 14.79% [11.21%–19.28%] after correction; a total of 3,591 features in the combined dataset met the requirement of a non-missing rate ≥80% (Table 3). Before KNN imputation, median sample-level missingness was 7.83% [5.42–10.96] in ESI+ and 9.17% [6.01–12.88] in ESI−; no combined-mode missingness summary was calculated because the retained feature sets were mode-specific. PCA score plots of the retained metabolomic feature matrix showed clear analytical batch-related separation before QC-RLSC correction, whereas batch-related clustering was substantially reduced after correction and pooled QC injections showed tighter central clustering (Supplementary Figure 1). These visual findings were consistent with the reductions in retention-time drift, internal-standard variability, and feature-level RSD reported in Table 3.
Construction of the metabolite risk score
Using an elastic net penalized Cox model (α = 0.5) with global shrinkage, a risk score comprising 5 metabolites was constructed, among which kynurenine (βshrunk = +0.38) and lysophosphatidylcholine LPC(16:0) (βshrunk = −0.33) contributed most substantially to predicting PFS (Table 4).
Metabolite risk score and progression-free survival
Using the fitted risk scores derived from the full N = 200 development cohort, Kaplan–Meier curves were constructed after division into tertiles based on the 33.3rd and 66.7th percentiles of the same cohort. These analyses were considered apparent descriptive analyses because both the model coefficients and the tertile cut-points were derived from the same patients. The apparent tertile-trend HR was 1.31 per tertile (p = 0.001), and the apparent HR for the continuous score was 1.58 per +1 SD (p < 0.001). The apparent three-group log-rank comparison was also significant (χ2 = 13.746, df = 2, p = 0.0010) (Figure 2). Median PFS was not reached within 36 months in T1, whereas the estimated median PFS was 25.78 months (95% CI, 21.92–29.41) in T2 and 17.34 months (95% CI, 14.81–20.52) in T3. These median estimates were derived from the complete Kaplan–Meier curves using all observed event and censoring times rather than from the landmark at-risk counts. These estimates were used to describe the direction and magnitude of association, whereas internally validated predictive performance was evaluated separately using the .632+ bootstrap-corrected metrics reported in Table 5.
Predictive model performance and incremental value
Using .632+ bootstrap for internal validation, the combined model (clinical + metabolomic) showed a significant improvement over the clinical benchmark model in predicting PFS (ΔC-index = 0.06, 95% CI: 0.02–0.11; penalized likelihood ratio test p = 0.0017), with good calibration slope and concordance (Table 5). Time-dependent receiver operating characteristic analysis was used to construct the AUC curves, and 95% CIs were calculated by bias-corrected and accelerated (BCa) bootstrap. Compared with the clinical benchmark model, the combined model (clinical + metabolomic) exhibited overall higher discrimination over 0–36 months; at months 11 and 23, AUC(t) was 0.70 vs 0.64 and 0.66 vs 0.61 (ΔAUC = 0.06 and 0.05), respectively (Figure 3A). Using .632+ bootstrap to evaluate calibration at 12 and 24 months, predicted progression-free probabilities were grouped into deciles, observed risk was estimated by the Kaplan–Meier method, and locally estimated scatterplot smoothing (LOESS) curves were fitted. The results showed high agreement between predicted and observed risks, with curves close to the perfect calibration line (45°) (Figure 3B). Time-point decision curve analysis (net benefit derived using the Kaplan–Meier method, with BCa bootstrap B = 1000 to obtain 95% CI) showed that at 12 months the combined model had overall higher net benefit in the threshold range p_t≈0.21–0.27, with the gap converging at ≥0.33; at 24 months, the combined model was overall superior to the clinical benchmark and to the “treat all”/“treat none” strategies in the range p_t≈0.27–0.49, while at the low threshold of 0.21 the “treat all” strategy had a slight advantage (Figure 3C).
Internal validation and stability of feature selection
Under B = 1000 bootstrap resampling, the complete metabolite-selection and model-development pipeline was repeated de novo within each replicate, including correlation pruning, univariable Cox screening with FDR control, candidate restriction, and elastic-net Cox selection with internal 10-fold cross-validation for λ. Kynurenine showed the highest and most stable selection frequency (>85%) among the five metabolites retained in the final model; LPC(16:0) and palmitoylcarnitine were both selected in >70% of replicates, whereas citric acid and glutamate were selected in >50%. Because feature screening and penalized selection were embedded within each bootstrap replicate rather than fixed from the full dataset, these frequencies reflect the stability of the entire selection process rather than refitting of a prespecified five-metabolite panel (Figure 4).
Sample-size adequacy analysis supported the stability of model development. The 104 observed PFS events exceeded the approximately 101 events required for 90% power under the conservative partial R-squared = 0.50 scenario; the observed event-to-parameter ratio was 11.6, and the approximate shrinkage factor was 0.920. Consistent with these calculations, the combined model showed limited optimism, with a C-index of 0.70 before correction and 0.68 after .632+ bootstrap correction, a corrected calibration slope of 0.94, and a global shrinkage factor of 0.91 (Table 5). Together with bootstrap selection frequencies of 56.7%-87.9% for the five retained metabolites, these findings provided no evidence of substantial overfitting.
Sensitivity analyses
Across the three prespecified sensitivity scenarios, the continuous effect of the risk score remained directionally consistent, with all HRs per SD >1 and all corresponding 95% CIs excluding 1.0. Discrimination changed only modestly (ΔC-index ranging from −0.01 to +0.02); use of the Choi criteria and restricted cubic splines for tumor burden produced slight improvements. The modest increase in event count and model performance under the Choi endpoint may reflect the ability of Choi criteria to capture treatment-related reductions in tumor density and devitalization that can precede measurable size reduction during imatinib therapy. Inclusion of PDGFRA D842V produced a slight decrease in discrimination (Table 6). In the additional disease-specific sensitivity analysis, genotype was recoded as KIT exon 11, KIT exon 9, and other genotypes to strengthen the clinical benchmark. The optimism-corrected C-index increased from 0.62 in the prespecified benchmark to 0.64 (95% CI, 0.59–0.68) in the strengthened benchmark. After addition of the metabolomic risk score, the corrected C-index was 0.69 (95% CI, 0.65–0.73), corresponding to an incremental ΔC-index of 0.05 (95% CI, 0.01–0.09). The corrected 1–3-year iAUC was 0.63 for the strengthened clinical model and 0.67 for the combined model, while the corresponding integrated Brier score (IBS) values were 0.19 and 0.17. Calibration remained acceptable, with corrected slopes of 0.95 and 0.94, respectively. Thus, explicitly modeling KIT exon 9 modestly attenuated, but did not eliminate, the incremental prognostic contribution of the metabolomic panel.
In the dose-intensity sensitivity analysis, pre-progression imatinib relative dose intensity (RDI) was incorporated as a time-varying covariate in the Cox model. Lower RDI was associated with a higher risk of progression or death (HR per 0.10 decrease in RDI = 1.18, 95% CI 1.04–1.34, p = 0.010). After adjustment for time-varying RDI, the metabolomic risk score remained significantly associated with PFS (adjusted HR per +1 SD = 1.49, 95% CI 1.17–1.90, p = 0.001), compared with an apparent HR of 1.58 per SD in the primary development-cohort analysis. Thus, adjustment for received imatinib dose intensity modestly attenuated, but did not eliminate, the association between the metabolomic risk score and PFS, suggesting that the prognostic signal was not explained solely by differences in treatment exposure.
Summary of key findings
Overall, the baseline five-metabolite plasma risk score was independently associated with PFS and provided incremental prognostic information beyond the prespecified clinical benchmark. The combined model showed improved discrimination, close agreement between predicted and observed progression-free probabilities, and higher decision-curve net benefit across the evaluated ranges of thresholds. These findings support the prognostic value of the panel but do not establish the benefit of score-guided clinical management. The metabolite panel also remained stable under bootstrap resampling, and its prognostic effect was consistent across the sensitivity analyses.
DATA AVAILABILITY:
The de-identified datasets supporting the findings of this study are provided as a separate supplementary folder accompanying this manuscript. These supplementary files contain the data used for the primary analyses reported in the study.
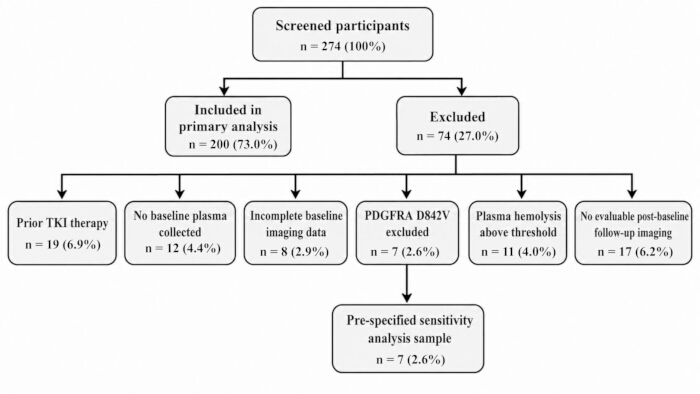
Figure 1: Study participant screening flowchart. Flow diagram showing participant eligibility assessment, exclusion criteria, and the final cohort included in the primary analysis. Patients with PDGFRA D842V mutation were additionally retained for the prespecified sensitivity analysis. Please click here to view a larger version of this figure.
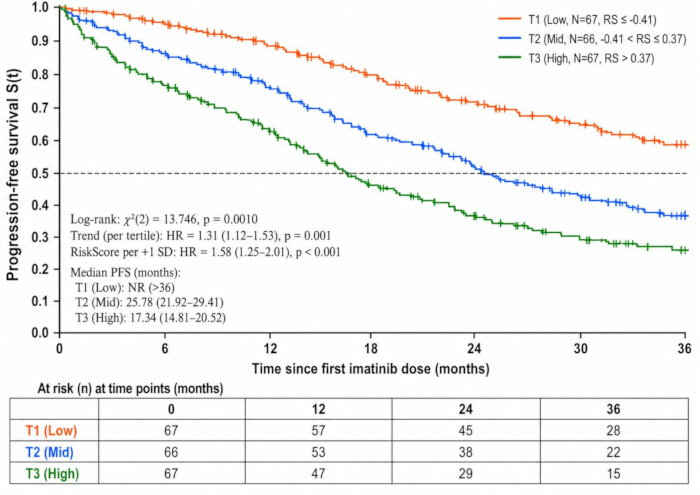
Figure 2: Apparent progression-free survival by metabolomic risk tertiles in the development cohort. T1, T2, and T3 represent low-, intermediate-, and high-risk groups defined by the 33.3rd and 66.7th percentiles of the fitted risk score. Kaplan–Meier curves were generated using all observed event and censoring times, with numbers at risk shown at 0, 12, 24, and 36 months. Median PFS and between-group comparisons are apparent development-cohort estimates rather than internally validated results. Please click here to view a larger version of this figure.
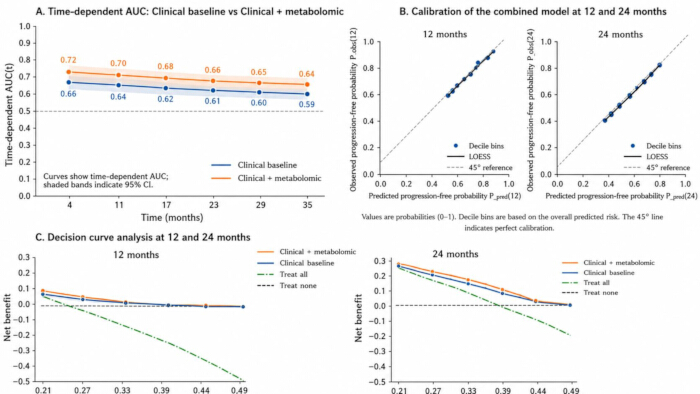
Figure 3: Discrimination, calibration, and decision-curve assessment of the combined model. (A) Time-dependent AUC curves; (B) Calibration plots at 1 year and 2 years; (C) Decision curve analysis within the 20–50% progression-risk threshold range at 1 year and 2 years. Please click here to view a larger version of this figure.
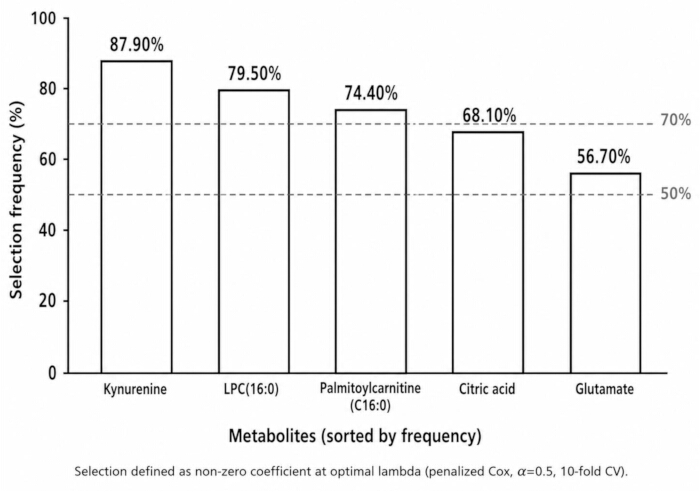
Figure 4: Feature selection stability under bootstrap resampling. Selection frequencies of candidate metabolites were evaluated across 1,000 bootstrap replicates, with the complete feature-selection pipeline repeated within each replicate. Higher selection frequencies indicate greater robustness of metabolite inclusion in the final risk score. Please click here to view a larger version of this figure.
| Variable | Level/Unit | Overall (N = 200) |
| Age | years, M[IQR] | 59.4 [51.6–68.2] |
| Sex | Male, n(%) | 113 (56.50%) |
| Female, n(%) | 87 (43.50%) | |
| ECOG performance status | 0–1, n(%) | 173 (86.50%) |
| ≥2, n(%) | 27 (13.50%) | |
| Primary site | Stomach, n(%) | 121 (60.50%) |
| Non-stomach, n(%) | 79 (39.50%) | |
| Disease setting | Metastatic/unresectable, n(%) | 200 (100.00%) |
| Adjuvant post-operation, n(%) | 0 (0.00%) | |
| Tumor burden | Sum of the longest diameters of target lesions at baseline (mm), M[IQR] | 86.7 [54.9–132.8] |
| Genotype (binary) | KIT Exon 11, n(%) | 117 (58.50%) |
| Other KIT or PDGFRA non-D842V, n(%) | 83 (41.50%) | |
| First imatinib dose | 400 mg qd, n(%) | 187 (93.50%) |
| Others, n(%) | 13 (6.50%) |
Table 1: Baseline clinical and molecular characteristics of the study population. Clinical, demographic, and molecular features of patients included in the primary analysis are summarized.
| Indicator | Value | 95% CI |
| Follow-up cutoff date | 2025-06-30 | — |
| Total person-time of follow-up (person-months) | 5178.64 | — |
| Number of PFS events (n) | 104 | — |
| Number censored (n) | 96 | — |
| Event proportion (n/N, %) | 104/200 (52.00%) | 44.84–59.10% |
| Median follow-up time (months) | 26.43 | 24.76–28.32 |
Table 2: Overview of follow-up and outcome events. Summary of follow-up duration, progression events, censoring information, and outcome characteristics during the study period.
| Metric | Positive ion mode (ESI+) | Negative ion mode (ESI−) | Combined dataset |
| Number of raw detected features (n) | 5842 | 4769 | 10611 |
| Number of features after blank filtering (n) | 5217 | 4276 | 9493 |
| Number of features with non-missing rate ≥80% (n) | 1954 | 1637 | 3591 |
| Number of pooled QC injections (n) | 27 | 26 | 53 |
| Retention time drift within QC (min) | |||
| Before correction M[IQR] | 0.19 [0.12–0.28] | 0.22 [0.14–0.31] | 0.20 [0.13–0.30] |
| After correction M[IQR] | 0.05 [0.03–0.07] | 0.06 [0.04–0.09] | 0.05 [0.04–0.08] |
| RSD of internal standard peak areas (%) | |||
| Before correction M[IQR] | 13.72 [10.66–17.84] | 15.26 [11.83–19.72] | 14.43 [11.25–18.65] |
| After correction M[IQR] | 6.41 [4.98–7.95] | 7.02 [5.47–8.68] | 6.71 [5.12–8.36] |
| Feature-level RSD (%), between QC samples | |||
| Before correction M[IQR] | 28.54 [22.31–36.47] | 31.62 [25.44–39.78] | 30.04 [23.98–38.22] |
| After correction M[IQR] | 14.09 [10.87–18.55] | 15.33 [11.52–20.11] | 14.79 [11.21–19.28] |
| Sample-level missingness (%), M[IQR] | 7.83 [5.42–10.96] | 9.17 [6.01–12.88] | - |
| Number of features annotated at MSI Level 1/2 (n) | 312 | 254 | 566 |
Table 3: Summary of LC-MS/MS analytical performance and quality control. Quality-control indicators before and after QC-RLSC correction, including feature retention, missingness, batch correction performance, and internal-standard stability, are summarized. RSD% = 100×(standard deviation/mean), calculated on repeated injections of pooled QC; batch correction used QC-RLSC, and sample-level normalization used internal standards. Sample-level missingness was calculated separately within each acquisition mode as the percentage of retained mode-specific features missing in each sample before KNN imputation; values are reported as median [IQR] across samples. Because the positive- and negative-ion modes contained distinct feature sets, no pooled combined-mode sample-level missingness value was calculated.
| Metabolite name | MSI level | Ion mode | m/z | RT (min) | β_shrunk (per +1 SD) | Direction | Major metabolic pathway |
| Kynurenine | 2 | ESI+ | 209.091 | 3.87 | 0.38 | Risk increase | Tryptophan–kynurenine pathway |
| Palmitoylcarnitine (C16:0) | 2 | ESI+ | 400.342 | 10.26 | 0.29 | Risk increase | Fatty acid β-oxidation/carnitine shuttle |
| LPC(16:0) | 2 | ESI+ | 496.339 | 9.72 | -0.33 | Risk decrease | Glycerophospholipid metabolism |
| Citric acid | 1 | ESI− | 191.020 | 8.94 | -0.28 | Risk decrease | Tricarboxylic acid (TCA) cycle |
| Glutamate | 2 | ESI− | 146.045 | 7.36 | 0.21 | Risk increase | Amino acid and energy metabolism |
Table 4: Final panel and coefficients of the metabolite risk score. The table presents the five selected metabolites, standardized coefficients, and the formula used to calculate the individual metabolomic risk score.
| Measure | Clinical benchmark | Clinical+metabolomic |
| C-index_apparent (95% CI) | 0.64 (0.60–0.69) | 0.70 (0.66–0.74) |
| C-index_corrected (95% CI) | 0.62 (0.57–0.66) | 0.68 (0.64–0.72) |
| iAUC_1–3y_apparent (95% CI) | 0.63 (0.59–0.67) | 0.69 (0.65–0.73) |
| iAUC_1–3y_corrected (95% CI) | 0.61 (0.57–0.65) | 0.66 (0.62–0.70) |
| IBS_1–3y_apparent | 0.19 | 0.17 |
| IBS_1–3y_corrected | 0.2 | 0.18 |
| Calibration slope_apparent | 1.03 | 1.02 |
| Calibration slope_corrected | 0.96 | 0.94 |
| Recalibration intercept a | 0.01 | −0.02 |
| Recalibration slope s | 0.99 | 0.97 |
| ΔC-index (95% CI) | — | 0.06 (0.02–0.11) |
| Penalized LRT χ2 (df=1); p | — | 9.842; 0.0017 |
| Global shrinkage factor (s) | 0.94 | 0.91 |
Table 5: Overview of model performance: clinical benchmark vs combined model. Bootstrap-corrected discrimination, calibration, prediction error, and incremental performance measures are compared between models. The integration intervals for iAUC_1–3y and IBS_1–3y were 1–3 years; 95% CI were BCa bootstrap two-sided intervals (α = 0.05). All bootstrap-corrected performance estimates were obtained from resampling in which the complete metabolite screening, feature-selection, tuning, and model-fitting pipeline was repeated within each replicate.
| A. Prespecified sensitivity analyses | |||||
| Scenario | N(E) | HR_per-SD (95% CI) | ΔC-index (95% CI) | ΔiAUC_1–3y | ΔIBS_1–3y |
| Including PDGFRA D842V | 207 (111) | 1.52 (1.21–1.95) | −0.01 (−0.03~0.002) | −0.01 | 0.01 |
| Tumor burden modeled with restricted cubic splines | 200 (104) | 1.57 (1.24–2.00) | +0.01 (0.00~0.02) | 0.01 | −0.01 |
| PFS recomputed using the Choi criteria | 200 (121) | 1.61 (1.29–2.05) | +0.02 (0.01~0.03) | 0.02 | −0.02 |
| B. Disease-specific strengthened clinical benchmark | |||||
| Model | N (E) | Corrected C-index (95% CI) | Corrected iAUC 1–3 y | Corrected IBS 1–3 y | Calibration slope |
| Strengthened clinical benchmark* | 200 (104) | 0.64 (0.59–0.68) | 0.63 | 0.19 | 0.95 |
| Strengthened benchmark + metabolomic score | 200 (104) | 0.69 (0.65–0.73) | 0.67 | 0.17 | 0.94 |
| Incremental difference | — | +0.05 (0.01–0.09) | 0.04 | −0.02 | — |
| C. Dose-intensity sensitivity analysis | |||||
| Analysis | N (events) | HR (95% CI) | |||
| Time-varying RDI, per 0.10 decrease | 200 (104) | 1.18 (1.04–1.34) | |||
| Metabolomic risk score, per +1 SD, adjusted for time-varying RDI | 200 (104) | 1.49 (1.17–1.90) |
Table 6: Summary of sensitivity analysis results. The table presents additional analyses assessing the influence of alternative genotype classification, endpoint definitions, PDGFRA D842V inclusion, and treatment exposure adjustment. Δ denotes the difference relative to the combined model in the main analysis; positive values indicate performance improvement. The Choi criteria were used only for endpoint substitution in the sensitivity analysis and do not replace RECIST 1.1 in the main analysis.
Supplementary Figure 1: Principal component analysis score plots before and after QC-RLSC batch correction. PC1 versus PC2 score plots of the retained metabolomic feature matrix before (A) and after (B) QC-RLSC correction, with samples grouped by analytical batch and pooled QC injections highlighted. Please click here to download this file.
Supplementary Table 1: Isotopic internal standards used for plasma metabolomic analysis. Detailed information on internal standards, concentrations, and analytical roles used for quality monitoring and normalization during LC-MS/MS analysis. Each internal standard was present at 250 ng/mL in the prechilled methanol precipitation solution. For each extraction, 400 µL of this solution was added to 100 µL plasma, corresponding to a nominal 100 ng of each internal standard per sample. The standards were used for extraction/instrument monitoring and sample-level normalization/semi-quantification rather than analyte-specific absolute calibration. Please click here to download this file.
Supplementary Table 2: Locked scoring specification for external validation of the five-metabolite risk score. The table provides metabolite coefficients, normalization parameters, and calculation procedures required for independent validation of the risk score. For deployment, the development-cohort normalization constants are part of the locked model specification. Published mean/SD values from external cohorts are not interchangeable because the LC-MS signal scale depends on platform, sample processing, internal-standard normalization, PQN/log transformation, and batch correction. Please click here to download this file.
讨论
In the development cohort, the fitted metabolomic risk score showed a strong apparent association with PFS, and tertile-based Kaplan–Meier analysis demonstrated an apparent survival gradient. Because the model coefficients, individual risk scores, and tertile cut-points were all derived from the same cohort, the apparent HRs, log-rank separation, and tertile-specific survival estimates may be optimistic and should therefore be interpreted as descriptive development-sample findings. Internal predictive validity was instead assessed using the .632+ bootstrap-corrected performance measures, including discrimination, calibration, and prediction error. These internally validated performance estimates support the prognostic potential of the score, although external validation remains necessary before routine clinical use. The signal was composed of kynurenine, palmitoylcarnitine, LPC(16:0), citric acid, and glutamate. Among the five metabolites, kynurenine deserves particular attention because it showed the highest and most stable selection frequency (>85%) during bootstrap resampling. Kynurenine is a major product of tryptophan catabolism through indoleamine 2,3-dioxygenase (IDO1) and tryptophan 2,3-dioxygenase (TDO2) and can activate the aryl hydrocarbon receptor (AHR). Activation of the kynurenine–AHR axis promotes an immunosuppressive tumor microenvironment by facilitating regulatory T-cell differentiation, supporting tolerogenic myeloid/macrophage phenotypes, and impairing cytotoxic T-cell activity18. This mechanism is particularly relevant to GIST because imatinib has been shown to reduce tumor-cell IDO expression and thereby enhance intratumoral CD8+ T-cell activity and induce regulatory T-cell apoptosis; conversely, administration of immunosuppressive tryptophan metabolites attenuated the antitumor effect of imatinib in a GIST model. More recently, single-cell analysis of human advanced GIST demonstrated enrichment of regulatory T cells and IDO1-positive dendritic cells in the imatinib-resistant tumor microenvironment. Accordingly, an elevated baseline plasma kynurenine level may reflect a pre-existing IDO/TDO–kynurenine–AHR-driven immunosuppressive state that weakens the immune component of imatinib activity and facilitates subsequent progression or resistance. However, because the study measured circulating metabolites rather than intratumoral IDO/TDO or AHR activity, this mechanistic interpretation remains hypothesis-generating and requires experimental validation. The remaining metabolites may reflect complementary metabolic dimensions. Palmitoylcarnitine is an intermediate of mitochondrial long-chain fatty-acid transport and oxidation19. In the model, its positive coefficient indicates that higher baseline palmitoylcarnitine was associated with a higher hazard of progression or death. Rather than indicating enhanced β-oxidative capacity or increased mitochondrial energy production, elevated circulating palmitoylcarnitine may reflect disturbed mitochondrial fatty-acid handling and incomplete β-oxidation, in which fatty-acyl delivery through the carnitine shuttle exceeds downstream oxidative flux. Of note, the negative coefficient of LPC(16:0) indicates that higher baseline LPC(16:0), rather than lower levels, was associated with a lower hazard of progression or death. Biologically, LPC is an intermediate of phosphatidylcholine remodeling, and its circulating concentration reflects the balance among phospholipase-mediated generation, lysophosphatidylcholine acyltransferase (LPCAT)-mediated reacylation, membrane turnover, and systemic lipid utilization20. In advanced cancer, particularly in cachectic states characterized by systemic inflammation and accelerated lipid catabolism, circulating glycerophospholipid pools may become depleted; metabolomic profiling has reported reductions in several LPC species in cachectic compared with non-cachectic patients. Therefore, relatively preserved LPC(16:0) in the cohort may reflect better-maintained phospholipid homeostasis and a less severe systemic catabolic and inflammatory phenotype, providing a biologically plausible explanation for its inverse association with PFS risk. Importantly, this association should not be interpreted as evidence that LPC(16:0) itself exerts a direct protective effect.
Decreased LPC(16:0) reflects membrane lipid remodeling and a low-grade inflammatory background20, and decreased citric acid together with increased glutamate jointly indicate tricarboxylic acid (TCA) anaplerosis and imbalance of nitrogen metabolism21. These pathways are intercoupled and represent the tumor–host systemic metabolic state rather than a surrogate of tumor burden, thereby explaining the retained independent effect after multivariable adjustment. Prior prognostic models for GIST have mainly focused on KIT/PDGFRA mutations, volume, and mitotic index22; metabolomics evidence at the liquid biopsy level is limited and mostly consists of exploratory small cohorts. Reports suggest that the kynurenine pathway and fatty acid oxidation are associated with TKI response23, but a quantitatively defined risk score with rigorous internal validation has been lacking. The present results integrate complementary metabolic dimensions involving immunometabolism, mitochondrial fatty-acid handling, membrane lipid remodeling, and central carbon/nitrogen metabolism into a single panel, providing incremental prognostic information beyond established molecular stratification.
After full-pipeline .632+ bootstrap internal validation, in which metabolite screening and feature selection were repeated within each replicate, the combined model with the metabolomic risk score achieved a statistically significant improvement in overall discrimination over the clinical benchmark, with time-dependent AUC remaining superior over 0–36 months and the advantage more evident at key time points; decile-based calibration at the 1- and 2-year time points approached the ideal slope, with close agreement between predicted and observed probabilities; within clinically relevant low–mid thresholds (early) and mid–high thresholds (later), the net benefit curves were higher than the reference strategies across selected threshold ranges, providing additional decision-analytic evidence of improved prognostic performance. The prespecified clinical benchmark used a binary KIT exon 11-versus-other genotype term, which may incompletely capture the distinct prognosis of KIT exon 9 tumors treated with standard-dose imatinib. The authors therefore performed an additional disease-specific sensitivity analysis in which KIT exon 9 was modeled separately from KIT exon 11 and other genotypes. With this strengthened benchmark, the optimism-corrected C-index was 0.64, increasing to 0.69 after addition of the metabolomic score, corresponding to an incremental ΔC-index of 0.05 (95% CI, 0.01–0.09). Thus, more detailed genotype modeling modestly attenuated the incremental gain from 0.06 to 0.05, but the additional prognostic contribution of the metabolomic panel remained evident. Treatment exposure represents another potential explanation for variation in PFS. Patients with a more adverse baseline metabolic state may also be less able to maintain full-dose imatinib because of toxicity or general clinical condition. In an additional sensitivity analysis incorporating pre-progression imatinib RDI as a time-varying covariate, lower RDI was associated with worse PFS, while adjustment for RDI only modestly attenuated the metabolomic risk-score HR from 1.58 to 1.49. This finding suggests that differences in treatment exposure may explain part, but not all, of the prognostic association of the baseline metabolic signature. Because received dose intensity is a post-baseline variable that may partly mediate the relationship between baseline health status and subsequent outcome, this analysis was interpreted as a sensitivity analysis rather than as part of the baseline prognostic model. The incremental value may reflect complementary dimensions of the tumor–host systemic metabolic state: the immunometabolic axis represented by kynurenine24, perturbed mitochondrial long-chain fatty-acid handling reflected by palmitoylcarnitine, membrane lipid remodeling reflected by LPC(16:0)25, and central carbon/nitrogen metabolism represented by citric acid and glutamate. These complementary metabolic dimensions provide prognostic information beyond genotype and tumor burden and may improve risk ranking and calibration. The observed gains in discrimination, calibration, and decision-curve net benefit support further evaluation of the panel as a prognostic tool. However, the present single-arm cohort does not establish that changing follow-up intensity, intervention thresholds, or trial-enrollment decisions according to the score improves patient outcomes. Such management applications would require external validation followed by prospective clinical-impact studies.
Beyond baseline PFS prediction, the five-metabolite panel may also have potential applications in longitudinal treatment monitoring. Serial measurement after initiation of imatinib could determine whether changes in the metabolomic risk score reflect early biological response before radiologic progression becomes apparent. Conversely, a rising or persistently high-risk metabolic profile during therapy might identify patients developing an unfavorable metabolic state and could therefore be evaluated as an early signal of emerging drug resistance. Such a dynamic application would require prospective validation with repeated sampling and predefined time points, because the present study assessed only baseline plasma. In addition, metabolomic information may be complementary to other minimally invasive or imaging-based biomarkers. Integration with ctDNA could combine systemic metabolic alterations with tumor-derived molecular information, while integration with radiomic features could link the circulating metabolic phenotype with spatial changes in tumor burden and heterogeneity9,26. Future multimodal models should evaluate whether these complementary data layers provide incremental discrimination, calibration, and clinical net benefit beyond each modality alone. These potential applications remain investigational and should not be interpreted as established clinical uses of the current panel.
The five-metabolite risk panel showed high selection frequencies with consistent coefficient directions under bootstrap resampling, platform QC, and batch correction markedly reduced drift and RSD, effects, and model performance remained stable in sensitivity contexts, and recalibration parameters were close to 1, indicating portability with minimal recalibration. The panel spans complementary dimensions of immunometabolism, mitochondrial fatty-acid handling, membrane lipid remodeling, and central carbon/nitrogen metabolism. In particular, the high bootstrap stability of kynurenine supports the IDO/TDO–kynurenine–AHR axis as a biologically plausible contributor to the prognostic signal. Importantly, palmitoylcarnitine carried a positive coefficient in the risk score, indicating that higher circulating levels were associated with higher progression risk. Accumulation of circulating long-chain acylcarnitines is more consistent with incomplete fatty-acid oxidation and a mismatch between mitochondrial fatty-acid delivery and downstream oxidative capacity than with enhanced β-oxidative flux or increased energy production27. The inverse prognostic association of LPC(16:0) may reflect preservation of circulating phospholipid homeostasis in patients with a lower systemic catabolic and inflammatory burden28. The present study also provides a framework for future translational development. Compared with previous exploratory metabolomic signatures that often involved numerous variables or lacked rigorous validation, the current five-metabolite panel combines a compact feature set with internal validation, quality-control procedures, and assessment of clinical utility29. However, the current untargeted LC-MS workflow provides relative/semi-quantitative signals rather than absolute concentrations. Because analyte-matched isotope-labeled standards were unavailable for some key metabolites, including kynurenine and LPC(16:0), future translation will require targeted LC-MS/MRM assays with appropriate calibration procedures and analytical validation before clinical application.
Several limitations should be acknowledged. First, this was a single-center prospective cohort with internal validation only; external spatiotemporal validation and cross-platform reproducibility remain to be established. Second, baseline plasma samples were analyzed without serial post-treatment sampling, limiting evaluation of dynamic metabolic changes during imatinib therapy. Third, residual confounding from factors such as metabolic status, concomitant medications, and treatment tolerance cannot be completely excluded. In addition, formal cachexia-related measurements were not incorporated, and the biological interpretation of some metabolites requires further investigation. Future studies should include multicenter validation, standardized sample-processing protocols, targeted quantitative assays, and prospective clinical-impact evaluations before the metabolomic panel can be considered for routine risk stratification.
披露
The authors have no conflicts of interest to declare.
致谢
None
FUNDING
None
材料
| 姓名 | 公司 | 目录编号 | 评论 |
|---|---|---|---|
| ACQUITY UPLC BEH Amide column (2.1 × 100 mm, 1.7 µm) | Waters Corporation | 186004801 | HILIC column used for negative-ion LC-MS/MS separation. |
| ACQUITY UPLC HSS T3 column (2.1 × 100 mm, 1.8 µm) | Waters Corporation | 186003539 | Reversed-phase column used for positive-ion LC-MS/MS separation. |
| AllPrep DNA/RNA FFPE Kit | QIAGEN | 80234 | DNA extraction from formalin-fixed paraffin-embedded tissue. |
| BWA-MEM and GATK (HaplotypeCaller/Mutect2) | BWA project; Broad Institute | N/A | Sequence alignment and variant calling for KIT/PDGFRA genotyping. |
| Compound Discoverer 3.3 | Thermo Fisher Scientific | Version 3.3 | LC-MS raw-data peak picking, alignment, and gap filling. |
| EDTA-K2 anticoagulant vacuum blood collection tubes (6.0 mL) | Becton, Dickinson and Company | 367863 | Baseline blood collection for plasma metabolomics. |
| HMDB and mzCloud databases | Human Metabolome Database; Thermo Fisher Scientific | N/A | MS/MS spectral matching and metabolite annotation. |
| Illumina NextSeq 550 sequencing system | Illumina | NextSeq 550 | Targeted next-generation sequencing of KIT and PDGFRA regions. |
| Isotope-labeled internal standard mixture | Cambridge Isotope Laboratories | N/A | Internal standard mixture containing [13C6]-glucose, [13C5,15N]-glutamate, d3-leucine, d4-citric acid, d5-phenylalanine, d9-carnitine, and d7-cholesterol, each at 250 ng/mL. |
| KAPA HyperPlus reagents | Roche | N/A | Used for next-generation sequencing library preparation. |
| LC-MS-grade solvents and mobile-phase reagents | Fisher Scientific | N/A | LC-MS-grade methanol, acetonitrile, formic acid, ammonium formate, and water used for metabolite extraction and chromatographic separation. |
| Pooled QC plasma | N/A | N/A | Injected every 10 study samples for analytical QC and QC-RLSC correction. |
| Q Exactive HF Orbitrap mass spectrometer | Thermo Fisher Scientific | Q Exactive HF | High-resolution mass spectrometer used for LC-MS/MS acquisition. |
| R (version 4.3.2) | R Foundation for Statistical Computing | Version 4.3.2 | Statistical analysis, preprocessing, modeling, validation, and sensitivity analyses. |
| R packages (survival, glmnet, survminer, timeROC, riskRegression, rms, mice, rmda, statTarget) | CRAN | survival 3.5-7; glmnet 4.1-8; survminer 0.4-9; timeROC 0.4; riskRegression 2023.09.20; rms 6.7-1; mice 3.16.0; rmda 1.6; statTarget 2.0 | Packages used for survival analysis, penalized modeling, validation, calibration, imputation, decision curves, and QC-RLSC. |
| Refrigerated benchtop centrifuge | Eppendorf | 5810 R | Used for refrigerated low-speed whole-blood/plasma separation at 4 °C. |
| Refrigerated microcentrifuge | Eppendorf | 5424 R | Used for refrigerated high-speed centrifugation of plasma and metabolite extracts at 4 °C. |
| Spectrophotometer | Thermo Fisher Scientific | NanoDrop 2000 | Used to assess plasma hemolysis by measuring absorbance at 414 nm. |
| Thermo Vanquish UHPLC system | Thermo Fisher Scientific | Vanquish UHPLC | UHPLC platform coupled to the Q Exactive HF Orbitrap for metabolomic analysis. |
参考文献
- Sugiyama Y, Sasaki M, Kouyama M, Tazaki T, Takahashi S, Nakamitsu A. Current treatment strategies and future perspectives for gastrointestinal stromal tumors. World J Gastrointest Pathophysiol. 2022;13(1):15-33.
- National Cancer Institute. Gastrointestinal stromal tumors treatment (PDQ®)–health professional version [Internet]. Updated 2024 Dec 13 [cited 2025 Sep 28]. Available from: https://www.cancer.gov/types/soft-tissue-sarcoma/hp/gist-treatment-pdq
- Dermawan JK, Kelly C, Gao Z, et al. Novel genomic risk stratification model for primary gastrointestinal stromal tumors (GIST) in the adjuvant therapy era. Clin Cancer Res. 2023;29(19):3974-3985.
- Joensuu H. KIT and PDGFRA variants and the survival of patients with gastrointestinal stromal tumor treated with adjuvant imatinib. Cancers (Basel). 2023;15(15):3879.
- Yang Y, Li S, Wang Y, et al. Protein tyrosine kinase inhibitor resistance in malignant tumors: molecular mechanisms and future perspective. Signal Transduct Target Ther. 2022;7:329.
- Suri GS, Kaur G, Carbone GM, Shinde D. Metabolomics in oncology. Cancer Rep (Hoboken). 2023;6(3):e1795.
- Broeckling CD, Beger RD, Cheng LL, et al. Current practices in LC-MS untargeted metabolomics: a scoping review on the use of pooled quality control samples. Anal Chem. 2023;95(51):18645-18654.
- Dhiman P, Ma J, Navarro CLA, et al. Methodological conduct of prognostic prediction models developed using machine learning in oncology: a systematic review. BMC Med Res Methodol. 2022;22:101.
- Paverd H, Zormpas-Petridis K, Clayton H, et al. Radiology and multi-scale data integration for precision oncology. NPJ Precis Oncol. 2024;8:158.
- Serrano C, Martín-Broto J, Asencio-Pascual JM, et al. 2023 GEIS guidelines for gastrointestinal stromal tumors. Ther Adv Med Oncol. 2023;15:17588359231192388.
- Benjamin D, Sato T, Cibulskis K, et al. Calling somatic SNVs and indels with Mutect2. bioRxiv [Preprint]. 2019.
- US Department of Health and Human Services, National Institutes of Health, National Cancer Institute. Common Terminology Criteria for Adverse Events (CTCAE), version 5.0 [Internet]. 2017 Nov 27. Available from: https://dctd.cancer.gov/research/ctep-trials/for-sites/adverse-events/ctcae-v5-5x7.pdf
- Mazzocca A, Minelli A, Paternostro F, Silletta M, Napolitano A, Vincenzi B. New molecularly targeted drugs for GIST after imatinib, sunitinib and regorafenib: a narrative review. Gastrointest Stromal Tumor. 2022;5:4.
- Eisenhauer EA, Therasse P, Bogaerts J, et al. New response evaluation criteria in solid tumors: revised RECIST guideline (version 1.1). Eur J Cancer. 2009;45(2):228-247.
- Yin P, Peter A, Franken H, et al. Preanalytical aspects and sample quality assessment in metabolomics studies of human blood. Clin Chem. 2013;59(5):833-845. doi:10.1373/clinchem.2012.199257.
- Louie KB, Kosina S, Harwood T, Faltane M, Lynde M, Bowen BP, Northen T. JGI/LBNL metabolomics: standard LC-MS/MS ESI method (Polar HILIC-Z). protocols.io. 2024.
- Cooper B, Yang R. An assessment of AcquireX and Compound Discoverer software 3.3 for non-targeted metabolomics. Sci Rep. 2024;14:4841.
- Campesato LF, Budhu S, Tchaicha J, Weng CH, Gigoux M, Cohen IJ, et al. Blockade of the AHR restricts a Treg–macrophage suppressive axis induced by L-kynurenine. Nat Commun. 2020;11:4011.
- Panov AV, Mayorov VI, Dikalov SI. Role of fatty acids β-oxidation in the metabolic interactions between organs. Int J Mol Sci. 2024;25(23):12740.
- Zhang Q, Yao D, Rao B, et al. The structural basis for the phospholipid remodeling by lysophosphatidylcholine acyltransferase 3. Nat Commun. 2021;12:6869.
- Martínez-Reyes I, Chandel NS. Mitochondrial TCA cycle metabolites control physiology and disease. Nat Commun. 2020;11:102.
- Vallilas C, Sarantis P, Kyriazoglou A, Koustas E, Theocharis S, Papavassiliou AG, et al. Gastrointestinal stromal tumors (GISTs): novel therapeutic strategies with immunotherapy and small molecules. Int J Mol Sci. 2021;22(2):493.
- Roulleaux Dugage M, Jones RL, Trent J, Champiat S, Dumont S. Beyond the driver mutation: immunotherapies in gastrointestinal stromal tumors. Front Immunol. 2021;12:715727.
- Chaudhry KA, Bianchi-Smiraglia A. The aryl hydrocarbon receptor as a tumor modulator: mechanisms to therapy. Front Oncol. 2024;14:1375905.
- Law SH, Chan ML, Marathe GK, Parveen F, Chen CH, Ke LY. An updated review of lysophosphatidylcholine: metabolism, molecular mechanisms, and potential clinical implications. Int J Mol Sci. 2019;20(5):1149.
- Collins GS, Dhiman P, Andaur Navarro CL, et al. Evaluation of clinical prediction models (part 1): measures of performance, model validation, and clinical usefulness. BMJ. 2024;384:e074819.
- Dambrova M, Makrecka-Kuka M, Kuka J, et al. Acylcarnitines: nomenclature, biomarkers, therapeutic potential, drug targets, and clinical trials. Pharmacol Rev. 2022;74(3):506-551.
- Bornstein R, Mulholland MT, Sedensky M, Morgan P, Johnson SC. Glutamine metabolism in diseases associated with mitochondrial dysfunction. Mol Cell Neurosci. 2023;126:103887.
- Cochran D, Noureldein M, Bezdeková D, et al. A reproducibility crisis for clinical metabolomics studies. Trends Anal Chem. 2024;180:117918.