Acupuncture attenuates myopia progression in a guinea pig model by suppressing scleral inflammation and enhancing neurotrophic signaling. The findings indicate a potential neuroimmune regulatory mechanism involving reduced NF-κB activation and enhanced brain-derived neurotrophic factor-mediated support.
研究文章
Acupuncture Attenuates Myopia Progression by Suppressing Scleral Inflammation and Enhancing Neurotrophic Signaling
* These authors contributed equally
本文内容
摘要
摘要
Myopia is a common ocular disorder characterized by excessive axial elongation, and effective strategies for limiting its progression remain limited. This study investigated whether acupuncture attenuates myopia progression in a guinea pig model of form-deprivation myopia and examined the involvement of scleral inflammation and brain-derived neurotrophic factor (BDNF)-mediated neurotrophic signaling. Guinea pigs were randomly assigned to control, myopia, acupuncture-only, and myopia plus acupuncture groups for phenotypic evaluation. Additional sham acupuncture and myopia-plus-acupuncture groups, combined with subconjunctival cyclotraxin B (CTX-B) administration, were included to evaluate acupuncture specificity and the involvement of BDNF/tropomyosin receptor kinase B (TrkB) signaling. Following intervention, refractive error and axial length were measured in the primary treatment groups. Scleral remodeling markers, including collagen type I alpha 1 (COL1A1) and α-smooth muscle actin (α-SMA); inflammatory mediators, including interleukin-1β (IL-1β), interleukin-6 (IL-6), and nuclear factor kappa B (NF-κB); and neurotrophic factors, including BDNF, TrkB, nerve growth factor, and neurotrophin-4, were evaluated using enzyme-linked immunosorbent assay, quantitative reverse transcription PCR, Western blotting, and immunofluorescence. Acupuncture was associated with reduced myopic refractive shifts and axial elongation. At the final observation time point, axial elongation was lower in the myopia plus acupuncture group than in the myopia group (ΔAL, 0.77 ± 0.19 mm vs. 1.42 ± 0.20 mm; Cohen’s d = 1.51). Acupuncture also reduced scleral IL-1β, IL-6, and NF-κB expression and increased BDNF, TrkB, nerve growth factor, and neurotrophin-4 expression. Sham acupuncture showed limited effects on these molecular changes, whereas CTX-B attenuated acupuncture-associated alterations in BDNF/TrkB signaling, extracellular matrix remodeling, and inflammatory markers. These findings suggest that acupuncture attenuates myopia progression through coordinated regulation of scleral inflammation and neurotrophic support involving BDNF/TrkB signaling.
引言
Myopia is a major global public health concern that compromises visual health, particularly in children and adolescents. Pathologically, myopia is characterized by excessive axial elongation and disruption of ocular homeostasis. The form-deprivation myopia guinea pig model recapitulates selected features of human refractive development and has been widely used to induce myopic shifts in refractive error and axial elongation1, together with associated retinal structural alterations such as retinal nerve fiber layer thinning2. Therefore, this model provides a valuable experimental platform for investigating mechanisms associated with myopia progression and evaluating potential therapeutic strategies.
Myopia progression is closely associated with dysregulation of the intraocular microenvironment, including inflammatory activation and impaired neurotrophic signaling. Form-deprivation myopia has been associated with increased expression of inflammatory mediators, including interleukin-1β (IL-1β) and interleukin-6 (IL-6), together with activation of nuclear factor kappa B (NF-κB) signaling, which may contribute to extracellular matrix (ECM) remodeling and scleral alterations3,4. Reduced expression of brain-derived neurotrophic factor (BDNF) and its high-affinity receptor, tropomyosin receptor kinase B (TrkB), has also been reported during myopia development, suggesting impaired neurotrophic support and altered tissue homeostasis3,4,5. These findings indicate that coordinated dysregulation of inflammatory responses and neurotrophic signaling may contribute to scleral remodeling and myopia progression, highlighting the importance of restoring microenvironmental homeostasis as a potential therapeutic strategy6.
Acupuncture, a traditional complementary therapy, has been proposed as a potential approach for myopia prevention through modulation of systemic and ocular microenvironmental homeostasis. Clinical data-mining studies suggest that both periocular acupoints, including Jingming, Zanzhu, and Sibai, and systemic acupoints, including Hegu and Zusanli, are frequently targeted in acupuncture-related interventions and may influence neuroimmune interactions7,8. Mechanistically, acupuncture has been reported to engage the vagus nerve–adrenal axis9, modulate sympathetic reflex activity, and regulate cytokine production10, which may contribute to alterations in neurotrophic signaling and inflammatory responses11. However, the molecular basis underlying the potential effects of acupuncture on myopia progression remains incompletely understood, particularly regarding the interaction between scleral inflammatory regulation and BDNF/TrkB-mediated neurotrophic signaling.
The present study aimed to evaluate whether acupuncture influences myopia progression by modulating scleral inflammatory responses and neurotrophic signaling in a guinea pig form-deprivation myopia model. The primary outcomes were changes in refractive error and axial length following acupuncture intervention. Exploratory molecular analyses were performed to characterize associated alterations in scleral inflammatory markers, including IL-1β, IL-6, and NF-κB; neurotrophic signaling molecules, including BDNF and TrkB; and ECM remodeling markers, including collagen type I alpha 1 (COL1A1) and α-smooth muscle actin (α-SMA). In addition, pharmacological inhibition of TrkB signaling using cyclotraxin B was performed to further assess the involvement of BDNF/TrkB-related mechanisms in acupuncture-associated molecular regulation.
方案
The study was approved by the Ethics Committee of Tongji Hospital, Shanghai (Approval No. SBKT-2024-237). All experimental procedures were conducted in accordance with institutional animal welfare guidelines and the principles outlined in the Guide for the Care and Use of Laboratory Animals12. The research tools used in this protocol are listed in the Table of Materials.
1. Animal model and treatment
Healthy male tricolor guinea pigs aged 3 weeks and weighing 90–110 g were screened to exclude ocular pathologies, including cataracts, corneal lesions, and myopia. Only male guinea pigs were included in this study as a predefined experimental design choice based on the established form-deprivation myopia model, which may limit the generalizability of the findings to both sexes. A total of 45 animals were included in this study and were randomly assigned to two experimental cohorts in accordance with the study objectives.
The phenotypic evaluation cohort consisted of four groups (n = 5 per group, total n = 20): control (Ctrl), myopia, acupuncture alone in normal animals (Acu), and myopia plus acupuncture (Myopia+Acu) groups. Refractive error and axial length were evaluated as the primary phenotypic outcomes.
The mechanistic validation cohort consisted of five groups (n = 5 per group, total n = 25): Ctrl, myopia, Myopia+Acu, myopia plus sham acupuncture (Myopia+Sham), and myopia plus acupuncture combined with cyclotraxin B (Myopia+Acu+CTX-B) groups. This cohort was used to evaluate acupuncture specificity and the involvement of BDNF/TrkB signaling.
Animals were randomly allocated to experimental groups. Given the exploratory design, no prior power calculation was performed. The observed effect size was subsequently estimated using Cohen’s d, with axial length change as the primary outcome.
Animals were housed under standard conditions consisting of a 12 h/12 h light-dark cycle, a temperature of 21 °C, and 50% relative humidity. Standard chow and fresh vegetables were provided twice daily. At 5 weeks of age, monocular form-deprivation myopia was induced exclusively in the right eye of myopia-related groups by continuous eyelid closure, whereas the contralateral left eye remained untreated and served as an internal control. The right eyelid was completely covered using an opaque occlusive material to prevent visual stimulation while avoiding direct compression of the ocular surface. The occlusion was checked daily throughout the induction period and maintained until tissue collection at 8 weeks of age.
During the modeling period, refractive error and axial length were measured to confirm successful model induction. Successful establishment of form-deprivation myopia was defined as a myopic shift accompanied by axial elongation in the deprived right eye relative to the untreated left eye.
Following initiation of form-deprivation myopia induction, acupuncture or sham acupuncture intervention was performed once weekly from 5–7 weeks of age. In the Acu group, normal guinea pigs received acupuncture stimulation without myopia induction. In the Myopia+Acu group, acupuncture was administered concurrently with form-deprivation myopia induction.
In the acupuncture groups, treatment was initiated concurrently with myopia induction at 5 weeks of age. Sterile disposable acupuncture needles (0.18 × 13 mm) were used. Needles were inserted superficially into Jingming (BL1), Taiyang (EX-HN5), Baihui (GV20), Dazhui (GV14), Hegu (LI4), Ganshu (BL18), and Zusanli (ST36) at an angle of approximately 45° along the skin surface and to a depth of 6–10 mm, according to the anatomical characteristics of each acupoint13. Following insertion, gentle manual stimulation was applied by rotating each needle through a small angle, generally ≤30°. Each acupuncture session lasted 1 min. Acupuncture was performed once weekly from 5–7 weeks of age, for a total of three sessions, by an experienced licensed acupuncturist14.
For the Myopia+Sham group, sham acupuncture was initiated after myopia induction. Needles were inserted at non-acupoints approximately 2 cm away from the corresponding true acupoints using the same number of needles, insertion angle (45°), stimulation procedure (rotation ≤30°), and duration (1 min) as those used in the acupuncture group.
For mechanistic validation of BDNF/TrkB signaling, animals in the Myopia+Acu+CTX-B group first received acupuncture intervention after myopia induction, followed by subconjunctival administration of the selective TrkB inhibitor cyclotraxin B (20 µL, 0.5 µg/µL) after acupuncture treatment once weekly from 5–7 weeks of age. Vehicle control and CTX-B-only groups were not included in the current study and are acknowledged as limitations. The intervention schedule was selected based on the rapid postnatal refractive development of guinea pigs, which are widely used as juvenile models of myopia.
At 8 weeks of age, after completion of all interventions, animals were deeply anesthetized by intraperitoneal administration of tribromoethanol (1.25%, 100–200 µL/10 g body weight). After confirmation of deep anesthesia by the absence of the withdrawal reflex, animals were euthanized by cervical dislocation in accordance with institutional animal welfare guidelines. The eyes were immediately enucleated, and the scleral tissues were carefully dissected and collected for subsequent molecular analyses. No unexpected adverse events occurred during the study, and no humane endpoints were reached before the predefined experimental endpoint.
For all subsequent analyses, including measurements of refractive error and axial length, ELISA, qRT-PCR, Western blotting, and immunofluorescence, the animal was considered the experimental unit. The two eyes from the same animal were not treated as independent observations. The untreated left eye was used only as an internal control for model confirmation and paired comparison.
2. Measurement of refractive error and axial length
Following cycloplegia, refractive error was measured by streak retinoscopy. Cycloplegia was induced using topical 1% cyclopentolate hydrochloride eye drops administered three times at 5 min intervals. Axial length was measured using A-scan ultrasonography15.
Measurements were obtained in manual mode with the probe positioned perpendicular to the corneal apex. Ten consecutive measurements were obtained for each eye, and the mean value was used for statistical analysis. Refractive error and axial length measurements were performed by the same investigator, who was blinded to group allocation.
3. Enzyme-linked immunosorbent assay
Scleral tissues were isolated and homogenized in ice-cold phosphate-buffered saline containing protease inhibitors (the same inhibitor mixture used for Western blotting). Homogenates were centrifuged at 12,000 × g for 15 min at 4 °C, and the supernatants were collected for cytokine quantification. Interleukin-1β and interleukin-6 levels were measured using enzyme-linked immunosorbent assay kits according to the manufacturer’s instructions.
4. Immunofluorescence staining
Scleral cryosections were fixed with 4% paraformaldehyde and permeabilized with 0.3% Triton X-100 for 15 min. Sections were incubated overnight at 4 °C with an anti-BDNF antibody. After incubation with the corresponding secondary antibodies (1:100), nuclei were counterstained with DAPI. Images were acquired using a fluorescence microscope. Image acquisition and quantification were performed using ImageJ software (version 1.54u8) under identical conditions by investigators blinded to the experimental groups.
5. Western blot analysis
Scleral tissues were lysed in RIPA buffer supplemented with protease (1:50) and phosphatase (1:50) inhibitors. Equal amounts of protein, 20 µg per lane, were separated by 10% sodium dodecyl sulfate-polyacrylamide gel electrophoresis and transferred onto polyvinylidene fluoride (PVDF) membranes.
Membranes were blocked with 5% bovine serum albumin and incubated overnight at 4 °C with primary antibodies against NF-κB, BDNF, TrkB, COL1A1, α-SMA, GAPDH, and β-actin.
After incubation with horseradish peroxidase-conjugated secondary antibodies (1:1000) for 1 h at 30 °C, immunoreactive bands were visualized using an enhanced chemiluminescence detection kit. Densitometric analysis was performed using ImageJ software (version 1.54u8), and protein expression was normalized to the corresponding loading controls.
6. Quantitative reverse transcription PCR
Total RNA was extracted from scleral tissues using TRIzol reagent. RNA concentration and purity were determined before reverse transcription. Complementary DNA was synthesized using a cDNA synthesis kit.
Quantitative reverse transcription PCR was performed using SYBR Green chemistry on a BD MAX Automated Real-Time PCR System. Each reaction contained 10 µL of SYBR Green Master Mix, 0.4 µL of forward primer, 0.4 µL of reverse primer, 2 µL of cDNA template, and nuclease-free water to a final volume of 20 µL.
The amplification protocol consisted of an initial denaturation at 95 °C for 30 s, followed by 40 cycles, each consisting of 5 s at 95 °C and 30 s at 60 °C. Melting-curve analysis was performed to verify amplification specificity. Relative gene expression was calculated using the 2−ΔΔCt method and normalized to β-actin expression. Primer sequences are listed in Table 1.
| Gene | Forward | Reverse |
| β-actin | ACTGCCGCATCCTCTTCCTC | AACCGCTCGTTGCCAATAGTG |
| NGF | AGGTGCACAGAGAGCATTGG | ACACTGTGTATCTGCCTGAGC |
| NT-4 | TGACAGGTGCTCCGAGAGAT | CTCCAGCAGGAAGAGCAGAG |
| TrkB | CAGATTCCGAGCCGCAAAAG | GTAGAGGCTGTCTCCCTTGC |
| BDNF | GGTGAGAAGAGTGATGACCATCC | GCTGTCACACACGCTCAGCT |
| NF-ΚB | CAGCTCTTCTCAAAGCAGCA | TGCTTCTCTCCCCAGGAATA |
| Col1A1 | AGGGCCAAGACGAAGACATC | AGATCACGTCATCGCACAACA |
| α-sma | CCCTGGAGAAGAGCTACGAA | TTTCGTCTGGATTCGCGGTC |
Table 1: Primer sequences used for quantitative reverse transcription PCR. Forward and reverse primer sequences are listed for β-actin, NGF, NT-4, TrkB, BDNF, NF-κB, COL1A1, and α-SMA.
7. Statistical analysis
Each animal was considered the experimental unit and an independent biological replicate. Statistical analyses were performed using animal-level data. Technical replicates, when performed, were averaged within each biological replicate before statistical analysis and were not treated as independent observations.
Quantitative data are presented as the mean ± standard error of the mean (SEM), calculated from individual animal-level measurements. Comparisons between two groups were performed using a two-tailed Student’s t-test. Comparisons among multiple groups were performed using a one-way analysis of variance, followed by Tukey’s multiple comparisons test. Statistical significance was interpreted according to the specific comparisons reported in the corresponding tables or figures. Statistical analyses were conducted using GraphPad Prism 9.0. A two-sided P < 0.05 was considered statistically significant.
结果
Acupuncture alleviates myopia progression in guinea pigs
A monocular form-deprivation myopia model was established to evaluate the effects of acupuncture on myopia progression. The right eyes were subjected to continuous form deprivation from 5–8 weeks of age, whereas the contralateral left eyes remained untreated and served as intra-animal controls. Animals were randomly assigned to the experimental groups. The experimental timeline and intervention schedule are shown in Figure 1.
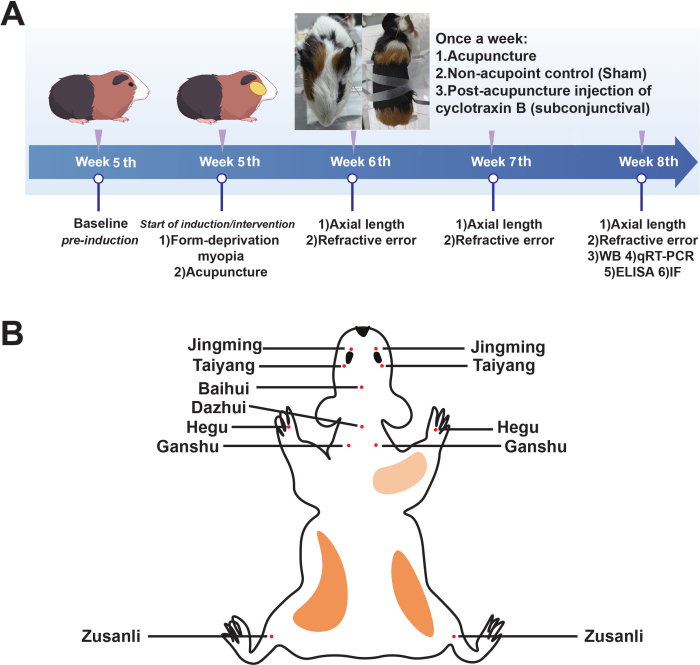
Figure 1: Experimental timeline and acupuncture acupoint schematic. (A) Schematic overview of monocular form-deprivation myopia induction, acupuncture, and sham acupuncture intervention schedules. Guinea pigs at 5 weeks of age were used as the baseline reference. At 5 weeks of age, form-deprivation myopia was induced in the right eye, whereas the contralateral left eye remained untreated and served as an internal control. Acupuncture or sham acupuncture interventions were initiated after myopia induction and performed once weekly from 5–7 weeks of age (three sessions in total). For pharmacological inhibition of TrkB signaling, animals in the Myopia+Acu+CTX-B group received acupuncture followed by subconjunctival administration of cyclotraxin B (CTX-B; 20 µL, 0.5 µg/µL) at each weekly intervention. Final phenotypic assessments and tissue collection were performed at 8 weeks of age. (B) An anatomical schematic showing the acupoints stimulated during acupuncture treatment. Please click here to view a larger version of this figure.
Baseline axial length did not differ significantly among the groups before myopia induction (Table 2). Axial-length changes across the intervention period are presented in Table 3. At the final observation time point, axial elongation was lower in the myopia plus acupuncture group than in the myopia group (ΔAL, 0.77 ± 0.19 mm vs. 1.42 ± 0.20 mm), corresponding to a large observed effect size (Cohen’s d = 1.51). Baseline refractive error also did not differ significantly among the groups before myopia induction (Table 4). Changes in refractive error relative to baseline are presented in Table 5.
| Group | N | Baseline | Axial length after acupuncture treatment | ||
| (mm, mean ± SEM) | (mm, mean ± SEM) | ||||
| Week 1 | Week 2 | Week 3 | |||
| Control | 5 | 7.65 ± 0.08 | 7.62 ± 0.14 | 7.56 ± 0.13 | 8.03 ± 0.08 |
| Myopia | 5 | 7.74 ± 0.09 | 8.28 ± 0.12 | 8.89 ± 0.16 | 9.16 ± 0.16 |
| P value (vs Control) | 0.442 | 0.009 | <0.001 | <0.001 | |
| Acupuncture | 5 | 7.48 ± 0.14 | 7.75 ± 0.04 | 7.67 ± 0.14 | 8.15 ± 0.005 |
| P value (vs Control) | 0.342 | 0.415 | 0.562 | 0.28 | |
| Myopia + Acupuncture | 5 | 7.59 ± 0.15 | 8.02 ± 0.09 | 8.02 ± 0.10 | 8.36 ± 0.09 |
| P value (vs Control) | 0.751 | 0.052 | 0.017 | 0.019 | |
| Note: Axial length was measured at baseline (5 weeks of age) and at weeks 1, 2, and 3 after initiation of intervention (corresponding to 6, 7, and 8 weeks of age, respectively). Data are presented as mean ± SEM (n = 5 animals per group), calculated from individual animal-level measurements. P values indicate Tukey-adjusted comparisons between each experimental group and the Control group at the corresponding time point following one-way ANOVA. | |||||
Table 2: Right-eye axial length before and after acupuncture treatment. Axial length was measured at baseline (5 weeks of age) and at weeks 1, 2, and 3 after initiation of intervention (corresponding to 6, 7, and 8 weeks of age, respectively). Data are presented as mean ± SEM (n = 5 animals per group), calculated from individual animal-level measurements. P values indicate Tukey-adjusted comparisons between each experimental group and the Control group at the corresponding time point following one-way ANOVA.
| Group | ΔAL after Week 1 (mm) | ΔAL after Week 2 (mm) | ΔAL after Week 3 (mm) |
| (P value) | (P value) | (P value) | |
| Control | -0.03 ± 0.11 (0.791) | -0.09 ± 0.08 (0.391) | +0.38 ± 0.11 (0.021*) |
| Myopia | +0.54 ± 0.21 (0.014*) | +1.15 ± 0.23 (0.002**) | +1.42 ± 0.20 (0.001***) |
| Acupuncture | +0.27 ± 0.12 (0.131) | +0.19 ± 0.19 (0.270) | +0.67 ± 0.16 (0.009**) |
| Myopia + Acupuncture | +0.43 ± 0.22 (0.126) | +0.43 ± 0.21 (0.115) | +0.77 ± 0.19 (0.008**) |
| Note: Changes in axial length were calculated as ΔAL = axial length after treatment − baseline axial length. Values represent changes at week 1, week 2, and week 3 after initiation of intervention (corresponding to 6, 7, and 8 weeks of age, respectively) and are presented as mean ± SEM (n = 5 animals per group). Parenthetical P values indicate comparisons with the Control group at each corresponding time point. * p < 0.05, ** p < 0.01, *** p < 0.001 | |||
Table 3: Changes in right-eye axial length relative to baseline during acupuncture treatment. (ΔAL = axial length after treatment − baseline axial length). Changes in axial length were calculated as ΔAL = axial length after treatment − baseline axial length. Values represent changes at week 1, week 2, and week 3 after initiation of intervention (corresponding to 6, 7, and 8 weeks of age, respectively) and are presented as mean ± SEM (n = 5 animals per group). Parenthetical P values indicate comparisons with the Control group at each corresponding time point. *P < 0.05, **P < 0.01, ***P < 0.001.
| Group | N | Baseline refraction | Refraction after acupuncture treatment | ||
| (diopters, mean ± SEM) | (diopters, mean ± SEM) | ||||
| Week1 | Week2 | Week3 | |||
| Control | 5 | 2.25 ± 0.42 | 2.85 ± 0.34 | 2.90 ± 0.38 | 1.50 ± 0.41 |
| Myopia | 5 | 2.10 ± 0.38 | 0.60 ± 0.20 | 0.05 ± 0.22 | -0.15 ± 0.26 |
| P value (vs Control) | 0.782 | 0.001 | <0.001 | 0.012 | |
| Acupuncture | 5 | 2.70 ± 0.57 | 2.45 ± 0.20 | 2.45 ± 0.29 | 1.20 ± 0.24 |
| P value (vs Control) | 0.481 | 0.315 | 0.345 | 0.521 | |
| Myopia + Acupuncture | 5 | 2.45 ± 0.48 | 1.55 ± 0.37 | 1.35 ± 0.27 | 1.00 ± 0.18 |
| P value (vs Control) | 0.754 | 0.032 | 0.015 | 0.268 | |
| Note: Refractive error was measured at baseline (5 weeks of age) and at weeks 1, 2, and 3 after initiation of intervention (corresponding to 6, 7, and 8 weeks of age, respectively). Data are presented as mean ± SEM (n = 5 animals per group). The control group consisted of separate untreated normal animals. P values indicate comparisons between each experimental group and the Control group at the corresponding time point. | |||||
Table 4: Changes in right eye refraction in myopic animals before and after acupuncture treatment. Refractive error was measured at baseline (5 weeks of age) and at weeks 1, 2, and 3 after initiation of intervention (corresponding to 6, 7, and 8 weeks of age, respectively). Data are presented as mean ± SEM (n = 5 animals per group). The control group consisted of separate untreated normal animals. P values indicate comparisons between each experimental group and the Control group at the corresponding time point.
| Group | Δ Refraction after Week 1 (diopters) | Δ Refraction after Week 2 (diopters) | Δ Refraction after Week 3 (diopters) |
| (P value) | (P value) | (P value) | |
| Control | +0.60 ± 0.22 (0.132) | +0.65 ± 0.38 (0.143) | -0.75 ± 0.47 (0.118) |
| Myopia | -1.50 ± 0.57 (0.021*) | -2.05 ± 0.54 (0.008**) | -2.25 ± 0.50 (0.007**) |
| Acupuncture | -0.25 ± 0.53 (0.623) | -0.25 ± 0.59 (0.623) | -1.50 ± 0.61 (0.063) |
| Myopia + Acupuncture | -0.90 ± 0.73 (0.076) | -1.10 ± 0.59 (0.052) | -1.45 ± 0.53 (0.056) |
| Note: Δ Refraction was calculated as refractive error after intervention − baseline refractive error. Values represent changes at week 1, week 2, and week 3 after initiation of intervention (corresponding to 6, 7, and 8 weeks of age, respectively) and are presented as mean ± SEM (n = 5 animals per group). Parenthetical P values indicate comparisons with the Control group at each corresponding time point. * p < 0.05, ** p < 0.01, *** p < 0.001 | |||
Table 5: Changes in right-eye refractive error relative to baseline during acupuncture treatment. (Δ Refraction = refraction after treatment − baseline refraction). Note: Δ Refraction was calculated as refractive error after intervention − baseline refractive error. Values represent changes at week 1, week 2, and week 3 after initiation of intervention (corresponding to 6, 7, and 8 weeks of age, respectively) and are presented as mean ± SEM (n = 5 animals per group). Parenthetical P values indicate comparisons with the Control group at each corresponding time point. * p < 0.05, ** p < 0.01, *** p < 0.001
Overall, the acupuncture-treated myopia group showed less axial elongation and refractive deterioration than the untreated myopia group.
Acupuncture attenuates scleral inflammation in guinea pigs
To evaluate inflammatory changes associated with myopia, scleral tissues from the experimental eyes were analyzed, with 5 animals per group. The expression levels of the pro-inflammatory cytokines IL-1β and IL-6 were significantly higher in the myopia group than in the control group. Lower IL-1β and IL-6 levels were observed in the myopia plus acupuncture group than in the untreated myopia group. In normal guinea pigs, acupuncture alone did not alter basal IL-1β or IL-6 expression (Figure 2A, B).
NF-κB expression was also significantly higher in the myopia group than in the control group, whereas acupuncture suppressed the myopia-associated increase in NF-κB expression (Figure 2C, D).
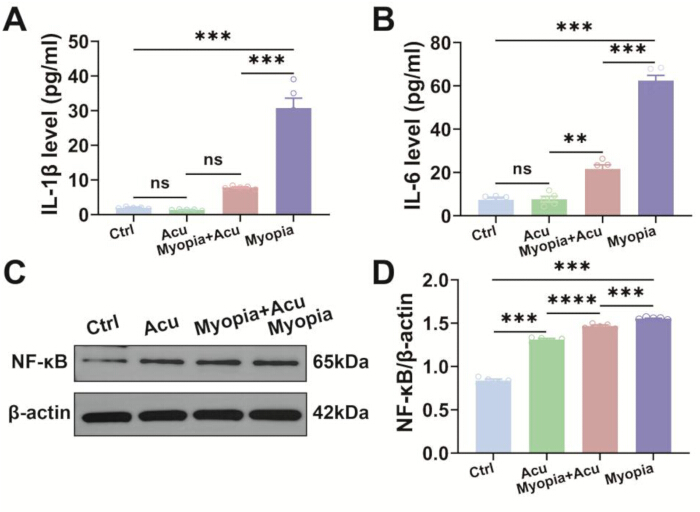
Figure 2. Acupuncture attenuates myopia-induced scleral inflammation. (A, B) Relative levels of (A) IL-1β and (B) IL-6 in scleral tissues from different experimental groups. (C) Representative Western blot analysis of NF-κB expression, with β-actin as the loading control. (D) Densitometric quantification of NF-κB protein expression (C). Ctrl, untreated contralateral control eyes; Acu, acupuncture alone eyes; Myopia+Acu, myopia plus acupuncture eyes; Myopia, form-deprivation myopia eyes. Data are presented as mean ± SEM. Individual data points represent biological replicates. Statistical comparisons were performed using one-way analysis of variance (ANOVA) followed by Tukey’s post hoc test. ns, not significant; * P < 0.05; ** P < 0.01; *** P < 0.001. Please click here to view a larger version of this figure.
These findings indicate that acupuncture attenuated scleral inflammatory responses in the form-deprivation myopia model without increasing pro-inflammatory marker expression under normal conditions.
Acupuncture modulates neurotrophic signaling in myopic guinea pigs
Changes in neurotrophic signaling were assessed in scleral tissues from deprived eyes using quantitative reverse transcription PCR and Western blotting. Form deprivation reduced NGF, NT-4, and TrkB mRNA expression relative to untreated control eyes, whereas acupuncture increased their expression (Figure 3A–C).
BDNF and TrkB protein expression was also reduced in scleral tissues from the myopia group16. Acupuncture reversed these reductions. In normal guinea pigs, acupuncture increased TrkB protein expression, whereas BDNF protein expression remained unchanged (Figure 3D, E). These findings indicate that acupuncture attenuated myopia-associated inflammatory changes and enhanced neurotrophic signaling.
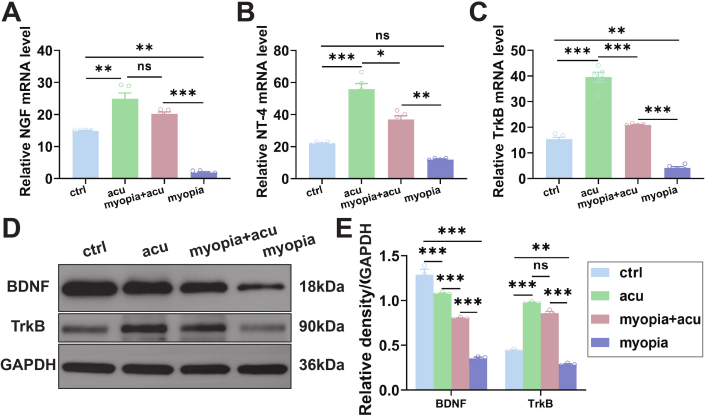
Figure 3. Acupuncture promotes neurotrophic support in the myopia model. (A–C) Relative mRNA expression levels of (A) nerve growth factor (NGF), (B) neurotrophin-4 (NT-4), and (C) tropomyosin receptor kinase B (TrkB) in scleral tissues. (D) Representative Western blot analysis of brain-derived neurotrophic factor (BDNF) and TrkB expression, with GAPDH as the loading control. (E) Densitometric quantification of protein expression corresponding to (D). Ctrl, untreated contralateral control eyes; Acu, acupuncture alone eyes; Myopia+Acu, myopia plus acupuncture eyes; Myopia, form-deprivation myopia eyes. Data are presented as mean ± SEM. Individual data points represent biological replicates. Statistical comparisons were performed using one-way ANOVA followed by Tukey’s post hoc test. ns, not significant; * P < 0.05; ** P < 0.01; *** P < 0.001. Please click here to view a larger version of this figure.
Acupuncture regulates scleral neurotrophic and inflammatory markers through BDNF/TrkB signaling
To further evaluate the involvement of BDNF/TrkB signaling, myopic guinea pigs receiving acupuncture were additionally treated with the TrkB inhibitor cyclotraxin B (CTX-B). Scleral tissues from the treated eyes were collected for molecular analyses.
BDNF is a neurotrophic factor involved in neuroplasticity, synaptic dysfunction, and optic nerve injury associated with myopia17. BDNF has also been associated with inflammatory responses, oxidative stress, and tissue-remodeling processes during myopia progression3. Scleral BDNF expression was significantly lower in the myopia group than in the control group18, whereas acupuncture restored BDNF expression (Figure 4A, B). Western blot analysis further showed that acupuncture was associated with changes in COL1A1 and α-smooth muscle actin (α-SMA) expression (Figure 4C, D).
Quantitative reverse transcription PCR was then used to further assess BDNF/TrkB signaling and related molecular markers (Figure 5A–E). BDNF mRNA expression was higher following acupuncture treatment, whereas this increase was attenuated in animals receiving CTX-B (Figure 5A).
TrkB expression was reduced after myopia induction and increased after acupuncture treatment. The acupuncture-associated increase in TrkB expression was attenuated by CTX-B treatment (Figure 5B). COL1A1 and α-smooth muscle actin (α-SMA), which are associated with scleral extracellular matrix remodeling3, were also evaluated. Myopia induction was associated with reduced COL1A1 expression and increased α-SMA expression. These changes were partially attenuated by CTX-B treatment (Figure 5C, D).
NF-κB expression was increased in myopic scleral tissues and reduced following acupuncture treatment. CTX-B partially attenuated the acupuncture-associated reduction in NF-κB expression (Figure 5E). A sham acupuncture group was included to assess the specificity of acupuncture-associated effects. Sham acupuncture produced limited changes in scleral molecular markers, whereas acupuncture altered neurotrophic, inflammatory, and extracellular matrix-related markers (Figure 5A–E). Collectively, these findings indicate that acupuncture-associated regulation of scleral neurotrophic, inflammatory, and extracellular matrix-related markers involved BDNF/TrkB signaling.
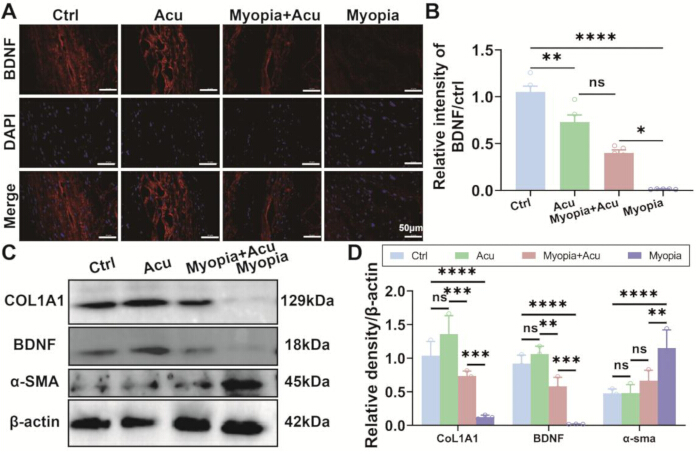
Figure 4. Acupuncture mitigates myopia progression by modulating BDNF signaling. (A) Representative immunofluorescence images showing BDNF expression in scleral tissues. Scale bar = 50 µm. (B) Quantitative analysis of BDNF fluorescence intensity corresponding to (A). Quantification was performed using n = 5 biological replicates per group. (C) Representative Western blot analysis of collagen type I alpha 1 (COL1A1), BDNF, and α-smooth muscle actin (α-SMA) expression, with β-actin as the loading control. (D) Densitometric quantification of protein levels corresponding to (C), using n = 3 biological replicates per group. Ctrl, control; Acu, acupuncture alone; Myopia+Acu, myopia plus acupuncture; Myopia, form-deprivation myopia. Data are presented as mean ± SEM. Individual data points represent biological replicates. Please click here to view a larger version of this figure.
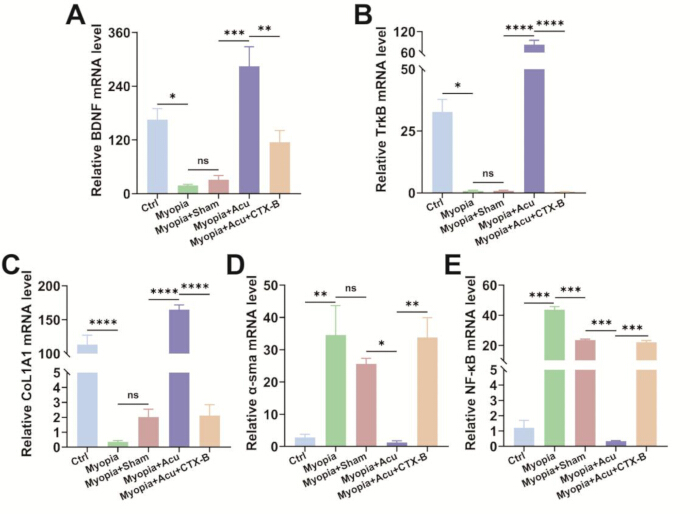
Figure 5. Effects of acupuncture, sham acupuncture, and TrkB inhibition on scleral BDNF/TrkB-related and inflammatory gene expression. Quantitative reverse transcription PCR analysis of scleral mRNA expression levels of (A) BDNF, (B) TrkB, (C) COL1A1, (D) α-SMA, and (E) NF-κB. Experimental groups were defined as follows: Ctrl, untreated contralateral control eyes; Myopia, right eyes subjected to form-deprivation myopia; Myopia+Sham, myopic right eyes treated with sham acupuncture; Myopia+Acu, myopia plus acupuncture eyes; Myopia+Acu+CTX-B, myopic right eyes treated with acupuncture followed by subconjunctival cyclotraxin B administration. Gene expression levels were normalized to β-actin expression and represent mRNA expression changes rather than protein-level alterations. Data are presented as mean ± SEM. Statistical comparisons were performed using one-way ANOVA followed by Tukey’s post hoc test. Statistical brackets indicate the specific comparisons shown in each panel. ns, not significant; * P < 0.05; ** P < 0.01; *** P < 0.001. Please click here to view a larger version of this figure.
DATA AVAILABILITY:
The source data supporting the quantitative analyses presented in this study are provided in Supplementary File 1.
Supplementary File 1: The source data supporting the quantitative analyses. Please click here to download this file.
讨论
Myopia represents a significant global public health challenge. Current management strategies primarily include low-concentration atropine and orthokeratology lenses19,20. Although these interventions can retard axial elongation and improve choroidal blood perfusion21, their use may be limited by adverse effects, including photophobia and cycloplegia associated with atropine and the risk of microbial keratitis associated with orthokeratology lens use22,23. These limitations support the need for alternative or adjunctive therapeutic strategies. Acupuncture, a traditional Chinese medicine modality, has received increasing attention as a potential approach for myopia prevention and control24. In the present study, acupuncture attenuated axial elongation and refractive deterioration in a guinea pig model of form-deprivation myopia.
Acupuncture was also associated with coordinated changes in the ocular microenvironment. Expression of the inflammatory mediators IL-1β, IL-6, and NF-κB was reduced in scleral tissues, whereas expression of the neurotrophic factors BDNF, NGF, NT-4, and TrkB was increased. Acupuncture did not increase IL-1β or IL-6 expression in normal tissues, indicating that the observed inflammatory changes were associated with the myopic condition rather than a generalized pro-inflammatory response.
Inflammatory responses contribute to the onset and progression of myopia. In high myopia-associated fundus pathology, pro-inflammatory cytokines such as IL-1β may induce apoptosis in retinal pigment epithelial cells, compromise photoreceptor integrity, and stimulate the release of additional cytokines, including IL-6. These responses can activate inflammatory pathways such as NF-κB and contribute to extracellular matrix remodeling in scleral fibroblasts, axial elongation, and myopia progression25. Acupuncture, particularly stimulation of acupoints such as Zusanli, has been reported to activate neuroimmune pathways, including the vagus nerve–adrenal axis and spinal-sympathetic reflex26, and to suppress inflammatory mediators such as IL-6 and tumor necrosis factor-α27. In the present study, acupuncture reduced scleral IL-1β, IL-6, and NF-κB expression in the myopia model. These findings are consistent with an anti-inflammatory effect of acupuncture in the scleral microenvironment. However, the neural mechanisms underlying this response were not directly examined.
The retina and visual cortex are central components of the visual pathway. Myopia has been associated with thinning of the retinal nerve fiber layer and inner plexiform layer, together with altered neuronal activity in the visual cortex15. Neurotrophic factors, including nerve growth factor and brain-derived neurotrophic factor, contribute to nervous system development and homeostasis. Reduced aqueous humor levels of these factors in myopic patients have been associated with refractive dysregulation and optic nerve plasticity. Nerve growth factor supports axonal regeneration and myelination and modulates neuronal and glial signaling. Brain-derived neurotrophic factor activates TrkB signaling and contributes to neuronal survival, differentiation, and synaptic plasticity. In the present study, acupuncture-associated increases in BDNF, NGF, NT-4, and TrkB expression occurred concurrently with reduced scleral inflammatory marker expression. These findings indicate coordinated regulation of neurotrophic and inflammatory responses during acupuncture treatment.
Insufficient neurotrophic support and progressive inflammation are both associated with the development of myopia. Previous studies have reported that acupuncture can modulate BDNF/TrkB expression in irritable bowel syndrome8 and increase cerebral BDNF expression in depression18. Consistent with these observations, scleral BDNF expression was reduced in myopic guinea pigs and increased following acupuncture treatment. Exposure to lipopolysaccharide or pro-inflammatory cytokines can reduce neuronal BDNF gene and protein expression3. BDNF has also been described as a regulator of inflammatory signaling through IKKα, IKKβ, and PLC-γ/PKC-associated pathways. Activation of these pathways can promote phosphorylation of IκBα5, followed by ubiquitination and proteasomal degradation, thereby altering NF-κB-associated inflammatory signaling. Higher baseline BDNF levels have also been associated with greater resilience to inflammatory injury and improved recovery4. Accordingly, the reduction in scleral inflammatory markers following acupuncture is consistent with the reported anti-inflammatory and neuroprotective functions of BDNF.
Pharmacological inhibition of TrkB signaling with cyclotraxin B following acupuncture intervention attenuated acupuncture-associated changes in BDNF, TrkB, COL1A1, α-SMA, and NF-κB expression. These findings support the involvement of BDNF/TrkB signaling in the regulation of scleral neurotrophic, inflammatory, and extracellular matrix-related markers. However, the current data do not establish a complete causal pathway or determine whether BDNF/TrkB activation precedes inflammatory suppression or results from reduced inflammation.
Several limitations should be acknowledged. The small sample size and absence of genetic validation limit the mechanistic interpretation of the findings. Although sham acupuncture was included to evaluate the specificity of acupuncture stimulation, phenotypic outcomes were not assessed in the sham group. In addition, vehicle control and CTX-B-only groups were not included, and therefore, the independent effects of injection procedures or direct TrkB inhibition cannot be completely excluded. The experimental design also does not clarify the temporal sequence of BDNF/TrkB signaling regulation and inflammatory suppression or establish a hierarchical causal relationship. Time-course analyses and specific genetic approaches are required to further define these mechanisms. In addition, differences between guinea pigs and humans in ocular anatomy, refractive development, and immune microenvironment may restrict direct clinical translation. Clinical application may also depend on treatment adherence and standardization of acupoint selection, stimulation parameters, treatment frequency, and duration. Larger cohorts, standardized acupuncture protocols, long-term safety assessments, and well-designed clinical trials are required to further evaluate the translational potential of acupuncture for myopia management.
In conclusion, acupuncture attenuated axial elongation and refractive deterioration while increasing neurotrophic marker expression and reducing scleral inflammatory marker expression in guinea pigs with form-deprivation myopia. The effects of TrkB inhibition further support the involvement of BDNF/TrkB signaling in these molecular responses. These findings provide a framework for further investigation of coordinated neurotrophic and inflammatory regulation in myopia.
披露
The authors declare no conflicts of interest related to this work.
Author Contributions:
Bing Li and Min Li contributed to conceptualization, funding acquisition, project administration, and supervision. Jie Zhang, Yanping Zhou, and Ying Wang contributed to methodology. Jie Zhang, Yanping Zhou, Ying Wang, Wenyang Xu, Yanyu Shangguan conducted the investigation. Jie Zhang, Yanping Zhou, and Ying Wang contributed to data curation. Jie Zhang performed the formal analysis, prepared the visualizations, and drafted the original manuscript. Bing Li, Min Li, and Jie Zhang reviewed and edited the manuscript.
致谢
This work was supported by the China International Medical Exchange Foundation (Grant No. Z-2017-26-2402), the Clinical Research Cultivation Program of Shanghai Tongji Hospital (No. ITJ(QN)2405), and the “Jiebang Guashuai” Innovation Program of Renji Hospital, Shanghai Jiao Tong University School of Medicine (No. RJTJ25-MS-081). Artificial intelligence assistance was used exclusively for language editing. All scientific content, data analysis, and conclusions were developed by the authors.
材料
| 姓名 | 公司 | 目录编号 | 评论 |
|---|---|---|---|
| Anti-BDNF primary antibody (anti-rabbit) | Servicebio | GB15559 | Primary antibody used for BDNF immunofluorescence |
| A-scan ultrasonography system | SiChuang (Wuhan, China) | STRONG 6000AB | Used for axial length measurement |
| BCA protein assay kit | Beyotime | P0012 | Used for protein concentration determination |
| Bovine serum albumin (BSA) | Servicebio | G5001 | Used for Western blot membrane blocking |
| cDNA synthesis kit | Takara | RR047A | Used for reverse transcription |
| COL1A1 antibody (anti-rabbit) | Affinity | AF7001 | RRID: AB_2835309; primary antibody for Western blotting |
| Cyclopentolate hydrochloride | Shandong Bausch & Lomb Freda Pharmaceutical Co., Ltd. | H20083166 | Used as 1% ophthalmic solution for cycloplegia |
| Cyclotraxin B | MedChemExpress | HY-P1178 | TrkB inhibitor; 20 μL at 0.5 μg/μL |
| DAPI | Beyotime | C1002 | Nuclear counterstain |
| ECL detection kit | Beyotime | P0018S | Used for chemiluminescent Western blot detection |
| Fluorescence microscope | Zeiss | Axioscope 7 | Used for immunofluorescence imaging |
| GAPDH antibody (anti-mouse) | Servicebio | GB15002 | RRID: AB_2904017; Western blot loading control |
| GraphPad Prism | GraphPad Software Inc., San Diego, CA, USA | Version 9.0 | Statistical analysis software |
| Guinea pig | Danyang Changyi Experimental Animal Breeding Co., Ltd. | — | Male tricolor guinea pigs, 3 weeks old, 90–110 g |
| HRP-conjugated secondary antibody (anti-rabbit) | Servicebio | GB23303 | Western blot secondary antibody; 1:1000 |
| HRP-conjugated secondary antibody (anti-mouse) | Servicebio | GB23301 | Western blot secondary antibody; 1:1000 |
| ImageJ | National Institutes of Health, Bethesda, MD, USA | Version 1.54u8 | Used for densitometric and immunofluorescence quantification |
| Immunofluorescence secondary antibody (anti-rabbit) | Servicebio | GB21303 | Used at 1:100 |
| Interleukin-1β ELISA kit | Proteintech | KE10003 | Used for scleral IL-1β measurement |
| Interleukin-6 ELISA kit | Proteintech | KE10007 | Used for scleral IL-6 measurement |
| NF-κB antibody (anti-rabbit) | Servicebio | GB11997 | Primary antibody for Western blotting |
| Paraformaldehyde (4% PFA) | Servicebio | G1101 | Used for fixation of scleral cryosections |
| Phosphate-buffered saline (PBS) | Servicebio | G4200 | Used for tissue homogenization and washing |
| Phosphatase inhibitor | Beyotime | P1081 | Added to RIPA buffer at 1:50 |
| Protease inhibitor cocktail | Beyotime | P1006 | Added to RIPA buffer at 1:50 |
| PVDF membrane | Millipore | IPVH00010 | Used for Western blot protein transfer |
| RIPA lysis buffer | Beyotime | PC101 | Used for scleral protein extraction |
| SDS-PAGE gel (10%) | Servicebio | G2047 | Used for Western blot protein separation |
| Sterile disposable acupuncture needles | Huatuo | — | 0.18 × 13 mm |
| SYBR Green qPCR mix | Takara | RR420A | Used for qRT-PCR |
| Real-time PCR system | Becton, Dickinson and Company | 441916 | BD MAX System; used for quantitative reverse transcription PCR |
| Tribromoethanol | Solarbio | IR9183 | Used as 1.25% anesthetic solution |
| Triton X-100 | Sangon | A600198 | Used at 0.3% for permeabilization |
| TRIzol reagent | Takara | 9109 | Used for total RNA extraction |
| TrkB antibody (anti-rabbit) | Servicebio | GB11295 | Primary antibody for Western blotting |
| α-SMA antibody (anti-rabbit) | Affinity | AF1032 | RRID: AB_2835329; primary antibody for Western blotting |
| HRP anti-β-actin [mAbcam 8226] (anti-mouse) | Abcam | ab20272 | RRID: AB_306371; Western blot loading control |
参考文献
- Che D, et al. Changes in choroidal hemodynamics of form-deprivation myopia in Guinea pigs. Biochem Biophys Res Commun. 2024;692:149348. doi:10.1016/j.bbrc.2023.149348.
- Wang W-X, et al. Differences in Retinal Thickness and Vessel Density of the Macula and Optic Disc Across Myopic Children and Adolescents. Clin Ophthalmol. 2026;20:583727. doi:10.2147/OPTH.S583727.
- Zhang J-C, Yao W, Hashimoto K. Brain-derived neurotrophic factor (BDNF)-TrkB signaling in inflammation-related depression and potential therapeutic targets. Curr Neuropharmacol. 2016;14(7):721–731.
- Kenis G, et al. Depressive symptoms following interferon-α therapy: Mediated by immune-induced reductions in brain-derived neurotrophic factor? Int J Neuropsychopharmacol. 2011;14(2):247–253.
- Mattson MP, Meffert MK. Roles for NF-κB in nerve cell survival, plasticity, and disease. Cell Death Differ. 2006;13(5):852–860.
- Zhao M et al. Electroacupuncture Modulates Multiple Pathways for Neuroprotection and Neurorepair in Ischemic Stroke. CNS Neurosci Ther. 2026;32(4):e70862. doi:10.1002/cns.70862.
- Ping Z, et al. Mechanism of electroacupuncture involve in lens-induced myopia guinea pigs by inhibiting wnt/β-catenin signaling pathway. J Tradit Chin Med. 2025;45(4):796–805. doi:10.19852/j.cnki.jtcm.2025.04.010.
- Zhang L, et al. Acupuncture's Multisystem Neuroimmunomodulation: Central-Peripheral Interactions in Gastroenteric, Psychiatric, and Chronic Pain Disorders. CNS Neurosci Ther. 2025;31(11):e70625. doi:10.1111/cns.70625.
- Yu C, et al. Electroacupuncture alleviates cognitive impairments in APP/PS1 mice via gastric vagal afferent-mediated activation of the nucleus tractus solitarius–locus coeruleus noradrenergic circuit. Chin Med. 2025;20(1):188. doi:10.1186/s13020-025-01230-x.
- Wang X, et al. Acupuncture reduces neuroinflammation and apoptosis, regulates peripheral immunity, and modulates T-cell subset distribution in vascular dementia rats. Chin Med. 2025;20(1):203. doi:10.1186/s13020-025-01243-6.
- Si Y, et al. Investigating acupuncture therapy in depression: mechanisms of synaptic plasticity regulation. Neuroscience. 2025;579:284–301.
- National Research Council. Guide for the Care and Use of Laboratory Animals. 8th ed. The National Academies Press; Washington, DC; 2011.
- Zhou X, et al. Normal development of refractive state and ocular dimensions in guinea pigs. Vision Res. 2006;46(18):2815–2823.
- Howlett MHC, McFadden SA. Emmetropization and schematic eye models in developing pigmented guinea pigs. Vision Res. 2007;47(9):1178–1190.
- Liu S, et al. A neuroanatomical basis for electroacupuncture to drive the vagal–adrenal axis. Nature. 2021;598(7882):641–645.
- Xie R-Y, et al. Role of BDNF in form-deprivation myopia progression in guinea pigs. Front Immunol. 2026;17:1733238. doi:10.3389/fimmu.2026.1733238.
- Wang X, et al. High irisin and low BDNF levels in aqueous humor of high myopia. Adv Clin Exp Med. 2021;30(9):893–904.
- Zhang K, et al. Targeting BDNF with acupuncture: A novel integrated strategy for diabetes and depression comorbidity. Heliyon. 2023;9(12):e22798. doi:10.1016/j.heliyon.2023.e22798.
- Song Y, et al. Proteomic and phosphoproteomic characteristics of the retina, choroid, and sclera in guinea pigs with form-deprivation myopia. Mol Cell Proteomics. 2025;24(11):101069. doi:10.1016/j.mcpro.2025.101069.
- Eppenberger LS, Grzybowski A, Schmetterer L, Ang M. Myopia control: Are current treatments evidence based? Ophthalmol Ther. 2024;13(6):1453–1477.
- Huang L, Zhang J, Luo Y. The role of atropine in myopia control: Insights into choroidal and scleral mechanisms. Front Pharmacol. 2025;16:1509196. doi:10.3389/fphar.2025.1509196.
- Sun H, Bu F, Xin X, Yan J. Incidence of adverse events induced by atropine in myopic children: A meta-analysis. J Clin Pharmacol. 2023;63(12):1377–1386.
- Kikuchi Y, Toshida H, Ono J. A case of bacterial keratitis in a patient using orthokeratology and soft contact lenses. Cureus. 2024;16(9):e68717. doi:10.7759/cureus.68717.
- Kong X, et al. Addition of auricular acupoint stimulation to 0.01% atropine for myopia: 12-month results from a randomized trial. J Integr Complement Med. 2023;29(9):574–583.
- Cabıoğlu MT, Cetin BE. Acupuncture and immunomodulation. Am J Chin Med. 2008;36(1):25–36.
- Wu H, et al. Scleral hypoxia is a target for myopia control. Proc Natl Acad Sci U S A. 2018;115(30):E7091–E7100.
- Zhang J, et al. Inflammation and immune pathways in myopia: An overview of pathomechanisms and treatment prospects. Clin Rev Allergy Immunol. 2025;68(1):98. doi:10.1007/s12016-025-09094-7.