We systematically analyze the quality and reliability of short videos across different platforms, as well as the relationship between video characteristics and quality. Engagement was not significantly associated with quality. High-quality videos did not receive the expected level of attention, while some low-quality videos achieved higher engagement metrics.
研究文章
Content and Quality Analysis of Chikungunya Fever-Related Online Information on Social Media: A Cross-Sectional Study
* These authors contributed equally
本文内容
摘要
摘要
An outbreak of chikungunya fever (CHIKF) occurred in China in 2025. The rapid increase in new cases has drawn the attention of health authorities. The outbreak also sparked widespread discussion on social media platforms. Fear-inducing and uncertain information about CHIKF circulated rapidly online, which may complicate risk communication and outbreak management efforts. In this study, we assessed the content characteristics, video quality, information reliability, transparency, and engagement of CHIKF-related short videos across the two platforms. We searched TikTok China and Bilibili using the term “chikungunya fever” and included the top 100 videos from each platform on October 9, 2025 (N = 200). Video quality was assessed using the Global Quality Scale (GQS) and the Video Information and Quality Index (VIQI); information reliability was evaluated using the modified DISCERN (mDISCERN); transparency was measured using the Journal of the American Medical Association (JAMA) benchmark criteria; and engagement was quantified using platform-based interaction metrics. Statistical analyses were performed to compare video characteristics across platforms and uploader categories, and to evaluate associations between these characteristics and quality scores. Videos from TikTok China showed higher JAMA benchmark scores, whereas videos from Bilibili achieved comparatively higher mDISCERN scores. Subgroup analyses indicated no statistical differences in engagement metrics across uploader categories, whereas quality scores differed significantly. In addition, engagement metrics showed weak correlations with video quality or reliability. The quality and reliability scores for CHIKF-related short videos on the two platforms were relatively low. The results support careful consideration of whether video quality and information reliability should be more explicitly incorporated into platform governance and content distribution strategies.
引言
In recent years, Chikungunya fever (CHIKF), a mosquito-borne viral disease transmitted primarily by Aedes species, has re-emerged as a growing public health concern across Africa, South and Southeast Asia, and the Americas, with frequent travel-related importations occasionally leading to localized transmission in previously unaffected regions1. In July 2025, an outbreak of CHIKF was reported in Guangdong Province, China. Within approximately two weeks after the first confirmed imported case, the cumulative number of reported cases exceeded 4,000, indicating rapid local transmission and raising substantial public health concerns at the national level. The outbreak also generated substantial public attention and discussions on social media platforms. Clinically, CHIKF is characterized by an acute onset of high fever, severe polyarthralgia, and rash. Although mortality is generally low, a substantial proportion of patients experience persistent or recurrent joint pain beyond the acute phase, which may lead to prolonged functional impairment and reduced quality of life2. Older adults and individuals with underlying comorbidities are at increased risk of more severe or prolonged disease courses, thereby imposing additional burdens on healthcare systems and generating broader socioeconomic impacts3,4.
In a digital health environment, outbreak dynamics are closely coupled with public risk perception and the quality of health communication. Patients’ online acquisition of disease-related knowledge about etiology, pathophysiology, and treatment may influence clinical decision-making and treatment outcomes5. With the rapid expansion of short-video platforms, video-based health communication has become an increasingly important component of digital health information seeking. It is reported that 80% of internet users obtain medical information online, and viewing of news- and health-related videos reportedly increased by approximately 75% compared with the pre-pandemic period6,7. With the widespread use of social media platforms, entertainment-oriented content may attract susceptible public attention8. This trend may influence how individuals perceive and evaluate health information from different sources. During the pandemic, short-video platforms have become dominant channels for acquiring public health information, serving as high-velocity intermediaries that rapidly disseminate both verified information and uncertain or incomplete content9,10,11. The fear-driven public psychological burden can be worse when medical systems are under strain, such as during supply-demand imbalances at healthcare peaks and inadequate resource allocation12. Previous studies have indicated that short-form video content may influence public perceptions and behaviors during health emergencies, thereby amplifying social and economic losses and complicating prevention and control efforts13. Ensuring the clarity, accuracy, and comprehension of CHIKF-related information on social media platforms is critical to mitigating misinformation and supporting effective outbreak response14,15,16,17. Consequently, the National Institutes of Health, the U.S. Department of Health and Human Services, and the American Medical Association recommend that patient education materials be written at approximately a sixth-grade reading level to improve comprehension among audiences with diverse educational backgrounds18.
During emerging infectious disease outbreaks, uncertainty regarding diagnosis and treatment protocols may drive both healthcare professionals and the public to seek clinical information from social media platforms, such as online video-sharing platforms19. The quality of online health information can significantly influence users’ health perceptions and decision-making processes, potentially leading to adverse and irreversible consequences20. Therefore, a growing body of literature has examined the video quality and reliability of health-related short videos across major social media platforms. These studies have consistently reported that the overall quality of health content on short-video platforms is generally suboptimal, with a substantial proportion of videos containing incomplete, superficial, or potentially misleading information. Bibliometric and altmetric analyses have further highlighted the growing influence of digital dissemination on scientific visibility and public engagement21,22. Methodologically, most existing research has relied on a relatively small set of standardized assessment instruments, particularly the Global Quality Scale (GQS) and the modified DISCERN (mDISCERN) tool, which have been widely applied to evaluate video quality and information reliability of short videos23. However, most studies have focused on individual platforms or single dimensions of information quality, limiting comprehensive comparisons across different digital environments. There remains limited cross-platform comparability and insufficient attention to the relationship between engagement metrics and the reliability and quality of information. As a result, there remains a need for more systematic and comparative evaluations of health-related short videos across platforms with distinct algorithmic and user ecology characteristics.
Despite growing attention to CHIKF-related online health information, evidence on the characteristics, quality, and determinants of short-form video content during real-world outbreaks remains limited. A recent cross-sectional study evaluated the quality and reliability of CHIKF-related videos on the video-sharing platforms. However, further investigation is needed to capture the evolving characteristics of online health communication as the outbreak progresses and to explore factors associated with information quality using more comprehensive analytical approaches. TikTok China (the short-form video-sharing platform in China) and Bilibili (the video-sharing platform) were selected because they represent two influential yet distinct video-based information ecosystems in China. The short-form video-sharing platform in China is characterized by rapid, high-reach dissemination of short-form content, whereas the video-sharing platform generally supports longer, more knowledge-oriented videos. Therefore, comparing these platforms enabled assessment of health information performance across two contrasting communication environments. Herein, we provided a larger final sample and multivariable regression models to assess predictors of video quality and reliability while controlling for platform type and uploader category. By integrating multidimensional quality assessment with advanced statistical analysis, this study aims to provide a more comprehensive understanding of the dissemination of CHIKF-related short videos and their implications for digital health communication during emerging infectious disease outbreaks. Our study aimed to evaluate and compare the quality, reliability, transparency, content characteristics, and engagement metrics of CHIKF-related short videos on the short-form video-sharing platform in China and the video-sharing platform during the 2025 outbreak context. The findings had significant implications for mitigating public impacts from the Chikungunya virus and other public health emergencies.
方案
In our study, all video data were obtained from publicly available content on video- and short-form video-sharing platforms in China and were anonymized prior to analysis. No personally identifiable information was collected or disclosed, and no interaction with platform users occurred. Therefore, formal ethics review and informed consent were not required.
Search strategy and data collection
The keyword “Chikungunya fever” was used to retrieve videos on the video-sharing and short-form video-sharing platforms using the default overall ranking. The study began on October 9, 2025. Newly registered accounts were created on each platform to mitigate ranking bias arising from personalized recommender algorithms. All personal information fields, including gender, age, and region, were skipped during registration, and the language was set to Chinese. The search pages were neither closed nor refreshed during retrieval to minimize the influence of real-time recommendation mechanisms on the search results. Videos uploaded within the week preceding the search date were excluded to reduce fluctuations caused by newly uploaded content. Duplicate videos were identified based on identical URLs or highly similar audiovisual content, including video, audio, and subtitles, and only the earliest uploaded version was retained. Advertisements containing explicit commercial promotion, including product marketing, purchase links, or promotional language, were excluded. Videos that contained the search keyword but were unrelated to chikungunya fever or public health content were also excluded. Non-Chinese videos were excluded based on a manual assessment of the spoken language and on-screen text. All screening procedures were conducted independently by two reviewers, and discrepancies were resolved through discussion and consensus. The top 100 videos in the comprehensive ranking that met the inclusion and exclusion criteria24 were included. The detailed process was shown in Figure 1. Basic video information, including the URL, source, content, duration in seconds, and numbers of likes, collections, comments, and shares, was recorded. Uploader characteristics, including verification status, were also recorded. Fixed study identification codes were assigned to the videos on October 9, 2025, to prevent subsequent platform updates from influencing the rating process. Two public health experts and one arbitrator conducted a three-day evaluation session from October 11–13, 2025. Standardized training was conducted before scoring, and unified operational instructions for the GQS, mDISCERN, JAMA, and VIQI assessment tools were provided. Each video was assessed independently under blinded conditions. Discrepancies between the two raters were adjudicated by a third senior reviewer, and the final scores were determined by consensus.
Video quality, information reliability, transparency, and engagement
Video quality, reliability, and transparency were evaluated using four validated instruments: the Global Quality Scale (GQS), modified DISCERN (mDISCERN), Journal of the American Medical Association (JAMA) benchmark criteria, and Video Information and Quality Index (VIQI). In this study, video quality was defined as the educational completeness, clarity, flow, and overall presentation of the videos and was assessed using the GQS and VIQI. Information reliability referred to the trustworthiness and balance of the information presented and was assessed using mDISCERN. Transparency was defined as the disclosure of authorship, attribution, competing interests, and content currency, and was evaluated using the JAMA benchmark criteria. Engagement referred to platform-based interaction counts, including likes, comments, collections, and shares. The GQS was used to assess the completeness and clarity of the education. It rated videos on five levels, ranging from 1 for poor quality to 3 for suboptimal flow with important topics missing, and 5 for excellent quality and flow25. The mDISCERN instrument was used to evaluate information reliability, and the total scores were grouped into five levels, with higher scores indicating greater reliability26. An mDISCERN score below 3 was interpreted as indicating relatively low information reliability27. The JAMA benchmark criteria were used to assess transparency across four dichotomous domains: authorship, citations, disclosure of interests, and timeliness. The JAMA score ranged from 0 to 4, with higher scores indicating greater transparency in authorship, attribution, disclosure, and currency28. The VIQI was used to evaluate overall video quality across four dimensions: information flow, accuracy, quality, and precision29. The VIQI score ranged from 5 to 20, with higher total scores indicating better overall video quality. Details of the scoring instruments and rating criteria were provided in (Supplementary File 1). Before evaluation, the compiled video records were randomly coded, and the same coded sequence was provided to all reviewers. Two public health experts independently evaluated each video after reviewing the scoring guidance and reaching agreement on the operational definitions. Disagreements were resolved by a third reviewer, and the final ratings were determined by consensus. Inter-rater agreement was measured using Cohen’s kappa.
Statistical analysis
The distributions of all variables were assessed using the Shapiro–Wilk test, supplemented by visual inspection of histograms and quantile–quantile plots. The results indicated that all variables deviated significantly from normality (all P < 0.001). Therefore, the variables were summarized using the median and interquartile range. Group differences were examined using the Mann–Whitney U test, whereas comparisons across uploader types were conducted using the Kruskal–Wallis H test. The Holm–Bonferroni correction was applied to group comparisons, and false discovery rate (FDR) adjustment was used for correlation analyses. Spearman’s rank correlation analysis was performed to assess associations between video metrics and rating scores. Categorical variables, including platform and uploader type, were dummy-coded, and continuous predictors were transformed using the natural logarithm before model fitting. Four multivariate linear regression models were constructed using GQS, mDISCERN, JAMA, and VIQI scores as the respective dependent variables.

Yi represents the video quality score (GQS, mDISCERN, JAMA, or VIQI), Xij represents the log-transformed continuous predictors, including video duration and engagement metrics, Zim represents the categorical adjustment covariates, including platform type and uploader identity, βj and ym represents the regression coefficients, β0 represents the intercept term, and εi represents the random error term. The following statistical computing environment packages were used for statistical analyses: dplyr, gtsummary, rstatix, Hmisc, broom, car, and performance.
结果
Video features
A total of 200 videos met the predefined inclusion criteria and were included in the final analysis: 100 from the short-form video-sharing platform in China and 100 from the video sharing platform. Table 1 summarizes the characteristics of the videos. The median values for duration, likes, collections, comments20, and shares across all videos on both platforms were 114.00 (62.75, 187.50) s, 1640.50 (66.50, 10277.50), 312.00 (28.75, 2010.50), 109.50 (7.00, 878.50), and 557.50 (42.50, 10160.75), respectively. As the evaluation of video quality, the median scores were as follows: GQS 3 (3–4), mDISCERN 2 (2–3), JAMA 2 (1–3), and VIQI 10 (Table 1). Additionally, with respect to uploader identity, the short-form video-sharing platform in China was dominated by medical personnel and institutions (53%), followed by independent content creators (‘self-media’), including popular science communicators (30%) and news media outlets (17%). In contrast, the distribution on the video-sharing platform comprised self-media (49%), news media accounts (29%), and medical personnel and institutions (22%) (Figure 2). Notably, the self-media included popular-science communicators. The inter-rater reliability was excellent, with Cohen's kappa coefficients of 0.863 for GQS scores, 0.831 for mDISCERN scores, 0.977 for JAMA scores, and 0.803 for VIQI scores.
Video Content
The video content descriptions were shown in Figure 3A–F. Among CHIKF-related videos, clinical presentation was the most frequently covered topic, with 78% of videos focusing on describing signs and symptoms. As an acute arboviral infection, CHIKF typically presents with abrupt high fever, severe polyarthritis, rash, and systemic malaise. The duration and intensity of arthralgia are the primary contributors to morbidity. Clinical symptoms were a major focus in many videos, helping viewers recognize the illness early and anticipate its potential impact on daily functioning and quality of life. Epidemiology, etiology, and preventive measures are the most common themes, appearing in 57.0%, 71.5%, and 71.5% of videos, respectively. The results suggested that public and media attention centers on transmission routes, causal factors, and prevention. CHIKF is mosquito-borne; prevention mainly involves limiting human–mosquito contact and reducing vector populations.
Comparison of videos on different platforms
Significant differences were observed between platforms in engagement metrics, information reliability, and transparency (Table 2). Regarding video duration, a statistically significant difference was observed between the video-sharing platform and the short-form video-sharing platform in China (P = 0.036). However, this difference became non-significant following Holm–Bonferroni correction (PHB = 0.108). For user engagement metrics, the videos from a short-form video-sharing platform in China demonstrated significantly higher counts of likes, collections, comments, and shares than those from the video-sharing platform. The difference remained statistically significant after multiple corrections for statistical significance (PHB < 0.001). The effect size calculations indicated that the discrepancies in the metrics under consideration between the two platforms were medium to large (r > 0.50). This finding suggested that the short-form video-sharing platform in China significantly outperformed the video-sharing platform in dissemination performance and user engagement.
As for the evaluation of information quality, the differences in GQS and VIQI scores between the two platforms were not statistically significant (GQS: PHB = 0.442; VIQI: PHB = 0.725). Regarding the mDISCERN scores, although the median values were identical across the various platforms, the discrepancy remained statistically significant (PHB = 0.019). However, the effect size was negligible (r = 0.200), suggesting that the observed practical differences were minimal. Videos from the short-form video-sharing platform in China had a significantly higher JAMA median score than those from the video-sharing platform. After Holm–Bonferroni correction for multiple comparisons, the difference remained statistically significant, exhibiting a moderate effect size (r = 0.407).
Overall, the short-form video-sharing platform in China exhibited substantially higher engagement than the video-sharing platform (Figure 4A–D). Regarding information quality, statistically significant differences were observed only in the mDISCERN and JAMA scores, whereas no significant differences were found in the GQS and VIQI scores. This finding suggests that there are more pronounced differences in communication effectiveness between platforms, with relatively limited overall variations in information quality.
Comparison of videos by different uploader types
Significant differences among uploader categories were observed for video duration, GQS, JAMA, and VIQI scores (PHB < 0.001) (Table 3). In contrast, likes, collections, comments, shares, and mDISCERN scores did not differ significantly among uploader groups (PHB > 0.05). Post hoc pairwise comparisons showed that videos posted by news media were significantly shorter than those posted by medical personnel and institutions, and by self-media (PHB < 0.001), whereas no significant difference in duration was found between the latter two groups (PHB = 1.000). For quality-related measures, videos uploaded by medical personnel and institutions received significantly higher GQS and JAMA scores than those uploaded by news media and self-media (PHB < 0.001). No significant difference was found between news media and self-media for either score (PHB = 1.000). For VIQI scores, videos from medical personnel and institutions scored significantly higher than those from news media (PHB = 0.008) and self-media (PHB < 0.001), while the difference between news media and self-media was not significant (PHB = 0.097). Effect size analysis showed that the largest between-group difference was observed for JAMA scores (ε2 = 0.447), followed by GQS (ε2 = 0.242) and VIQI (ε2 = 0.171). Figure 5A–D presents a direct comparison of video quality scores across uploader categories.
Spearman correlation between video characteristics and quality metrics
Spearman correlation analysis revealed strong positive correlations among likes, collections, comments, and shares (ρ = 0.911–0.961, P < 0.001 after FDR correction). Video duration was positively correlated with GQS, mDISCERN, JAMA, and VIQI scores, with the strongest association observed with GQS (ρ = 0.437, P < 0.001 after FDR correction). However, video duration was not significantly correlated with likes, collections, or comments. Significant positive correlations were also found among video quality, information reliability, and transparency measures, especially between GQS and VIQI (ρ = 0.744, P < 0.001 after FDR correction). By contrast, engagement metrics showed weak correlations with information reliability and video quality. Likes and collections were weakly positively correlated with JAMA scores, whereas shares were weakly negatively correlated with mDISCERN scores. No significant correlations were observed between other engagement metrics and video quality or information reliability (P > 0.05 after FDR correction) (Figure 6). Overall, user engagement was not consistently associated with information reliability or video quality, suggesting that higher-quality videos did not necessarily attract greater public engagement. Details of the Spearman analysis were provided in Supplementary File 1.
Multiple linear regression analysis
Categorical variables were dummy-coded prior to regression analysis, with the short-form video-sharing platform in China and news media serving as the reference categories for platform and uploader type, respectively. After adjusting for platform type and uploader category, we employed multiple linear regression to predict video quality and information reliability using metrics such as video engagement. In view of the skewed distributions of video duration and engagement metrics, the relevant continuous variables were subjected to a natural logarithm transformation prior to regression analysis. The transformed variables were subsequently entered into the regression models. We have conducted additional model diagnostics to assess the validity of the regression assumptions. The diagnostic results indicated that the residual distributions were generally consistent with the assumption of normality, and no substantial heteroscedasticity was observed. Meanwhile, no highly influential observations were detected in any of the regression models, indicating that the regression results were not substantially affected by individual extreme observations.
In the GQS scoring model, the overall regression model was statistically significant (R2 = 0.464; adjusted R2 = 0.441; F = 20.655; P < 0.001). The duration and the collections were found to be positive predictors of GQS scores. Conversely, the likes, comments, and shares exhibited no significant association with GQS scores (Table 4). In the mDISCERN scoring model, the overall model was statistically significant (R2 = 0.205, adjusted R2 = 0.172, F = 6.171, P < 0.001). After controlling for platform and uploader identity, video duration emerged as an independent positive predictor of mDISCERN scores, while the number of shares became a negative predictor (Table 5). No other engagement variables were statistically significant. In the JAMA benchmark, the overall model was significant (R2 = 0.543, adjusted R2 = 0.523, F = 28.326, P < 0.001). The number of shares showed a significant negative correlation with the JAMA score (Table 6). No other video duration or engagement variables were statistically significant (P > 0.05). In the VIQI scoring model, the overall model was significant (R2 = 0.390, adjusted R2 = 0.365, F = 15.283, P < 0.001). The duration and the collections were found to be positive predictors of VIQI scores (Table 7). Overall, the main findings of the multivariable linear regression analyses were broadly consistent with those of the Spearman rank correlation analyses.
DATA AVAILABILITY:
The raw data that support the findings of this study are available in Supplementary File 1.
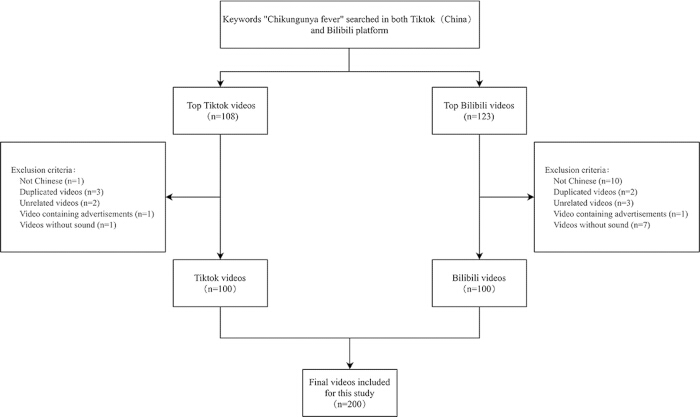
Figure 1: Inclusion and exclusion workflow for videos on CHIKF. Flow diagram of video identification, screening, exclusion, and final inclusion. Please click here to view a larger version of this figure.
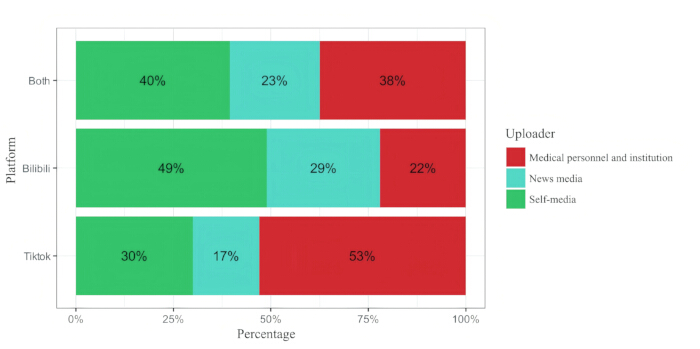
Figure 2: The distribution of short video sources. Stacked horizontal bar chart showing the distribution of uploader types on the short-form video-sharing platform in China and the video-sharing platform. Please click here to view a larger version of this figure.
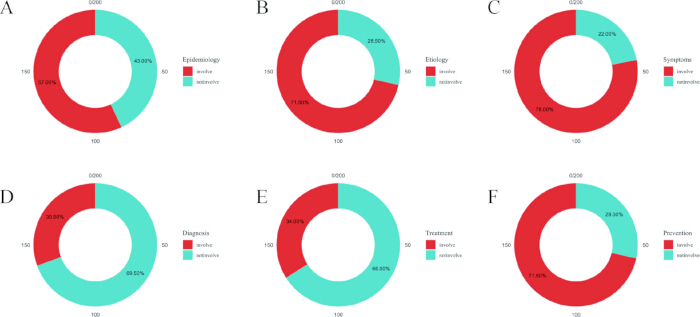
Figure 3: The description of the short video content. (A–F) Six donut charts showing the proportion of the 200 included videos that covered specific chikungunya-related content domains. Red represents videos that included the corresponding topic, whereas blue represents videos that did not. Symptoms were the most frequently covered domain, whereas diagnosis and treatment were addressed less often. Please click here to view a larger version of this figure.
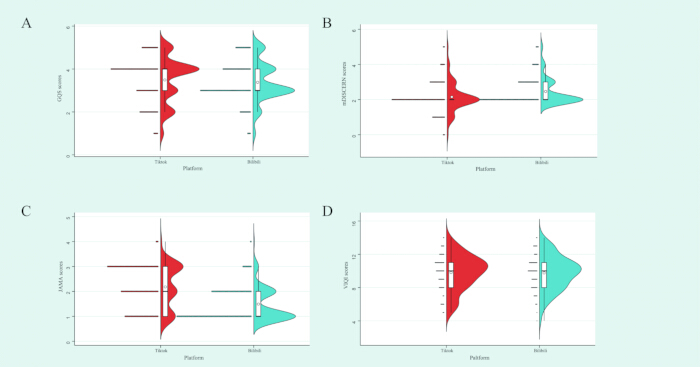
Figure 4: Comparison of video quality scores across platforms. Four plots comparing the distributions of video assessment scores between the short-form video-sharing platform in China and the video-sharing platform. (A) shows GQS scores, (B) shows mDISCERN scores, (C) shows JAMA benchmark scores, and (D) shows VIQI scores. The half-violin shapes represent score density, individual points indicate observed values, and the embedded boxplots summarize the median and interquartile range. Please click here to view a larger version of this figure.
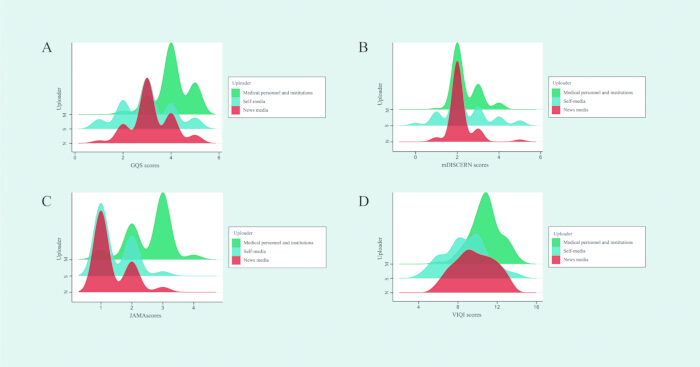
Figure 5: Comparison of video quality scores across uploader categories. Four ridgeline density plots showing the distributions of video assessment scores across uploader types: medical personnel and institutions, self-media, and news media. (A) presents GQS scores, (B) presents mDISCERN scores, (C) presents JAMA benchmark scores, and (D) presents VIQI scores. Please click here to view a larger version of this figure.
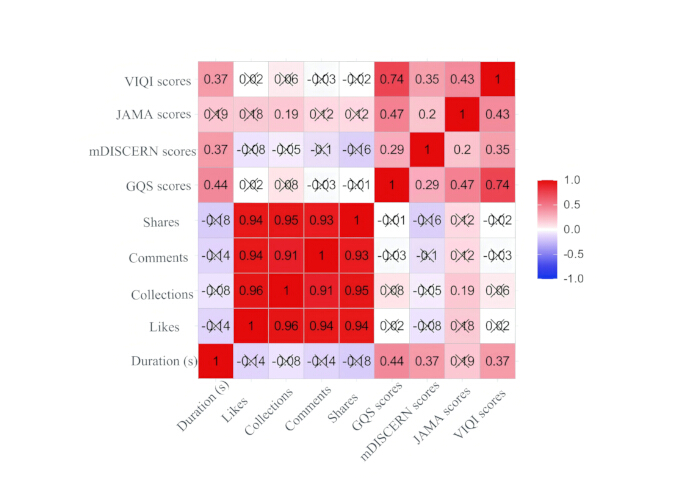
Figure 6: Correlation matrix between basic video characteristics and quality scores. Correlation heatmap illustrating pairwise Spearman’s correlations among video duration, engagement indicators, and video assessment scores. The comparisons include correlations among engagement metrics, between engagement metrics and assessment scores, between video duration and assessment scores, and among the four assessment instruments. Cell colors and numerical values indicate the direction and strength of each correlation. Please click here to view a larger version of this figure.
| Variables | Total (n = 200) |
| Duration (s), M (Q₁, Q₃) | 114.00 (62.75, 187.50) |
| Likes, M (Q₁, Q₃) | 1640.50 (66.50, 10277.50) |
| Collections, M (Q₁, Q₃) | 312.00 (28.75, 2010.50) |
| Comments, M (Q₁, Q₃) | 109.50 (7.00, 878.50) |
| Shares, M (Q₁, Q₃) | 557.50 (42.50, 10160.75) |
| GQS scores, M (Q₁, Q₃) | 3.00 (3.00, 4.00) |
| mDISCERN scores, M (Q₁, Q₃) | 2.00 (2.00, 3.00) |
| JAMA scores, M (Q₁, Q₃) | 2.00 (1.00, 3.00) |
| VIQI scores, M (Q₁, Q₃) | 10.00 (8.00, 11.00) |
Table 1: Characteristics of videos on the two platforms. The table summarizes the descriptive characteristics of the 200 videos included from the two platforms, including video duration, engagement metrics, and quality assessment scores, presented as medians and interquartile ranges.
| Variables | Bilibili (n = 100) | Tiktok (n = 100) | P | r | Median Difference (95% CI) | PHB |
| Duration (s), M (Q₁, Q₃) | 133.00 (62.75, 274.00) | 103.50 (62.25, 156.75) | 0.036 | 0.148 | -29.5 (-63.012, 14.5) | 0.108 |
| Likes, M (Q₁, Q₃) | 73.50 (11.75, 1714.75) | 6146.50 (1305.75, 27738.50) | <0.001 | 0.576 | 6073 (2803.825, 11971.925) | <0.001 |
| Collections, M (Q₁, Q₃) | 48.50 (8.00, 359.00) | 1117.00 (272.75, 4934.00) | <0.001 | 0.569 | 1068.5 (692, 2085.55) | <0.001 |
| Comments, M (Q₁, Q₃) | 12.50 (1.00, 191.75) | 574.00 (66.50, 1677.75) | <0.001 | 0.501 | 561.5 (258.5, 841.012) | <0.001 |
| Shares, M (Q₁, Q₃) | 50.50 (7.75, 593.25) | 5786.00 (485.50, 53615.00) | <0.001 | 0.6 | 5735.5 (2198.487, 19433.588) | <0.001 |
| GQS scores, M (Q₁, Q₃) | 3.00 (3.00, 4.00) | 4.00 (3.00, 4.00) | 0.221 | 0.087 | 1 (0, 1) | 0.442 |
| mDISCERN scores, M (Q₁, Q₃) | 2.00 (2.00, 3.00) | 2.00 (2.00, 2.00) | 0.005 | 0.2 | 0 (0, 0) | 0.019 |
| JAMA scores, M (Q₁, Q₃) | 1.00 (1.00, 2.00) | 2.00 (1.00, 3.00) | <0.001 | 0.407 | 1 (0.5, 2) | <0.001 |
| VIQI scores, M (Q₁, Q₃) | 10.00 (8.00, 11.00) | 10.00 (8.00, 11.00) | 0.724 | 0.025 | 0 (0, 1) | 0.724 |
Table 2: Detailed comparison of videos on the two platforms. The table compares video duration, engagement metrics, and quality assessment scores between the video-sharing platform and the short-form video-sharing platform in China, including statistical significance, effect sizes, median differences with 95% confidence intervals, and Holm–Bonferroni-adjusted P values.
| Variables | News media (n = 46) | Medical personnel and institution (n = 75) | Self-media (n = 79) | P | PHB | ε² | PN-M | PN-S | PM-S |
| Duration (s), M (Q₁, Q₃) | 65.00 (33.75, 112.25) | 131.00 (75.50, 192.50) | 136.00 (67.00, 238.50) | <0.001 | <0.001 | 0.108 | <0.001 | <0.001 | 1 |
| Likes, M (Q₁, Q₃) | 2122.00 (283.00, 8605.50) | 1418.00 (227.00, 7194.50) | 1032.00 (14.50, 13114.50) | 0.297 | 1 | 0.002 | - | - | - |
| Collections, M (Q₁, Q₃) | 359.50 (41.50, 1480.75) | 323.00 (50.50, 1717.00) | 249.00 (19.00, 2087.00) | 0.624 | 1 | 0 | - | - | - |
| Comments, M (Q₁, Q₃) | 195.50 (11.25, 1202.00) | 112.00 (13.00, 613.00) | 95.00 (3.00, 1068.00) | 0.662 | 1 | 0 | - | - | - |
| Shares, M (Q₁, Q₃) | 1448.00 (51.25, 10720.25) | 667.00 (69.50, 6120.50) | 231.00 (22.50, 19528.50) | 0.678 | 1 | 0 | - | - | - |
| GQS scores, M (Q₁, Q₃) | 3.00 (3.00, 4.00) | 4.00 (4.00, 4.50) | 3.00 (2.00, 4.00) | <0.001 | <0.001 | 0.242 | <0.001 | 1 | <0.001 |
| mDISCERN scores, M (Q₁, Q₃) | 2.00 (2.00, 2.00) | 2.00 (2.00, 3.00) | 2.00 (2.00, 3.00) | 0.18 | 0.902 | 0.007 | - | - | - |
| JAMA scores, M (Q₁, Q₃) | 1.00 (1.00, 2.00) | 3.00 (2.00, 3.00) | 1.00 (1.00, 2.00) | <0.001 | <0.001 | 0.447 | <0.001 | 1 | <0.001 |
| VIQI scores, M (Q₁, Q₃) | 10.00 (8.00, 11.00) | 11.00 (10.00, 11.50) | 9.00 (7.50, 10.00) | <0.001 | <0.001 | 0.171 | 0.008 | 0.097 | <0.001 |
Table 3: Detailed comparison of videos across uploader categories. The table compares video duration, engagement metrics, and quality assessment scores across the three uploader categories, including overall group differences, effect sizes, Holm–Bonferroni-adjusted P values, and post hoc pairwise comparisons.
| Variable | Estimate(B) | Standard error | t | P | 95% CI for B |
| Platform (Bilibili vs Tiktok) | 0.059 | 0.156 | 0.375 | 0.708 | (−0.250, 0.367) |
| Uploader (Medical personnel and institution vs News media) | 0.433 | 0.167 | 2.591 | 0.01 | (0.103, 0.763) |
| Uploader (Self-media vs News media) | -0.653 | 0.159 | −4.117 | <0.001 | ( −0.965, −0.340) |
| Duration (s) | 0.498 | 0.07 | 7.119 | <0.001 | (0.360, 0.636) |
| Likes | -0.076 | 0.081 | −0.943 | 0.347 | (−0.235, 0.083) |
| Comments | -0.094 | 0.065 | −1.443 | 0.151 | (−0.222, 0.034) |
| Collections | 0.234 | 0.092 | 2.546 | 0.012 | (0.053, 0.415) |
| Shares | -0.023 | 0.062 | −0.367 | 0.714 | (−0.145, 0.09) |
Table 4: Multivariate linear regression analysis results for GQS scores. The table presents the results of a multivariable linear regression model examining factors associated with GQS scores, adjusted for platform and uploader category.
| Variable | Estimate( B) | Standard error | t | P | 95% CI for B |
| Platform (Bilibili vs Tiktok) | 0.239 | 0.156 | 1.529 | 0.128 | (−0.069, 0.546) |
| Uploader (Medical personnel and institution vs News media) | 0.022 | 0.167 | 0.13 | 0.897 | (−0.307, 0.351) |
| Uploader (Self-media vs News media) | -0.038 | 0.158 | −0.242 | 0.809 | (−0.350, 0.274) |
| Duration (s) | 0.289 | 0.07 | 4.138 | <0.001 | (0.151, 0.427) |
| Likes | 0.049 | 0.08 | 0.606 | 0.545 | (−0.110, 0.207) |
| Comments | 0.023 | 0.065 | 0.359 | 0.72 | (−0.104, 0.151) |
| Collections | 0.13 | 0.092 | 1.418 | 0.158 | (−0.051, 0.311) |
| Shares | -0.15 | 0.062 | −2.426 | 0.016 | (−0.272, −0.028) |
Table 5: Multivariate linear regression analysis results for mDISCERN scores. The table presents the results of a multivariable linear regression model examining factors associated with mDISCERN scores, adjusted for platform and uploader category.
| Variable | Estimate (B) | Standard error | t | P | 95% CI for B |
| Platform (Bilibili vs Tiktok) | −0.393 | 0.121 | −3.262 | 0.001 | (−0.631,−0.155) |
| Uploader (Medical personnel and institution vs News media) | 0.996 | 0.129 | 7.729 | <0.001 | ( 0.742,1.250) |
| Uploader (Self-media vs News media) | 0.046 | 0.122 | 0.378 | 0.706 | (−0.195,0.287) |
| Duration (s) | 0.102 | 0.054 | 1.886 | 0.061 | (−0.005,0.208) |
| Likes | 0.118 | 0.062 | 1.902 | 0.059 | (−0.004,0.240) |
| Comments | −0.027 | 0.05 | −0.535 | 0.593 | ( −0.126,0.072) |
| Collections | 0.026 | 0.071 | 0.363 | 0.717 | ( −0.114, 0.165) |
| Shares | −0.096 | 0.048 | −2.003 | 0.047 | (−0.190,−0.001) |
Table 6: Multivariate linear regression analysis results for JAMA scores. The table presents the results of a multivariable linear regression model examining factors associated with JAMA scores, adjusted for platform and uploader category.
| Variable | Estimate (B) | Standard error | t | P | 95% CI for B |
| Platform (Bilibili vs Tiktok) | 0.244 | 0.345 | 0.709 | 0.479 | (−0.436,0.924) |
| Uploader (Medical personnel and institution vs News media) | 0.261 | 0.369 | 0.708 | 0.48 | (−0.466,0.988) |
| Uploader (Self-media vs News media) | −1.698 | 0.349 | −4.859 | <0.001 | (−2.388,−1.009) |
| Duration (s) | 0.884 | 0.154 | 5.73 | <0.001 | ( 0.580,1.189) |
| Likes | −0.009 | 0.177 | −0.054 | 0.957 | (−0.360,0.341) |
| Comments | −0.209 | 0.143 | −1.457 | 0.147 | (−0.491,0.074) |
| Collections | 0.55 | 0.202 | 2.719 | 0.007 | ( 0.151,0.950) |
| Shares | −0.207 | 0.137 | −1.518 | 0.131 | (−0.477,0.062) |
Table 7: Multivariate linear regression analysis results for VIQI scores. The table presents the results of a multivariable linear regression model examining factors associated with VIQI scores, adjusted for platform and uploader category.
Supplementary File 1: Raw data. The five-point GQS and the corresponding criteria. The five-item mDISCERN criteria are used to assess the reliability of video information, with one point awarded for each criterion met, for a total score ranging from 0 to 5. The four JAMA benchmark criteria used to assess the transparency of video information, including authorship, attribution, currency, and disclosure, with one point awarded for each criterion met. The scoring criteria for the four components of the VIQI: information flow, information accuracy, visual quality, and consistency between the video title and content. Each component is scored from 1 to 5 to evaluate the overall informational and presentation quality of the videos. The Spearman correlation analysis examining pairwise associations among video duration, engagement metrics, and quality assessment scores, with correlation coefficients, 95% confidence intervals, unadjusted P value, and false discovery rate-adjusted P value reported.Please click here to download this file.
讨论
The effective dissemination of evidence-based health information is an important component of infectious disease prevention and control. With the widespread adoption of the internet and digital media, online platforms have become major sources of health information for the public30. Previous studies have evaluated the quality, reliability, readability, and transparency of online health information across a wide range of medical conditions31. In this study, we conducted a cross-platform analysis to evaluate video quality, information reliability, transparency, content characteristics, and engagement.
Characteristics and quality of short videos
In this study, videos from the video-sharing platform had higher mDISCERN scores than videos from the short-form video-sharing platform in China, whereas the opposite pattern was observed for JAMA benchmark scores. These findings may be better explained by differences in the domains assessed by the two evaluation tools rather than by the overall superiority of one platform over the other. The mDISCERN instrument primarily evaluates the reliability of information, whereas the JAMA benchmark criteria assess transparency through authorship, attribution, disclosure, and currency. The observed differences may therefore reflect platform-level variation in the reliability of the information presented and in the reporting of source-related information. In addition, the unequal distribution of uploader categories across platforms may also have contributed to these differences.
Similar concerns have been reported in a Turkish study of internet-based patient education materials on low back pain32. These findings indicate that limitations in the readability, reliability, and quality of online health information are not confined to Chinese-language short-video platforms but may occur across different languages and digital formats. Taken together, these findings underscore the need to evaluate digital health information across different languages, platform types, and communication environments. TikTok China and Bilibili were selected in the present study because they represent two influential yet distinct video-based information ecosystems in China. The former primarily distributes brief, rapidly consumed user-generated videos and emphasizes immediate interaction and rapid dissemination, whereas the latter accommodates relatively longer, more structured, and knowledge-oriented educational content. Therefore, comparing these platforms allowed us to assess CHIKF-related health information across two contrasting communication environments. They also differ from other digital health information sources. YouTube supports both short- and long-form videos, serves a global user base, and combines active information seeking with recommendation-based content discovery. Online health websites are predominantly text-based and are generally accessed through deliberate search behavior, allowing users to review and compare information at their own pace. AI-assisted tools differ further because they generate interactive and potentially personalized responses on demand rather than distributing fixed content produced by identifiable uploaders. These differences in content format, production mechanisms, interaction patterns, accessibility, and information-seeking behavior highlight the need for platform-specific evaluation and limit the direct generalization of the present findings to other digital information sources.
In addition, diagnosis- and treatment-related information was presented less frequently than information on symptoms, etiology, and prevention. This finding may partly reflect the absence of widely established pathogen-specific antiviral treatment for CHIKF and the predominantly supportive nature of current clinical management. Clinical management is primarily supportive and symptomatic, focusing on fever control, pain relief, hydration, and identifying patients who require further medical assessment. Consequently, existing communication materials may offer relatively limited information regarding treatment approaches. Future digital health communication may benefit from placing more emphasis on clear dissemination of diagnostic pathways and management options for CHIKF, including explicit explanations of available treatment strategies, to help the public respond appropriately.
Effect of uploader category on video quality
Engagement metrics did not differ significantly among videos uploaded by medical personnel and institutions, news media, and self-media creators. In contrast, videos uploaded by medical personnel and institutions received higher GQS, JAMA, and VIQI scores than videos uploaded by the other two groups. No significant between-group difference was observed for mDISCERN scores. One possible explanation is that professional uploaders are more likely to receive formal training in evidence retrieval and appraisal, and they may also be guided by professional norms. In addition, some institutions and platforms impose stricter credential verification and medical content compliance requirements for professional accounts. Together, these factors may contribute to a more structured presentation, clearer source reporting, and more complete educational content. In contrast, some self-media creators may have less formal medical training and may present information in more simplified or entertainment-oriented formats. Such presentation characteristics could be associated with less comprehensive coverage of key health information, although uploader motivations were not directly assessed in this study. Across the four assessment instruments, the overall scores were generally modest, indicating substantial room for improvement in video quality, information reliability, and transparency. These findings suggest that CHIKF-related content from different uploader groups did not consistently provide complete, reliable, and transparent health information during the outbreak period. Platforms could consider displaying professional verification and source information more prominently and exploring whether independently validated quality indicators can complement engagement metrics in content-governance systems.
Correlation between popularity and quality of short videos
Taken together, the Spearman correlation and multiple linear regression analyses indicated that longer video duration was generally associated with higher assessment scores. One possible explanation is that longer videos provide more time to present disease-related information and explanatory content in greater detail. This greater capacity for detailed presentation may partly explain the higher educational quality and information reliability scores observed for longer videos. Previous research has demonstrated that the numbers of likes, comments, favorites, and shares partially reflect video popularity33. However, engagement metrics showed only weak associations with video quality and information reliability, indicating that videos with higher quality, reliability, or transparency did not necessarily attract greater user attention or engagement. One possible explanation is that videos containing more detailed or technical information may be less immediately accessible to non-expert audiences. Reduced accessibility may limit interaction even when the information is more complete or reliable. By contrast, simple and entertaining videos may be more likely to attract attention and stimulate interaction on short video platforms34. One possible explanation, suggested by previous research, is that platform-specific distribution processes and user-preference signals may influence content visibility35. However, our study did not directly measure recommendation mechanisms, exposure allocation, or algorithmic ranking signals; this interpretation should be considered explanatory rather than evidence of a causal mechanism. Future platform-governance research could examine whether source verification and independently validated quality indicators can complement engagement metrics in content-ranking systems. The effectiveness of such approaches requires prospective evaluation.
In the digital intelligence era, engagement counts or viewing time alone are inadequate proxies for scientific rigor or usability36. The present findings indicate that videos uploaded by medical personnel and institutions were more consistently associated with higher educational-quality and transparency scores. Content creators should be encouraged to provide structured coverage of key topics, including epidemiology, etiology, clinical manifestations, diagnosis, management, and prevention. From a governance perspective, the platform ranking and recommendation system should clearly include the uploader's source and effective qualification marks through weighting, and construct a distribution model that prioritizes quality while accounting for engagement calibration. At the same time, the engagement indicators should be separated from the content quality analysis. A dual-track monitoring framework needs to be constructed to track both quality and interaction. Such measures may expand the reach of credible health information during disease outbreaks and improve the overall quality and balance of information disseminated through digital media. Notably, AI-assisted health information tools may improve access to general disease information and support preliminary patient education. However, their outputs may be incomplete, inaccurate, insufficiently individualized, or inconsistent with current clinical guidance. Such tools should not replace assessment by qualified health professionals or serve as the sole basis for diagnosis, treatment selection, risk–benefit evaluation, or recognition of warning signs.
In this study, we used multiple validated instruments (GQS, VIQI, mDISCERN, and the JAMA benchmark) to assess video quality, reliability, and transparency. Compared with approaches relying solely on engagement metrics or a single evaluation tool, the cross-platform design, standardized procedures, predefined criteria, and inter-rater reliability testing enhanced methodological rigor and improved the robustness and reproducibility of the findings.
Despite the strengths, this study has several limitations. First, the samples were restricted to short videos drawn from two major platforms and focused exclusively on CHIKF-related content. Second, despite the use of validated instruments and a dual-review-with-adjudication workflow, quality appraisal inevitably involved subjective judgment. Moreover, they assess partially overlapping but incomplete domains and do not constitute a clinical gold standard for verifying the accuracy of CHIKF-related information. Third, to maximize reproducibility, we standardized the search environment, account settings, screening criteria, scorer calibration, and adjudication procedures throughout the study. Nevertheless, search timing remains the most influential factor affecting reproducibility, and older videos had more opportunities to accumulate likes, comments, collections, and shares. However, these mechanisms were not directly evaluated in the present study. Instead, this study assessed the observable relationship between engagement metrics and the quality of ranked videos. Moreover, engagement was measured using absolute interaction metrics, whereas exposure indicators such as views or impressions were unavailable, potentially affecting comparisons across videos. Although the variables were prespecified and represented conceptually distinct interaction behaviors, multicollinearity may have increased the standard errors and reduced the stability of the individual regression coefficients. The associations of individual engagement metrics should therefore be interpreted cautiously. Finally, no formal sensitivity analyses with alternative models were conducted, and the robustness of the findings requires further verification.
In the future, broader, rolling longitudinal studies across multiple platforms and regions are needed. Future studies should incorporate platform-level exposure data, such as views, impressions, reach, and completion rates, together with expert-validated measures of medical accuracy. These data would permit the calculation of exposure-adjusted engagement indicators and improve the interpretation of associations between popularity and information quality. Linking online engagement with offline outcomes, such as health knowledge, risk perception, care-seeking behavior, and adherence to preventive measures, may also clarify the practical consequences of digital health communication. Future research should note that AI-based tools may facilitate access to health information but should not serve as primary sources for clinical decision-making, particularly in risk evaluation and recognition of warning signs18. Future researchers applying this workflow should conduct searches within a prespecified time window and record the platform, account status, language and region settings, search term, ranking mode, retrieval date and time, and whether the search page was refreshed. Repeated searches within the same predefined window may be used to assess short-term ranking instability, with each ranked list archived separately. Collectively, these advances may enhance the quality of short videos on platforms and the dissemination of high-quality videos, thereby weakening the tight coupling between misleading digital information flows and public panic. Ultimately, this could help reduce digital emotional contagion driven by misleading information, mitigate the resulting medical surge wave, and alleviate pressure on healthcare systems.
披露
The authors have nothing to disclose.
致谢
This work was supported by the National Natural Science Foundation of China (Grant No. 72361137562).
材料
| 姓名 | 公司 | 目录编号 | 评论 |
|---|---|---|---|
| Bilibili | Bilibili Inc. | https://www.bilibili.com | video sharing platform |
| broom | CRAN | https://cran.r-project.org/package=broom | Statistical software package |
| car | CRAN | https://cran.r-project.org/package=car | Statistical software package |
| dplyr | CRAN | https://cran.r-project.org/package=dplyr | Statistical software package |
| GraphPad Prism | GraphPad Software | https://www.graphpad.com | Statistical and graphing software |
| gtsummary | CRAN | https://cran.r-project.org/package=gtsummary | Statistical software package |
| Hmisc | CRAN | https://cran.r-project.org/package=Hmisc | Statistical software package |
| performance | CRAN | https://cran.r-project.org/package=performance | Statistical software package |
| R software | R Foundation for Statistical Computing | https://www.r-project.org | Statistical computing environment |
| rstatix | CRAN | https://cran.r-project.org/package=rstatix | Statistical software package |
| TikTok China | ByteDance | https://www.douyin.com | short-video sharing platform |
参考文献
- Khongwichit S, Chansaenroj J, Chirathaworn C, Poovorawan Y. Chikungunya virus infection: Molecular biology, clinical characteristics, and epidemiology in Asian countries. J Biomed Sci. 2021;28(1):84. doi:10.1186/s12929-021-00778-8.
- Wimalasiri-Yapa BMCR et al. Chikungunya virus in Asia-Pacific: A systematic review. Emerg Microbes Infect. 2019;8(1):70–79.
- Acosta-Ampudia Y et al. Mayaro: An emerging viral threat? Emerg Microbes Infect. 2018;7(1):163. doi:10.1038/s41426-018-0163-5.
- Silva LA, Dermody TS. Chikungunya virus: Epidemiology, replication, disease mechanisms, and prospective intervention strategies. J Clin Invest. 2017;127(3):737–49.
- Özbek İC, Hancı V, Özduran E. Digital guidance: Quality and readability analysis of artificial intelligence-generated spondyloarthropathy texts. Turk J Osteoporos. 2025;31(1):12–18.
- Özduran E. YouTube as an information source for myofascial pain syndrome. In: Ünlü Z, editor. Current Approaches to Myofascial Pain Syndrome. Ankara: Türkiye Klinikleri; 2026. p. 377–82. https://books.turkiyeklinikleri.com/chapter/youtube-as-an-information-source-for-myofascial-pain-syndrome/.
- Özduran E, Hancı V. Exploring the reliability and accessibility of YouTube for cerebral palsy rehabilitation information. Çocuk Derg. 2024;24(1):15–24.
- Dai X, Wang J. Effect of online video infotainment on audience attention. Hum Soc Sci Commun. 2023;10:421. doi:10.1057/s41599-023-01921-6.
- Nyamwaya DK et al. Incidence of chikungunya virus infections among Kenyan children with neurological disease, 2014–2018: A cohort study. PLoS Med. 2022;19(5):e1003994. doi:10.1371/journal.pmed.1003994.
- Manzoor KN et al. The global emergence of chikungunya infection: An integrated view. Rev Med Virol. 2022;32(3):e2287. doi:10.1002/rmv.2287.
- Ozduran E, Büyükçoban S. A content analysis of the reliability and quality of YouTube videos as a source of information on health-related post-COVID pain. PeerJ. 2022;10:e14089. doi:10.7717/peerj.14089.
- Pfefferbaum B, North CS. Mental health and the Covid-19 pandemic. N Engl J Med. 2020;383(6):510-512. doi:10.1056/NEJMp2008017.
- Van Bavel JJ et al. Social media and morality. Annu Rev Psychol. 2024;75:311–40.
- Özbek İC, Özduran E. Digital rehabilitation in Parkinson’s disease: The role of artificial intelligence-assisted exercise training. Turk J Osteoporos. Published online September 12, 2025. doi:10.4274/tod.galenos.2025.66664.
- Chen H et al. Chikungunya virus drives gut microbiota shifts and IFN-mediated intestinal repair: Insights into microbiota–immune interplay. Gut Microbes. 2025;17(1):2512900. doi:10.1080/19490976.2025.2512900.
- Erkin Y, Ozduran E, Özbek İC, Hancı V. Readability, quality, and reliability of AI-generated information on myofascial pain syndrome: A comparative analysis of ChatGPT, Gemini, and Perplexity. PLoS One. 2026;21(6):e0350402. doi:10.1371/journal.pone.0350402.
- Harriger JA, Thompson JK, Tiggemann M. TikTok, TikTok, the time is now: Future directions in social media and body image. Body Image. 2023;44:222–26.
- Özbek İC, Özduran E, Hancı V. Artificial intelligence in pain: a comprehensive review. Med J West Black Sea. 2026;10(1):168-178. doi:10.29058/mjwbs.1881313.
- Özduran E, Hancı V. YouTube as a source of information about pulmonary rehabilitation during the COVID-19 pandemic. Eurasian J Pulmonol. 2022;24(2):107–14.
- Mengi A, Özduran E. Evaluating the readability, quality, and reliability of responses generated by artificial intelligence programs about acupuncture for pain. J Phys Med Rehabil Sci. 2026;29(2):245–53.
- Özduran E, Hancı V. Evaluation of the 100 most cited articles on Sjögren’s syndrome: A bibliometric analysis. J Basic Clin Health Sci. 2023;7(3):11–20.
- Bagcier F, Yurdakul OV, Ozduran E. Top 100 cited articles on ankylosing spondylitis. Reumatismo. 2021;72(4):218–27.
- Walsh MN. Social media and cardiology. J Am Coll Cardiol. 2018;71(9):1044–47.
- Chen Y, et al. The quality and reliability of short videos about thyroid nodules on BiliBili and TikTok: cross-sectional study. Digit Health. 2024;10:20552076241288831. doi:10.1177/20552076241288831.
- Zheng S et al. Quality and reliability of liver cancer-related short Chinese videos on TikTok and Bilibili: Cross-sectional content analysis study. J Med Internet Res. 2023;25:e47210. doi:10.2196/47210.
- He Z et al. The reliability and quality of short videos as a source of dietary guidance for inflammatory bowel disease: Cross-sectional study. J Med Internet Res. 2023;25:e41518. doi:10.2196/41518.
- Libretti A, et al. Hysteroscopy in the new media: quality and reliability analysis of hysteroscopy procedures on YouTube™. Arch Gynecol Obstet. 2023;308(5):1515-1524. doi:10.1007/s00404-023-07172-9.
- Zheng X, Li Q, Jin L, Shi K, Deng M. Quality, reliability, and dissemination of lung cancer information on short-video platforms in China: a cross-platform content analysis of TikTok, Kwai, and Rednote. Front Public Health. 2025;13:1683561. doi:10.3389/fpubh.2025.1683561.
- Başmısırlı E, Kip M, Altun H, İnanç N. Evaluating the quality and reliability of YouTube videos providing nutritional recommendations for irritable bowel syndrome. J Hum Nutr Diet. 2025;38(4):e70088. doi:10.1111/jhn.70088.
- Park HW, Park S, Chong M. Conversations and medical news frames on Twitter: Infodemiological study on COVID-19 in South Korea. J Med Internet Res. 2020;22(5):e18897. doi:10.2196/18897.
- Liu Y, Wu R, Zhang L. A cross-sectional study on the quality of cervical cancer health information across multiple short video platforms: analysis of content, quality, and dissemination characteristics. Digit Health. 2026;12:20552076261415927. doi:10.1177/20552076261415927.
- Özduran E et al. Evaluation of the readability of Turkish internet-based patient education materials related to low back pain. J DEU Med. 2022;36(2):135–50.
- Trunfio M, Rossi S. Conceptualising and measuring social media engagement: a systematic literature review. Italian Journal of Marketing. 2021;2021(3):267-292. doi:10.1007/s43039-021-00035-8.
- Pahayahay A, Khalili-Mahani N. What media helps, what media hurts: A mixed-methods survey study of coping with COVID-19 using the media repertoire framework and the appraisal theory of stress. J Med Internet Res. 2020;22(8):e20186. doi:10.2196/20186.
- Ranney ML, Genes N. Social media and healthcare quality improvement: A nascent field. BMJ Qual Saf. 2016;25(6):389–91.
- Liu Z et al. YouTube/Bilibili/TikTok videos as sources of medical information on laryngeal carcinoma: Cross-sectional content analysis study. BMC Public Health. 2024;24(1):1594. doi:10.1186/s12889-024-19077-6.