This study evaluated whether value stream mapping could optimize enhanced recovery after surgery nursing for geriatric orthopedic patients. The optimized nursing process reduced waiting time, improved nursing efficiency, and enhanced early postoperative recovery, supporting value stream mapping as a practical approach for perioperative workflow improvement.
研究文章
Value Stream Mapping-Guided Optimization of Enhanced Recovery After Surgery Nursing in Geriatric Orthopedics: A Controlled Study
本文内容
摘要
摘要
This study investigated whether value stream mapping (VSM)-guided optimization of enhanced recovery after surgery (ERAS) nursing could improve nursing efficiency and reduce waiting time in geriatric orthopedic patients. A non-synchronous controlled study included 105 elderly orthopedic inpatients. The control group (n = 53) received conventional ERAS nursing, whereas the experimental group (n = 52) received an optimized nursing package developed after VSM-based workflow diagnosis, including centralized preoperative examination scheduling, standardized process management, visual dashboards, multidisciplinary collaboration, and structured materials management. Nursing efficiency, waiting time, early postoperative recovery indicators, complications, and satisfaction were compared. Process efficiency was higher in the experimental group than in the control group (15.15% ± 1.71% vs 8.01% ± 1.34%, p < 0.001). Total waiting time was shorter in the experimental group (12.54 ± 2.36 h vs 28.57 ± 4.45 h, p < 0.001). Preoperative preparation time, first ambulation time, and hospital stay were also reduced, and the 72 h pain score, first flatus time, joint range of motion, and satisfaction improved. Value stream mapping-guided ERAS nursing optimization may improve perioperative process efficiency and early recovery in geriatric orthopedic patients.
引言
With the aging population, the number of elderly orthopedic patients continues to increase, creating substantial challenges for perioperative management. Age-related physiological decline, multiple comorbidities, and reduced rehabilitation reserves contribute to prolonged hospitalization and an increased risk of complications1. Enhanced recovery after surgery (ERAS) is an evidence-based perioperative model that uses multidisciplinary collaboration and standardized pathway management to reduce surgical stress, shorten hospital stays, relieve pain, and support functional recovery2. Evidence from studies of elderly patients undergoing hip and knee arthroplasty suggests that ERAS can improve postoperative recovery and quality of life without increasing overall safety risk3. In addition, ERAS-based nursing interventions have demonstrated value in spinal and other orthopedic populations4. However, the clinical effectiveness of ERAS depends not only on individual interventions but also on the efficiency and consistency of the nursing workflow. Redundant processes, delayed preoperative examinations, fragmented communication, and inefficient resource utilization may diminish the benefits of ERAS nursing5.
Value stream mapping (VSM), a core lean management tool, visualizes customer value, business value, and non-value-added activities across a process, thereby identifying waste and providing quantitative support for targeted improvement6. Value stream mapping has been increasingly applied to healthcare process improvement, where it can reduce non–value-added time and improve service efficiency7. Published applications in nursing rounds, oncology day care, and preoperative preparation suggest that VSM can identify workflow inefficiencies and support targeted process redesign8,9,10. Nevertheless, studies integrating VSM with ERAS nursing for geriatric orthopedic patients remain limited. This study used VSM as a quantitative diagnostic tool to identify workflow waste and subsequently developed a multicomponent optimized ERAS nursing package. The study aimed to evaluate its effects on nursing efficiency, patient waiting time, postoperative recovery, complications, and patient satisfaction.
方案
The research was performed in accordance with institutional human research ethics requirements and the Declaration of Helsinki. The study was approved by the Ethics Committee of Guangzhou Dongsheng Hospital (Approval No. 2022-008). All participants or their legal guardians provided written informed consent.
Study design and participants
A non-synchronous controlled design was used. Elderly patients hospitalized in the orthopedic department of a tertiary hospital between September 2024 and September 2025 were screened. Patients admitted between September 2024 and March 2025 comprised the control group, and those admitted between March 2025 and September 2025 comprised the experimental group. A 00:00 cutoff on March 1, 2025, was established to prevent intervention contamination. During the entire study period, full-time ward staffing, monthly surgical volume, operating room quota, and diagnostic appointment capacity were kept stable; bed occupancy fluctuated within ±3% according to hospital operation records, reducing but not eliminating temporal confounding.
Sample size
The primary endpoint was total waiting time. The sample size was calculated using Equation 1 as follows:
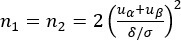
Here, n₁ and n₂ represent the experimental and control group sample sizes, respectively; σ represents the estimated standard deviation; δ represents the between-group mean difference; α was 0.05; and statistical power was 0.90. With uα = 1.96 and uβ = 1.28, each group required approximately 42 cases. Considering 20% attrition, at least 51 cases per group and at least 102 cases in total were required. The estimated standard deviation (σ) of 4.5 h and the anticipated between-group mean difference (δ) of 3.2 h were derived from a preliminary pilot study conducted at our center. The sample size was not calculated for complication outcomes; therefore, nonsignificant complication results were interpreted with caution.
Inclusion criteria
Patients were included if they (1) were aged ≥60 years; (2) were scheduled for elective hip arthroplasty, knee arthroplasty, or spinal surgery; (3) were eligible for ERAS implementation with American Society of Anesthesiologists (ASA) physical status class I–III11; (4) were expected to stay in the hospital for ≥7 d; (5) were conscious and able to cooperate with basic nursing procedures and assessments; and (6) were willing to participate and provided written informed consent.
Exclusion and elimination criteria
Patients were excluded if they (1) had severe cardiac, pulmonary, hepatic, or renal insufficiency; (2) had severe cognitive impairment or psychiatric disorders; (3) had malignant tumors or an expected survival of <6 months; (4) had contraindications to ERAS; (5) had participated in another clinical study within the previous 3 months; or (6) refused to participate. Patients were eliminated if they (1) required transfer to the intensive care unit or another hospital; (2) developed severe complications requiring treatment modification; (3) stayed <7 d; (4) refused assessments more than three times; (5) had >30% missing baseline or outcome data; or (6) were subsequently found not to meet the eligibility criteria.
Grouping
A total of 120 eligible patients were enrolled. Seven patients in the control group and eight patients in the experimental group were excluded during follow-up. Finally, 53 patients in the control group and 52 patients in the experimental group were analyzed. The control group received conventional ERAS nursing, including preoperative education, fasting and fluid restriction management, intraoperative temperature maintenance, postoperative pain control, early mobilization guidance, routine safety management, and standard multidisciplinary communication12,13.
Construction of the VSM-guided intervention
A VSM optimization team was established, consisting of one head nurse, one deputy head nurse, five orthopedic specialist nurses, two orthopedic attending physicians, and one rehabilitation therapist. Team members completed 1 week of training in VSM, lean healthcare, ERAS nursing, workflow analysis, and data collection14,15. VSM was used only as a quantitative diagnostic analysis tool. Centralized examination scheduling, visual dashboards, multidisciplinary collaboration, standardized manuals, and materials management were identified as targeted solutions following VSM-based root-cause analysis16,17. Thus, the final clinical benefit was attributed to the complete optimized ERAS nursing package rather than to VSM alone.
Current-state mapping
Workflow data from 50 geriatric orthopedic patients admitted between June 1, 2024, and August 31, 2024, were reviewed to construct the current value stream. Key workflow nodes included admission assessment, preoperative examination, preoperative education, preoperative preparation, surgery, postoperative monitoring, pain management, first ambulation, rehabilitation training, and discharge preparation. The current-state map identified customer value activities, business value activities, and non–value-added delays. Preoperative education, surgery, pain management, and rehabilitation training were defined as customer value activities, totaling approximately 180 min. Mandatory business activities required approximately 420 min. Waiting for test results, surgical scheduling, and bed turnover created approximately 1,680 min of non–value-added time. The current workflow is shown in Figure 1.
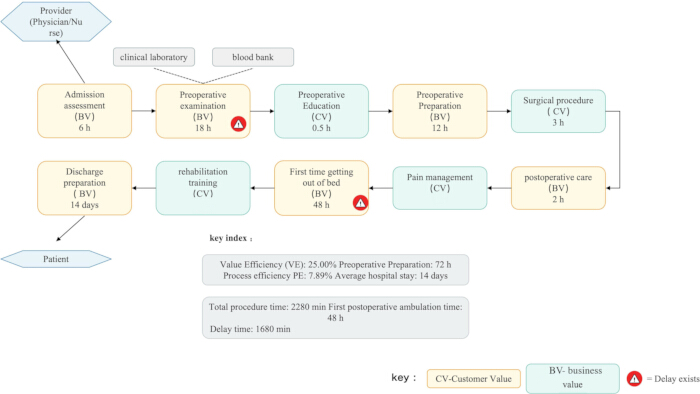
Figure 1: Current-state value stream map of the geriatric orthopedic enhanced recovery after surgery nursing process before optimization. The current-state value stream map illustrates the sequence of admission assessment, preoperative examination, preoperative education, preoperative preparation, surgical procedure, postoperative care, pain management, first ambulation, rehabilitation training, and discharge preparation. Activities are categorized as customer value or business value, and warning symbols indicate workflow delays. Value efficiency was 25.00%, process efficiency was 7.89%, total process time was 2,280 min, delay time was 1,680 min, preoperative preparation time was 72 h, first postoperative ambulation time was 48 h, and the average hospital stay was 14 d. ERAS, enhanced recovery after surgery; CV, customer value; BV, business value; VE, value efficiency; PE, process efficiency. Please click here to view a larger version of this figure.
The two efficiency metrics, value efficiency (VE) and process efficiency (PE), were calculated using customer value (CV) as follows (Equations 2 and 3):


The original VE was 25.00%, and the original PE was 7.89%. A fishbone diagram was then used to analyze personnel, equipment, materials, methods, environment, and other contributing factors associated with process delays and inefficiency (Figure 2). Based on these findings, an improvement burst diagram was developed (Figure 3), followed by a future-state optimized ERAS nursing process (Figure 4).
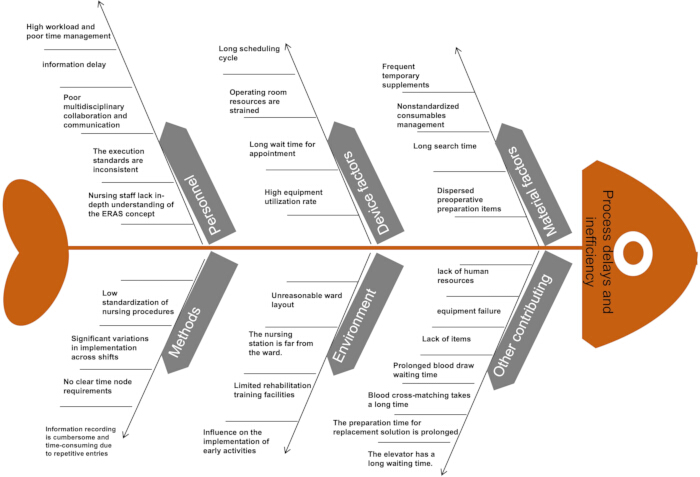
Figure 2: Fishbone analysis of factors contributing to process delays and inefficiency. The fishbone diagram summarizes the root-cause analysis of workflow delays identified during value stream mapping. Contributing factors were categorized into personnel, equipment, materials, methods, environment, and other contributing factors. The identified causes include workload and time-management issues, inconsistent implementation standards, inadequate multidisciplinary communication, strained operating room resources, inefficient materials management, limited rehabilitation resources, equipment-related problems, and delays associated with laboratory testing and patient transport. ERAS, enhanced recovery after surgery. Please click here to view a larger version of this figure.
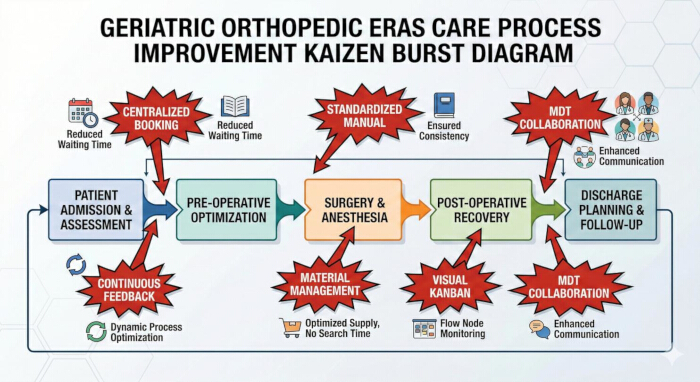
Figure 3: Kaizen burst diagram illustrating the optimized geriatric orthopedic enhanced recovery after surgery care process. The diagram illustrates the principal workflow stages and the targeted improvement measures derived from value stream mapping–based root-cause analysis. Key interventions include centralized booking, standardized manuals, materials management, visual Kanban monitoring, multidisciplinary team collaboration, and continuous feedback to improve workflow efficiency, reduce waiting time, enhance communication, and standardize perioperative care. ERAS, enhanced recovery after surgery; MDT, multidisciplinary team. Please click here to view a larger version of this figure.
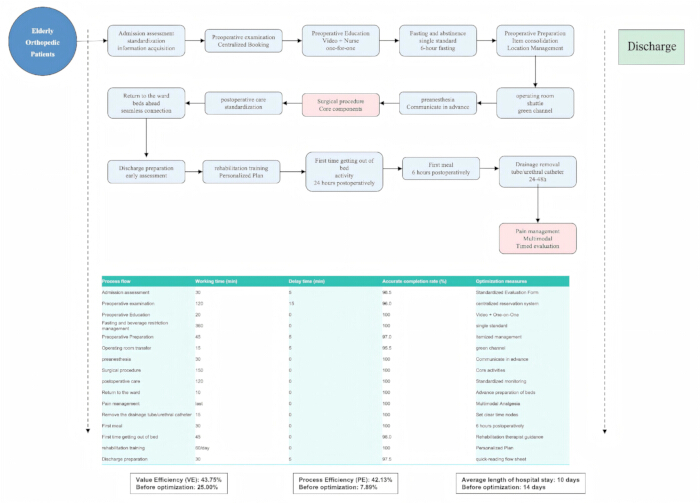
Figure 4: Future-state optimized enhanced recovery after surgery nursing process for geriatric orthopedic patients. The future-state value stream map illustrates the optimized perioperative nursing pathway, including standardized admission assessment, centralized preoperative examination scheduling, patient education, fasting management, preoperative preparation, surgery, postoperative care, rehabilitation training, pain management, first ambulation, and discharge preparation. The embedded summary table presents the working time, delay time, completion rate, and optimization measures for each workflow step. After optimization, value efficiency increased from 25.00% to 43.75%, process efficiency increased from 7.89% to 42.13%, and the average hospital stay decreased from 14 d to 10 d. ERAS, enhanced recovery after surgery; VE, value efficiency; PE, process efficiency. Please click here to view a larger version of this figure.
Implementation
The trial phase ran from September 1, 2024, to February 28, 2025. All nurses received ≥8 h of standardized ERAS nursing training. A centralized appointment system was used so that preoperative examinations could be completed within 24 h after admission. Preoperative education was delivered through simplified illustrated materials, videos, and one-on-one nurse guidance. Fasting was standardized to 6 h for solids and 2 h for clear liquids; fluid intake began 2 h after surgery; a liquid diet began 4–6 h postoperatively; bedside sitting began 6–12 h postoperatively; and first ambulation was targeted within 24 h18,19. Visual dashboards at the nursing station displayed patient pathway progress, and dedicated supply cabinets reduced material search time. A multidisciplinary communication group and a daily 08:00 morning handover coordinated surgical schedules, precautions, nursing progress, and rehabilitation plans. After the 6-month trial and adjustment period, formal implementation began on March 1, 2025.
Evaluation indicators
Nursing efficiency indicators included PE, preoperative preparation time, first postoperative ambulation time, and average length of stay. Waiting indicators included preoperative examination waiting time, surgical waiting time, nursing procedure waiting time, and total waiting time. Total waiting time was defined as the sum of non-overlapping non–value-added waiting intervals during hospitalization; overlapping waiting periods were excluded to avoid duplicate counting. Postoperative rehabilitation indicators included Visual Analog Scale (VAS) pain scores at 24, 48, and 72 h, time to first flatus, and joint range of motion at 7 d. Complications during hospitalization included deep vein thrombosis, pulmonary infection, wound infection, pressure ulcer, and falls. Nursing satisfaction was assessed 1 d before discharge using a 20-item questionnaire covering nursing attitude, nursing skills, health education, and environmental comfort. Materials and software used for this study are listed in Table of Materials.
Statistical analysis
Only statistical analysts were blinded to the group assignments; nurses, physicians, and patients could not be blinded because of the nature of the workflow optimization. To reduce performance and measurement bias, objective time-related data were extracted from the hospital information system where available. Statistical analyses were performed using statistical software. Shapiro–Wilk and Levene’s tests were used to assess normality and homogeneity of variance, respectively. Normally distributed quantitative data are presented as mean ± standard deviation and were compared using independent-samples t-tests. Categorical data are presented as numbers (percentages) and were compared using the chi-square test or Fisher's exact test. A p value < 0.05 was considered statistically significant.
结果
Baseline characteristics
No significant differences were observed between the control and experimental groups in sex, age, education, marital status, living arrangement, medical payment method, surgical type, ASA class, body mass index, number of comorbidities, preoperative nutritional status score, preoperative pain score, preoperative joint range of motion, or previous surgical history (p > 0.05 for all comparisons), indicating that the two groups were comparable at baseline (Table 1).
| Variable | Control group (n = 53) | Experimental group (n = 52) | Test statistic | p value |
| Sex, n (%) | χ² = 0.000 | 1 | ||
| Male | 22 (41.51) | 21 (40.38) | ||
| Female | 31 (58.49) | 31 (59.62) | ||
| Age, mean ± SD (years) | 70.02 ± 5.07 | 70.35 ± 5.75 | t = −0.309 | 0.758 |
| Education, n (%) | χ² = 0.943 | 0.815 | ||
| Primary school or below | 20 (37.74) | 22 (42.31) | ||
| Junior middle school | 15 (28.30) | 13 (25.00) | ||
| High school/technical secondary school | 12 (22.64) | 9 (17.31) | ||
| College degree or above | 6 (11.32) | 8 (15.38) | ||
| Surgical type, n (%) | χ² = 2.445 | 0.295 | ||
| Hip arthroplasty | 17 (32.08) | 23 (44.23) | ||
| Knee arthroplasty | 25 (47.17) | 23 (44.23) | ||
| Spinal surgery | 11 (20.75) | 6 (11.54) | ||
| ASA class, n (%) | χ² = 0.348 | 0.84 | ||
| I | 9 (16.98) | 11 (21.15) | ||
| II | 30 (56.60) | 27 (51.92) | ||
| III | 14 (26.42) | 14 (26.92) | ||
| BMI, mean ± SD (kg/m²) | 23.51 ± 2.51 | 24.07 ± 2.44 | t = −1.158 | 0.249 |
| Number of comorbidities, mean ± SD | 1.79 ± 1.06 | 1.94 ± 1.02 | t = −0.738 | 0.462 |
| Preoperative nutritional status score, mean ± SD | 6.17 ± 3.05 | 6.34 ± 3.24 | t = −0.280 | 0.78 |
| Preoperative pain score (VAS), mean ± SD | 7.05 ± 1.57 | 6.65 ± 1.43 | t = 1.369 | 0.174 |
| Preoperative joint range of motion, mean ± SD (degrees) | 73.66 ± 22.15 | 76.46 ± 19.42 | t = −0.689 | 0.492 |
Table 1: Baseline characteristics of the control and experimental groups. Continuous variables are presented as mean ± standard deviation (SD), and categorical variables are presented as number (percentage). Between-group comparisons were performed using the independent-samples t-test for continuous variables and the chi-square (χ2) test for categorical variables. ASA, American Society of Anesthesiologists; BMI, body mass index; SD, standard deviation; VAS, Visual Analog Scale.
Nursing efficiency
Process efficiency was significantly higher in the experimental group than in the control group (15.15% ± 1.71% vs. 8.01% ± 1.34%, p < 0.001). In addition, preoperative preparation time, first postoperative ambulation time, and average length of stay were all significantly shorter in the experimental group than in the control group (p < 0.001 for all comparisons) (Table 2).
| Metric | Control group (n = 53) | Experimental group (n = 52) | t value | p value |
| Process efficiency (%) | 8.01 ± 1.34 | 15.15 ± 1.71 | −23.793 | <0.001 |
| Preoperative preparation time (h) | 70.93 ± 8.22 | 47.85 ± 6.62 | 15.873 | <0.001 |
| First postoperative ambulation time (h) | 48.32 ± 8.82 | 23.98 ± 4.18 | 18.129 | <0.001 |
| Average length of stay (d) | 13.70 ± 2.03 | 10.05 ± 1.72 | 9.936 | <0.001 |
Table 2: Nursing efficiency indicators. Data are presented as mean ± standard deviation (SD). Process efficiency (%) = (Total customer value activity time / Total process time) × 100. Between-group comparisons were performed using the independent-samples t-test. SD, standard deviation.
Waiting time
Preoperative examination waiting time, surgical waiting time, nursing procedure waiting time, and total waiting time were all significantly reduced in the experimental group compared with the control group (p < 0.001 for all comparisons) (Table 3). Total waiting time was calculated as the sum of non-overlapping non–value-added waiting intervals; therefore, overlapping waiting periods were excluded to avoid duplicate counting.
| Metric | Control group (n = 53) | Experimental group (n = 52) | t value | p value |
| Preoperative examination waiting time (h) | 35.94 ± 5.42 | 17.08 ± 4.16 | 20.015 | <0.001 |
| Surgical waiting time (h) | 28.36 ± 5.29 | 15.69 ± 2.67 | 15.546 | <0.001 |
| Nursing procedure waiting time (min) | 8.23 ± 1.84 | 3.72 ± 0.97 | 15.767 | <0.001 |
| Total waiting time (h) | 28.57 ± 4.45 | 12.54 ± 2.36 | 23.113 | <0.001 |
Table 3: Waiting-time indicators. Data are presented as mean ± standard deviation (SD). Total waiting time was defined as the sum of non-overlapping non–value-added waiting intervals during hospitalization. Overlapping waiting periods among preoperative examination, surgical scheduling, and nursing procedures were excluded to avoid duplicate counting. Between-group comparisons were performed using the independent-samples t-test. SD, standard deviation.
Postoperative recovery
Pain scores at 24 h and 48 h were numerically lower in the experimental group than in the control group but did not differ significantly. However, the 72 h postoperative pain score was significantly lower in the experimental group (2.77 ± 1.02 vs. 3.29 ± 1.11, p = 0.014). Time to first flatus was significantly shorter, and joint range of motion at 7 d was significantly greater in the experimental group than in the control group (p < 0.001 and p = 0.028, respectively) (Table 4).
| Metric | Control group (n = 53) | Experimental group (n = 52) | t value | p value |
| 24-h postoperative VAS pain score | 4.98 ± 1.52 | 4.48 ± 1.26 | 1.833 | 0.07 |
| 48-h postoperative VAS pain score | 3.95 ± 1.44 | 3.81 ± 1.24 | 0.547 | 0.586 |
| 72-h postoperative VAS pain score | 3.29 ± 1.11 | 2.77 ± 1.02 | 2.492 | 0.014 |
| Time to first flatus (h) | 53.27 ± 9.22 | 36.42 ± 7.31 | 10.388 | <0.001 |
| Range of motion at 7 d (degrees) | 89.66 ± 28.46 | 100.88 ± 22.99 | −2.225 | 0.028 |
Table 4: Postoperative rehabilitation indicators. Data are presented as mean ± standard deviation (SD). Pain was assessed using the Visual Analog Scale (VAS), which ranges from 0 to 10, with higher scores indicating greater pain intensity. Joint range of motion was measured 7 d postoperatively. Between-group comparisons were performed using the independent-samples t-test. SD, standard deviation; VAS, Visual Analog Scale.
Complications and patient satisfaction
During hospitalization, the overall complication rate was 22.64% in the control group and 13.46% in the experimental group; however, the difference was not statistically significant (χ2 = 0.937, p = 0.333) (Table 5). Because the study was not powered to detect differences in complication outcomes, these findings should not be interpreted as evidence of safety equivalence. Patient satisfaction, also summarized in Table 5, was significantly higher in the experimental group than in the control group (92.38 ± 4.68 vs. 82.73 ± 6.03, t = −9.164, p < 0.001).
| Variable | Control group (n = 53) | Experimental group (n = 52) | Test statistic | p value |
| Total complications, n (%) | 12 (22.64) | 7 (13.46) | χ² = 0.937 | 0.333 |
| Deep vein thrombosis | 4 (7.55) | 1 (1.92) | — | 0.363 |
| Pulmonary infection | 4 (7.55) | 5 (9.62) | — | 0.741 |
| Wound infection | 2 (3.77) | 1 (1.92) | — | 1 |
| Pressure ulcer | 1 (1.89) | 0 (0.00) | — | 1 |
| Fall | 1 (1.89) | 0 (0.00) | — | 1 |
| Patient satisfaction score, mean ± SD | 82.73 ± 6.03 | 92.38 ± 4.68 | t = −9.164 | <0.001 |
Table 5: In-hospital complications and patient satisfaction. Categorical variables are presented as number (percentage), and the patient satisfaction score is presented as mean ± standard deviation (SD). Between-group comparisons were performed using the chi-square (χ2) test or Fisher's exact test, as appropriate. The em dash (—) in the Test statistic column indicates that Fisher's exact test was used. The study was not powered to detect differences in complication outcomes; therefore, nonsignificant p values should not be interpreted as evidence of safety equivalence. SD, standard deviation.
Data Availability:
The original anonymized clinical dataset is provided in Supplementary Table 1. The case-screening documents and supporting statistical analysis files used in this study are provided as supplementary materials accompanying this manuscript.
SUPPLEMENTARY FILE:
Supplementary Table 1: Original anonymized patient-level dataset used for the statistical analyses. The table contains de-identified demographic characteristics, baseline clinical variables, perioperative nursing efficiency indicators, waiting-time measures, postoperative rehabilitation outcomes, in-hospital complications, and patient satisfaction scores for all enrolled participants. The dataset was used for the statistical analyses reported in this study. ASA, American Society of Anesthesiologists; BMI, body mass index; ERAS, Enhanced Recovery After Surgery; PE, process efficiency; VAS, Visual Analog Scale.Please click here to download this file.
讨论
This study proposes a VSM-guided ERAS nursing process optimization package for geriatric orthopedic care. The package used VSM to diagnose non–value-added waiting and workflow waste and then translated these findings into executable nursing measures, including centralized examination booking, standardized perioperative time points, visual dashboard monitoring, materials location management, multidisciplinary handovers, and individualized rehabilitation planning20,21. The results showed that this bundled workflow approach improved process efficiency, shortened preoperative preparation time, accelerated first postoperative ambulation, reduced the average length of stay, and improved patient satisfaction.
The principal scientific contribution of this study is the translation of lean process analysis into a replicable perioperative nursing pathway for elderly orthopedic patients. Previous ERAS and lean healthcare studies have supported standardized perioperative care and waste reduction22,23,24; however, many reports have focused primarily on isolated interventions or administrative process indicators. By integrating current-state mapping, root-cause analysis, improvement bursts, and future-state workflow reconstruction, the present study provides a practical framework for combining VSM with ERAS nursing quality improvement. This approach may advance perioperative nursing practice by enabling workflow value, delay time, and recovery-related outcomes to be evaluated within a unified improvement framework.
The optimized workflow also has potential applications in clinical departments that manage complex perioperative pathways. In geriatric orthopedic units, this approach may be used to identify delays in examination scheduling, operating room coordination, postoperative monitoring, analgesia, mobilization, and discharge preparation. With appropriate adaptation, the same framework may also support process improvement in joint replacement programs, spine surgery pathways, trauma rehabilitation units, and other settings in which multidisciplinary coordination and time-sensitive nursing interventions influence patient recovery.
Several limitations should be considered. First, the non-synchronous historical control design cannot fully eliminate temporal confounding, including improvements in staff skills, changes in hospital policies, seasonal variation in patient characteristics, and Hawthorne effects. Second, this was a single-center study implemented by a dedicated lean team; therefore, the findings may not be directly generalizable to hospitals with different staffing models, information systems, bed turnover demands, or rehabilitation resources. Third, the sample size was calculated for total waiting time rather than complications, patient satisfaction, or other secondary outcomes; therefore, nonsignificant safety findings should be interpreted with caution. Fourth, only the statistical analysts were blinded, whereas nurses, physicians, and patients could not be blinded because of the nature of the workflow intervention. Fifth, the observation period was limited to hospitalization, and no 30 or 90 d post-discharge follow-up was performed.
Additional study designs could further evaluate this hypothesis. A prospective randomized controlled trial, a cluster-randomized ward-level design, a stepped-wedge implementation study, or a multicenter interrupted time-series design could better distinguish the effects of the optimized nursing package from temporal trends. Qualitative interviews with nurses, physicians, rehabilitation therapists, and patients could further clarify barriers to implementation, whereas cost-effectiveness analyses could determine whether reductions in waiting time and length of stay offset the resources required for staff training, dashboard maintenance, and multidisciplinary coordination.
Future research should validate this VSM-guided ERAS nursing pathway across multiple hospitals and surgical subgroups, extend follow-up to 30 d and 90 d, and include patient-reported outcomes, readmissions, delayed complications, functional recovery, and cost indicators. Future studies should also determine which components of the bundled intervention contribute most substantially to the observed benefits, whether digital dashboards can automate value stream monitoring, and how this approach can be integrated into routine nursing quality management without increasing documentation burden. VSM-guided ERAS nursing optimization improved process efficiency, reduced perioperative waiting time, and promoted early recovery in geriatric orthopedic patients. These findings support bundled workflow improvement as a practical nursing management strategy. However, stronger evidence from randomized, multicenter studies with post-discharge follow-up is needed to confirm these findings.
披露
Conflicts of Interest:
The authors declare that they have no personal, financial, commercial, or academic conflicts of interest.
致谢
This work was supported by the Guangzhou Municipal Civilian Science and Technology Foundation through the project Construction and Clinical Application Research of the Emergency Green Channel for Elderly Hip Fractures (Project No. 2022MZK03).
材料
| 姓名 | 公司 | 目录编号 | 评论 |
|---|---|---|---|
| Dedicated supply cabinet | Institutional equipment | Not applicable | Storage of nursing supplies to reduce material search time |
| Educational videos | Research team | Not applicable | Preoperative patient education |
| Electronic nursing record system | Guangzhou Dongsheng Hospital | Institutional HIS module; URL not applicable | Extraction of nursing process and time-point data |
| Hospital information system | Guangzhou Dongsheng Hospital | Institutional HIS; URL not applicable | Extraction of admission, surgery, discharge, and waiting-time data |
| Multidisciplinary communication platform | Tencent | WeChat; https://weixin.qq.com | Daily multidisciplinary communication among medical, nursing, and rehabilitation teams |
| Simplified illustrated educational materials | Research team | Not applicable | Preoperative patient education |
| Standardized ERAS manual | Guangzhou Dongsheng Hospital | Not applicable | Standardized perioperative nursing guidance |
| Statistical software | IBM | SPSS Statistics Version 27.0; https://www.ibm.com/products/spss-statistics | Statistical analysis |
| Value stream mapping worksheet | Research team | Custom worksheet; RRID not applicable | Workflow mapping and waste analysis |
| Visual Analog Scale (VAS) | Research team | Standard 0–10 pain scale; RRID not applicable | Postoperative pain assessment |
| Visual dashboard (Kanban board) | Research team | Custom ward dashboard; RRID not applicable | Real-time ERAS process monitoring |
参考文献
- Yan E, et al. Association between postoperative delirium and adverse outcomes in older surgical patients: a systematic review and meta-analysis. J Clin Anesth. 2023;89:111221.
- Wainwright TW, et al. Consensus statement for perioperative care in total hip replacement and total knee replacement surgery: Enhanced Recovery After Surgery (ERAS) Society recommendations. Acta Orthop. 2020;91(1):3-19.
- Zhang M, Gong SG, Xie R. Application of enhanced recovery after surgery in perioperative nursing care of elderly patients with hip and knee arthroplasty: a systematic review and meta-analysis. Medicine (Baltimore). 2024;103(9):e37240.
- Zhang D, et al. Evaluating the role of nursing interventions in enhanced recovery after surgery for minimally invasive spine surgery: a retrospective analysis. Front Surg. 2025;12:1519135.
- Choi YS, et al. Enhanced recovery after surgery for major orthopedic surgery: a narrative review. Knee Surg Relat Res. 2022;34:8.
- Khalil V, Foo S. A lean approach for improving medicines management in a cardiac hospital: using value stream mapping to identify non-value-adding activities and improve efficiency. Int J Health Plann Manage. 2024;39(5):1642-51.
- Marin-Garcia JA, Vidal-Carreras PI, Garcia-Sabater JJ. The role of value stream mapping in healthcare services: a scoping review. Int J Environ Res Public Health. 2021;18(3):951.
- Vidal-Carreras PI, Garcia-Sabater JJ, Marin-Garcia JA. Applying value stream mapping to improve the delivery of patient care in the oncology day hospital. Int J Environ Res Public Health. 2022;19(7):4265.
- Alogla A. Revisiting lean healthcare: adopting value stream mapping from manufacturing. Front Health Serv. 2025;5:1613756.
- Xu M, Fang XE. Application of value stream mapping in preoperative preparation for lung transplantation. J Nurs. 2021;36(16):16-18, 28.
- Tan P, Huo M, Zhou X, Zhao B. The safety and effectiveness of enhanced recovery after surgery (ERAS) in older patients undergoing orthopedic surgery: a systematic review and meta-analysis. Arch Orthop Trauma Surg. 2023;143(11):6535-45.
- Zeng B, Deng ZH, Wu L, Zhang J. Utilization of an enhanced recovery after surgery for older patients with a hip fracture: current applications and potential challenges. J Clin Nurs. 2024;33(12):4862-64.
- Brennan C, Parsons G. Enhanced recovery in orthopedics: a prospective audit of an enhanced recovery program for patients undergoing hip or knee arthroplasty. Medsurg Nurs. 2017;26(2):99-104.
- De Barros LB, et al. Lean healthcare tools for processes evaluation: an integrative review. Int J Environ Res Public Health. 2021;18(14):7389.
- Li ZE, et al. Impact of compliance with an enhanced recovery after surgery program on the outcomes among elderly patients undergoing lumbar fusion surgery. Clin Interv Aging. 2020;15:2423-30.
- Hu ZC, et al. An enhanced recovery after surgery program in orthopedic surgery: a systematic review and meta-analysis. J Orthop Surg Res. 2019;14(1):77.
- Tong Y, Fernandez L, Bendo JA, Spivak JM. Enhanced recovery after surgery trends in adult spine surgery: a systematic review. Int J Spine Surg. 2020;14(4):623-40.
- Frassanito L, et al. Enhanced recovery after surgery (ERAS) in hip and knee replacement surgery: description of a multidisciplinary program to improve management of the patients undergoing major orthopedic surgery. Musculoskelet Surg. 2020;104(1):87-92.
- Lei YT, et al. Benefits of early ambulation within 24 h after total knee arthroplasty: a multicenter retrospective cohort study in China. Mil Med Res. 2021;8(1):17.
- Ripolles-Melchor J, et al. Association between use of enhanced recovery after surgery protocol and postoperative complications in total hip and knee arthroplasty in the Postoperative Outcomes Within Enhanced Recovery After Surgery Protocol in Elective Total Hip and Knee Arthroplasty Study (POWER2). JAMA Surg. 2020;155(4):e196024.
- Hung SH, et al. Integration of value stream map and healthcare failure mode and effect analysis into Six Sigma methodology to improve process of surgical specimen handling. J Healthc Eng. 2015;6(3):377-98.
- Jiang HH, et al. Effects of enhanced recovery after surgery in total knee arthroplasty for patients older than 65 years. Orthop Surg. 2019;11(2):229-35.
- Zhang J, et al. Application of interdisciplinary nursing care based on the concept of enhanced recovery after surgery in geriatric hip arthroplasty: a prospective study. Hip Int. 2025;35(6):574-83.
- Tao J, Yan Z, Bai G. Enhanced recovery after surgery rehabilitation protocol in the perioperative period of orthopedics: a systematic review. J Pers Med. 2023;13(3):421.
重印与许可
本文已发表
视频即将推出