This protocol integrates serum ultra-high-performance liquid chromatography coupled with quadrupole-Orbitrap mass spectrometry (UHPLC-Q-Orbitrap-MS), a collagen-induced arthritis (CIA) rat model, micro-computed tomography (micro-CT), histopathology, immunoassays, and protein analyses to evaluate Bitongqing Decoction (BTQ)-associated changes in inflammatory and macrophage phenotype markers.
方法文章
Evaluating Macrophage Polarization and Inflammation in Bitongqing-Treated Collagen-Induced Arthritis Rats
* These authors contributed equally
本文内容
摘要
摘要
Rheumatoid arthritis (RA) is a chronic autoimmune disease characterized by persistent synovial inflammation and immune dysregulation. Traditional Chinese medicine formulas such as Bitongqing Decoction (BTQ) are used clinically, but reproducible workflows are needed to characterize their absorbed constituents and associated immunological effects. This article presents an integrated protocol comprising herbal preparation, collagen-induced arthritis (CIA) induction, 21-day oral treatment, serum ultra-high-performance liquid chromatography coupled with quadrupole-Orbitrap mass spectrometry (UHPLC-Q-Orbitrap-MS), arthritis scoring, micro-computed tomography (micro-CT), hematoxylin and eosin staining, immunohistochemistry, immunofluorescence, enzyme-linked immunosorbent assay (ELISA), and western blotting. The workflow evaluates macroscopic disease manifestations, joint pathology, inflammatory mediators, macrophage-associated M1-like and M2-like markers, splenic T helper 1 (Th1)- and regulatory T cell (Treg)-associated markers, and NF-κB/MAPK signaling proteins. Representative data showed that BTQ treatment was associated with improved arthritis-related outcomes, lower levels of inflammatory mediators, reduced CD80, iNOS, MHCII, and STAT1 signaling, increased CD163 and ARG-1 signaling, altered CXCR3 and FOXP3 signaling, and reduced phosphorylation of P65, ERK, and JNK. Because marker intensities, rather than cell-number ratios, were measured, these findings are described as changes in marker profiles rather than as direct measurements of M1/M2 or Th1/Treg balance. This protocol provides a multimodal framework for pharmacological studies of complex herbal formulas by linking the characterization of circulating constituents with structural, histological, and immunological readouts while preserving physiological interactions among synovial macrophages, lymphocytes, fibroblast-like synoviocytes, and other joint-resident cells.
引言
Rheumatoid arthritis (RA) is a systemic autoimmune disease characterized by synovitis, progressive joint damage, and interactions between innate and adaptive immune cells1,2,3,4. Macrophages are abundant in inflamed synovial tissue and contribute to cytokine production, antigen presentation, osteoclastogenesis, and crosstalk with T cells, B cells, and fibroblast-like synoviocytes4,5,6,7,8,9,10,11,12. Although targeted therapies have improved treatment outcomes, incomplete responses and adverse effects continue to motivate the investigation of multitarget interventions3.
Macrophages in RA exhibit heterogeneous activation states rather than a strict binary M1/M2 phenotype. Nevertheless, panels of M1-like markers, including CD80, iNOS, MHCII, and STAT1, and M2-like markers, including CD163 and ARG-1, provide practical and interpretable readouts when the limitations of these classifications are acknowledged10,13,14. Cellular metabolism is closely associated with pro-inflammatory and reparative macrophage phenotypes in the bone microenvironment15. RA is also a multifactorial disease involving synovial fibroblasts, lymphocytes, osteoclasts, cytokine networks, and systemic complications12,16,17.
Bitongqing Decoction (BTQ) is a multicomponent traditional Chinese medicine formula comprising 12 ingredients: Cinnamomum cassia, Paeonia lactiflora, Gypsum Fibrosum, Rehmannia glutinosa, Saposhnikovia divaricata, Atractylodes lancea, Gentiana macrophylla, Smilax glabra, Lonicera japonica, Sinomenium acutum, Reynoutria japonica, and Glycyrrhiza uralensis. The multicomponent nature of BTQ necessitates an experimental workflow that can link serum-exposed constituents to structural and immunological outcomes in vivo.
The principal advantage of this protocol is the integration of serum pharmacochemistry with an intact-animal collagen-induced arthritis (CIA) model and complementary structural, histological, biochemical, and spatial protein analyses. Compared with single in vitro cell assays, this workflow preserves multicellular and systemic interactions, while the use of multiple complementary endpoints enables cross-modal interpretation of joint damage, inflammatory mediators, immune markers, and signaling proteins. Related biomaterials, hydrogels, photothermal, and multi-omic approaches have broadened osteoarthritis research; however, they address distinct disease contexts and do not substitute for an RA-specific immunological workflow18,19,20,21. The present protocol supports association-based mechanistic interpretation without establishing direct pathway-specific causality.
方案
All animal procedures were approved by the institutional animal ethics committee (approval no. 202210A071) and conducted in accordance with institutional guidelines for laboratory animal care and use.
1. Preparation of Bitongqing decoction
- Prepare the authenticated dried ingredients: Cinnamomum cassia Presl (15 g), Paeonia lactiflora Pall. (15 g), Gypsum Fibrosum (30 g), Rehmannia glutinosa (Gaert.) Libosch. ex Fisch. et Mey. (30 g), Saposhnikovia divaricata (Turcz.) Schischk. (15 g), Atractylodes lancea (Thunb.) DC. (15 g), Gentiana macrophylla Pall. (15 g), Smilax glabra Roxb. (30 g), Lonicera japonica Thunb. (15 g), Sinomenium acutum (Thunb.) Rehd. et Wils. (15 g), Reynoutria japonica Houtt. (15 g), and Glycyrrhiza uralensis. Fisch. (15 g) (Table 1).
- Authenticate each ingredient and record the lot number, voucher specimen, moisture content, and acceptance criteria. Confirm that all crude drugs meet the specified identity and quality requirements.
- Soak the combined dried ingredients (215 g) in 1,500 mL of distilled water for 30 min at room temperature.
- Bring the mixture to a boil and decoct for 30 min. Filter the extract and retain the filtrate.
- Add fresh distilled water to the remaining material and repeat the extraction twice for 30 min each. Combine the three filtrates.
- Concentrate the combined filtrates under reduced pressure at 62 °C to a crude-drug equivalent concentration of 4.3 g/mL. Adjust the final volume to 50 mL and record the yield.
- Store the concentrated decoction at 4 °C until animal administration.
2. Establishment of the collagen-induced arthritis rat model
- Obtain 60 specific pathogen-free female Sprague Dawley rats, 6–8 weeks old and weighing 180–220 g. Acclimate the animals for 1 week at 22 ± 2 °C and 55 ± 10% relative humidity under a 12 h light/12 h dark cycle with ad libitum access to food and water.
- House five rats per cage and provide routine environmental enrichment.
- Dissolve bovine type II collagen in 0.1 N acetic acid overnight at 4 °C to obtain a concentration of 2 mg/mL. Handle acetic acid in a chemical fume hood while wearing appropriate personal protective equipment.
- Emulsify the collagen solution 1:1 (v/v) with complete Freund's adjuvant on ice to obtain 1 mg/mL collagen for primary immunization. Handle the adjuvant in a designated area and prevent accidental self-injection.
- Emulsify the collagen solution 1:1 (v/v) with incomplete Freund's adjuvant on ice to obtain 1 mg/mL collagen for booster immunization. Confirm complete emulsification before injection.
- On Day -14, inject 0.2 mL of the collagen/adjuvant emulsion subcutaneously at the tail base of rats assigned to arthritis induction. Leave the normal-control rats unimmunized.
- On Day -7, inject 0.1 mL of the collagen/adjuvant emulsion subcutaneously as a booster in previously immunized rats.
- On Day 0, score each paw from 0 to 4 according to erythema, swelling, joint involvement, deformity, and weight-bearing impairment. Sum the four paw scores to obtain a cumulative arthritis index of 0–16.
- Include rats with a cumulative arthritis index >4 for randomization into the experimental groups.
3. Group allocation and treatment
- Randomly allocate successfully modeled rats to the collagen-induced arthritis model, low-dose Bitongqing, middle-dose Bitongqing, high-dose Bitongqing, and positive-control groups at 10 rats per group. Assign 10 non-immunized rats to the normal-control group.
- Generate the allocation sequence computationally and blind image and clinical-score assessors to the group assignments.
- Calculate rat doses by body-surface-area normalization using rat dose (mg/kg) = human dose (mg/kg) × (human Km/rat Km). Use Km values of 37 for humans and 6 for rats.
- Set the middle Bitongqing dose at 3.84 g/kg/day. Set the low and high doses at 1.92 g/kg/day and 7.68 g/kg/day, respectively.
- Administer the assigned treatments once daily by oral gavage from Day 0 through Day 20 for 21 consecutive doses.
- Administer Bitongqing decoction at 1.92, 3.84, or 7.68 g/kg/day to the respective treatment groups.
- Administer the positive-control preparation at 9.45 mg/kg/day to the positive-control group. Administer an equal volume of physiological saline to the normal control and arthritis model groups.
4. Specimen collection
- On Day 21, 1 h after the final gavage, induce and maintain anesthesia with 2% isoflurane in oxygen. Confirm an adequate depth of anesthesia before blood collection.
- Collect blood from the abdominal aorta and allow it to clot for 1 h at room temperature. Centrifuge at 1,000 × g. for 15 min, aliquot the serum, and store it at −80 °C.
- Exclude visibly hemolyzed serum samples from mass-spectrometric analysis.
- Euthanize the animals under deep anesthesia according to the approved protocol and confirm death before tissue collection.
- Collect the right knee for micro-computed tomography, followed by fixation and decalcification for hematoxylin and eosin staining, immunohistochemistry, and joint immunofluorescence.
- Collect the left-knee synovium for protein analysis and the spleen for immunofluorescence. Snap-freeze molecular-analysis tissues at −80 °C and fix histological specimens in 4% paraformaldehyde.
5. Micro-computed tomography and histopathological analysis
- Scan the right knee at 65 kV, 385 µA, an 18 µm voxel size, a 0.5° rotation step over 180°, and a 0.5 mm aluminum filter.
- Reconstruct the images using 20% beam-hardening correction and ring-artifact correction of 5. Analyze the reconstructed images using micro-computed tomography analysis software.
- Grade bone erosion independently by two blinded observers on a 0–3 scale: 0, none; 1, focal surface irregularity; 2, multiple cortical erosions; and 3, extensive cortical destruction.
- Decalcify the paraformaldehyde-fixed knee tissues in 10% EDTA for 5 weeks. Confirm adequate decalcification before tissue processing.
- Dehydrate the tissues sequentially in 70%, 80%, 90%, and 95% ethanol for 2 h each and in absolute ethanol twice for 1 h each. Clear the tissues in xylene twice for 20 min each.
- Handle ethanol and xylene in a chemical fume hood while wearing appropriate personal protective equipment. Dispose of solvent waste according to institutional hazardous-waste procedures.
- Embed the tissues in paraffin and cut 4 µm sections using a microtome.
- Deparaffinize the sections in xylene twice for 10 min each. Rehydrate sequentially through 100%, 95%, 90%, 80%, and 70% ethanol and then transfer the sections to water.
- Stain the sections with hematoxylin for 5 min, differentiate and blue the sections, and stain with eosin for 2 min. Dehydrate, clear, and mount the stained sections.
- Acquire images using identical imaging parameters for all experimental groups. Analyze three nonconsecutive sections per rat and five randomly selected fields per section.
- Score synovial lining hyperplasia and inflammatory infiltration from 0 to 3 using a blinded assessor. Apply identical image-analysis parameters to all groups.
- Assess longitudinal macroscopic arthritis using the four-paw cumulative arthritis index defined in step 2.8. Use the 0–16 cumulative score for all groups.
6. Immunohistochemistry and immunofluorescence
- Deparaffinize the synovial sections and incubate them with 3% H₂O₂ for 5–10 min at room temperature to inhibit endogenous peroxidase activity.
- Wash the sections twice with phosphate-buffered saline (PBS) for 5 min per wash.
- Retrieve antigens using a 10 mM sodium citrate buffer at pH 6.0. Wash the sections three times with PBS.
- Block the sections with 5% sheep serum in PBS for 15 min at room temperature. Remove the blocking solution without washing.
- Incubate separate sections overnight at 4 °C with anti-MHCII or anti-STAT1 primary antibody diluted 1:200. Wash three times with PBS for 5 min each.
- Incubate the sections with the appropriate horseradish peroxidase-conjugated secondary antibody diluted 1:500 for 30 min at 37 °C. Wash three times with PBS for 5 min each.
- DAB chromogenic detection, counterstaining, and mounting
- Apply freshly prepared 3,3′-diaminobenzidine (DAB) chromogen working solution to completely cover each section. Incubate at room temperature for 3–5 min while monitoring the formation of a brown precipitate under a light microscope.
- Stop color development by rinsing the sections thoroughly in distilled water.
- Counterstain the sections with hematoxylin for 1 min. Differentiate briefly in 1% hydrochloric acid in ethanol, and blue the sections under running tap water.
- Dehydrate the sections through graded ethanol. Clear them in xylene twice for 5 min each.
- Mount the sections with neutral resin.
- Acquire immunohistochemical images using identical optical settings. Quantify the positive area or integrated optical density in five fields from three non-consecutive sections per rat using a fixed color-deconvolution threshold and blinded analysis.
- Prepare separate serial sections for immunofluorescence and complete the deparaffinization, antigen-retrieval, and blocking procedures described in steps 6.1–6.4.
- Incubate separate sections overnight at 4 °C with anti-CD80, anti-CD163, anti-CXCR3, or anti-FOXP3 primary antibody diluted 1:200.
- Incubate the sections with a fluorescently labeled anti-rabbit secondary antibody diluted 1:500 for 1 h at 37 °C in the dark. Wash three times with phosphate-buffered saline containing detergent for 3 min each.
- Counterstain the nuclei with DAPI for 10 min, then mount the sections in an antifade mounting medium.
- Acquire fluorescence images from all groups using identical optical settings. Quantify mean fluorescence intensity in five fields from three nonconsecutive sections per rat using identical background-subtraction parameters.
- Report individual CD80, CD163, CXCR3, and FOXP3 marker intensities. Do not interpret marker intensities as direct M1/M2 or Th1/Treg cell-number ratios.
7. Enzyme-linked immunosorbent assay
- Thaw the serum samples on ice and mix them gently. Avoid repeated freeze–thaw cycles. Equilibrate the ELISA kits, serum samples, standards, and assay reagents to room temperature for 20 min before use.
- Measure serum IL-1β, IL-6, TNF-α, and C-reactive protein (CRP) using rat ELISA kits. Analyze all standards and samples in duplicate.
- Assay the IL-1β, IL-6, and TNF-α serum samples without predilution. Dilute the serum samples 1:2 with the supplied sample diluent for the CRP assay.
- Prepare the kit-specific standard curves according to the concentration ranges supplied with each kit. Add 50 µL of each standard or prepared serum sample to the designated wells. Leave the blank wells empty.
- Add 100 µL of the supplied horseradish peroxidase-conjugated detection reagent to each standard and sample well. Seal the plate and incubate it at 37 °C for 60 min.
- Remove the liquid from each well. Add 350 µL of wash buffer per well, allow it to stand for 1 min, then remove it completely. Repeat the washing procedure 5 times, then tap the plate dry on absorbent paper after the final wash.
- Add 50 µL each of chromogenic substrates A and B to every well. Incubate the plate at 37 °C in the dark for 15 min. Add 50 µL of stop solution per well and measure absorbance at 450 nm within 15 min.
- Measure serum rheumatoid factor (RF) using a rat RF ELISA kit. Dilute each serum sample 1:5 with the supplied sample diluent.
- Prepare RF standards from 15.6 to 1,000 mIU/mL and analyze the standards and diluted samples in duplicate.
- Add 100 µL of each RF standard or diluted serum sample to the appropriate antibody-coated well. Seal the plate and incubate it at 37 °C for 2 h. Remove the liquid without washing.
- Add 100 µL of the supplied biotin-conjugated detection antibody to each well and incubate at 37 °C for 1 h. Wash the wells three times with 300 µL/well of wash buffer.
- Add 100 µL of horseradish peroxidase-conjugated avidin and incubate at 37 °C for 1 h. Wash the wells five times with 300 µL/well of wash buffer.
- Add 90 µL of TMB substrate solution and incubate at 37 °C in the dark for 15–20 min. Add 50 µL of stop solution and measure absorbance at 450 nm within 5 min.
- Calculate concentrations using four-parameter logistic standard curves and multiply the calculated CRP and RF concentrations by their respective dilution factors.
8. Western blotting
- Pulverize the left-knee synovium in liquid nitrogen. Lyse the tissue in ice-cold radioimmunoprecipitation assay buffer at 10 µL/mg tissue containing 1% protease inhibitor and phosphatase-inhibitor cocktail.
- Centrifuge the lysate at 12,000 × g. for 15 min at 4 °C. Collect the supernatant and determine the protein concentration using a colorimetric protein assay.
- Load 30 µg of protein per lane onto a 10% resolving and 5% stacking polyacrylamide gel. Electrophorese at 80 V for 30 min and then at 120 V for approximately 60 min.
- Transfer the proteins to a 0.45 µm polyvinylidene fluoride membrane at 300 mA for 90 min at 4 °C.
- Block the membrane with 5% bovine serum albumin in Tris-buffered saline containing detergent for 1 h at room temperature.
- Incubate the membranes overnight at 4 °C with primary antibodies against IL-1β, TNF-α, iNOS, ARG-1, NF-κB p65, phospho-NF-κB p65, ERK1/2, phospho-ERK1/2, JNK, and phospho-JNK at 1:1,000. Incubate with anti-β-actin at 1:5,000.
- Wash the membranes three times for 10 min each. Incubate with the appropriate horseradish peroxidase-conjugated secondary antibody at 1:5,000 for 1 h at room temperature.
- Wash the membranes three times and apply a chemiluminescent substrate. Capture nonsaturated images using a chemiluminescence imaging system.
- Quantify band intensities using image-analysis software. Normalize target proteins to β-actin and phosphorylated proteins to their corresponding total proteins.
9. Serum ultra-high-performance liquid chromatography coupled with quadrupole-Orbitrap mass spectrometry
- Use serum collected from the 7.68 g/kg/day Bitongqing group 1 h after the final dose and matched vehicle-treated normal-control serum. Thaw the samples on ice and centrifuge at 12,000 × g. for 15 min at 4 °C.
- Transfer 400 µL of supernatant and add 40 µL of 2 mol/L hydrochloric acid. Vortex for 1 min and incubate at 4 °C for 15 min.
- Handle hydrochloric acid in a chemical fume hood while wearing acid-resistant gloves, a laboratory coat, and eye protection.
- Add 1.2 mL of ethyl acetate, vortex for 5 min, and centrifuge at 12,000 × g. for 10 min at 4 °C. Collect the upper organic layer.
- Handle ethyl acetate in a chemical fume hood and keep it away from ignition sources.
- Add 150 µL of 80% methanol to the collected fraction and vortex for 5 min. Centrifuge at 12,000 × g. for 5 min at 4 °C.
- Handle methanol in a chemical fume hood while wearing appropriate personal protective equipment.
- Filter the supernatant through a 0.22 µm membrane. Pool equal aliquots from each sample to prepare the quality-control sample.
- Separate the serum extracts on a C18 reversed-phase column (2.1 × 100 mm, 1.7 µm) at 40 °C using a flow rate of 0.5 mL/min and an injection volume of 5 µL.
- Use water containing 0.1% formic acid as mobile phase A and acetonitrile as mobile phase B. Apply the following gradient for A: 0–11 min, 85%–25%; 11–12 min, 25%–2%; 12–14 min, 2%; 14–14.1 min, 2%–85%; and 14.1–16 min, 85%.
- Acquire full-scan mass spectra and data-dependent tandem mass spectra in positive- and negative-ion modes over m/z 100–1,500. Set full-scan and tandem mass-spectrometric resolutions to 70,000 and 17,500, respectively.
- Set the spray voltage to 3.5 kV in positive-ion mode and 2.8 kV in negative-ion mode. Set sheath/auxiliary gas to 40/10 and capillary/auxiliary temperatures to 320/350 °C.
- Set the full-scan automatic gain control target to 3 × 10⁶, with a maximum injection time of 100 ms. Set the tandem mass-spectrometric target to 1 × 10⁵ with a 50 ms maximum injection time and stepped normalized collision energies of 20/40/60.
- Process the raw files using chromatographic mass-spectrometry data-processing software. Perform centWave peak detection using a 5 ppm mass tolerance and a 5–30 s peak width, followed by retention-time alignment.
- Retain features with a blank/sample ratio <0.2, quality-control presence ≥50%, and quality-control relative standard deviation <30%.
- Search appropriate spectral, metabolite, chemical, and traditional-medicine compound databases using precursor, fragment, and retention-time tolerances of 5 ppm, 10 ppm, and 0.2 min, respectively.
- Retain identifications with precursor error ≤5 ppm, isotope-pattern agreement, tandem mass-spectral library score ≥70, and signal ≥5-fold above the blank. Confirm compounds against reference standards when available.
- Inject the pooled quality-control sample after every 10 study samples. Require mass error ≤5 ppm, retention-time drift ≤0.2 min, and feature relative standard deviation <30%.
10. Statistical analysis
- Treat each rat as an independent biological replicate and average technical replicate measurements before statistical analysis.
- Assess residual normality using the Shapiro-Wilk test and homogeneity of variance using the Brown-Forsythe test.
- Analyze data satisfying parametric assumptions using one-way analysis of variance followed by Tukey's multiple-comparison test.
- Apply an appropriate data transformation when parametric assumptions are violated. Analyze persistently nonparametric data using the Kruskal-Wallis test followed by Dunn's multiple-comparison test.
- Use two-sided P < 0.05 as the threshold for statistical significance and report exact P. values where space permits.
- Define P < 0.05, P < 0.01, and P < 0.001 for comparisons with the normal-control group and #P < 0.05, ##P < 0.01, and ###P. < 0.001 for comparisons with the collagen-induced arthritis model group.
- Report the biological sample size for each endpoint and distinguish biological replicates from technical replicates.
结果
Untargeted serum analysis generated base-peak chromatograms in positive- and negative-ionization modes. Database-assisted annotation identified 53 compound-associated features in positive-ion mode and 20 in negative-ion mode (Figure 1A,B; Supplementary Table 1 and Supplementary Table 2). Compound assignments were based on the identification criteria and confidence thresholds specified in the protocol. Representative annotated compounds included oleanolic acid, iristectorigenin B, ginsenoside Rg5, quercetin, α-hederin, and eupatilin. Ten representative compounds are summarized in Table 2, with retention times expressed in minutes after conversion from the original values reported in seconds.
Hematoxylin and eosin-stained sections from the collagen-induced arthritis model group showed marked synovial inflammation and cellular infiltration, whereas these pathological features were reduced in the BTQ-treated and positive-control groups (Figure 2A). Cumulative arthritis index and joint swelling measurements were also lower in the treatment groups (Figure 2B,D). Representative micro-computed tomography images showed less severe knee-joint bone erosion in the high-dose BTQ group than in the model group (Figure 2C). These findings demonstrate treatment-associated differences in clinical and structural outcomes but do not constitute formal validation of assay reproducibility.
Western blotting demonstrated higher joint-tissue IL-1β and TNF-α signals in the collagen-induced arthritis model group and lower signals in the high-dose BTQ and positive-control groups (Figure 3A–C). Serum analyses demonstrated group differences in IL-1β, TNF-α, IL-6, rheumatoid factor, and C-reactive protein (Figure 3D–H). The reported sample size represents biologically independent rats, and technical replicate measurements were averaged before statistical analysis.
Synovial immunofluorescence demonstrated higher CD80 and lower CD163 signals in the collagen-induced arthritis model group than in the normal-control group, with the opposite pattern observed after BTQ treatment (Figure 4A,B). Because individual marker intensities were quantified without calculating cell-number ratios, these findings represent changes in macrophage-associated marker profiles rather than a directly measured M1/M2 balance. Western blotting demonstrated group differences in iNOS and ARG-1 (Figure 4C,D), while immunohistochemistry demonstrated differences in MHCII and STAT1 (Figure 5A,B). Together, these findings provide complementary marker-level evidence consistent with altered macrophage phenotype-associated profiles without demonstrating lineage conversion or pathway-specific causality.
Western blotting detected higher phospho-P65, phospho-ERK, and phospho-JNK signals in the collagen-induced arthritis model group and lower signals after high-dose BTQ treatment (Figure 6A,B). The corresponding total protein levels remained comparatively stable. These findings are consistent with reduced NF-κB/ERK/JNK activation following BTQ treatment. p38 and phospho-p38 were not measured.
Splenic immunofluorescence demonstrated higher CXCR3 and lower FOXP3 signals in the collagen-induced arthritis model group, whereas high-dose BTQ treatment was associated with lower CXCR3 and higher FOXP3 signals (Figure 7A,B). Because marker fluorescence intensity was quantified rather than phenotypically defined T-cell populations, these findings represent changes in Th1- and Treg-associated markers rather than a directly measured Th1/Treg balance. Collectively, the observed changes in inflammatory mediators, macrophage-associated markers, splenic immune markers, and NF-κB/ERK/JNK-related proteins are summarized as a proposed, noncausal model of BTQ-associated effects in CIA rats (Figure 8).
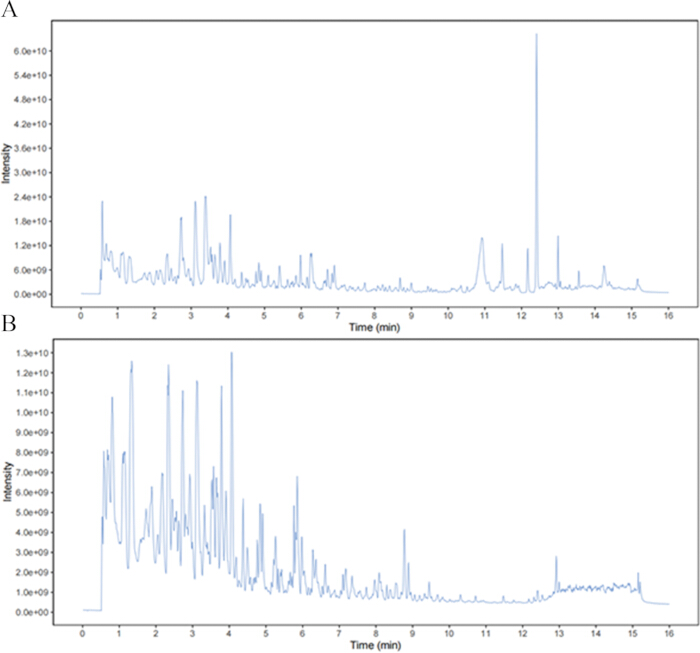
Figure 1: Component analysis of Bitongqing-containing serum by ultra-high-performance liquid chromatography coupled with quadrupole-Orbitrap mass spectrometry. (A) Base-peak chromatogram acquired in positive-ion mode. (B) Base-peak chromatogram acquired in negative-ion mode. Abbreviations: BTQ = Bitongqing Decoction; UHPLC-Q-Orbitrap-MS = ultra-high-performance liquid chromatography coupled with quadrupole-Orbitrap mass spectrometry. Please click here to view a larger version of this figure.
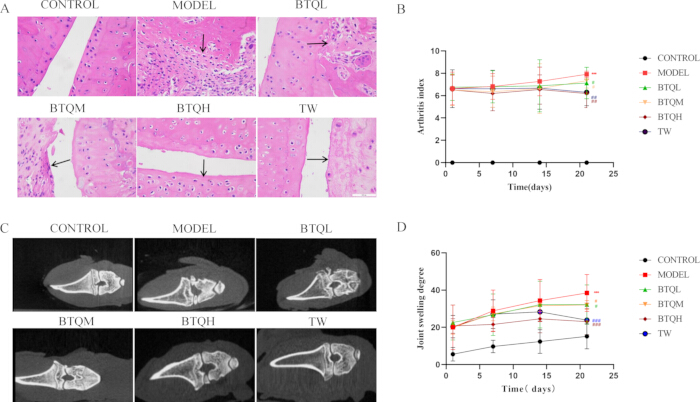
Figure 2: Effects of Bitongqing Decoction on macroscopic disease status and joint pathology in collagen-induced arthritis rats. (A) Representative hematoxylin and eosin-stained images of knee-joint synovial tissue; scale bar = 200 µm. (B) Cumulative four-paw arthritis index. (C) Representative micro-computed tomography images of the knee joint. (D) Joint-swelling measurements. Data are presented as mean ± SD. Arthritis index and joint swelling: n = 10 biologically independent rats per group. Histology and micro-computed tomography: n = 3 biologically independent rats per group selected using a computer-generated random sequence. Data were analyzed using one-way ANOVA followed by Tukey's multiple-comparison test, or Kruskal-Wallis testing followed by Dunn's multiple-comparison test when parametric assumptions are not met. P < 0.05, P < 0.01, and P < 0.001 versus NC; #P < 0.05, ##P < 0.01, and ###P < 0.001 versus the CIA model. Abbreviations: NC = normal control; CIA/MODEL = collagen-induced arthritis model; BTQL = low-dose Bitongqing Decoction; BTQM = middle-dose Bitongqing Decoction; BTQH = high-dose Bitongqing Decoction; TW = positive-control treatment; SD = standard deviation. Please click here to view a larger version of this figure.
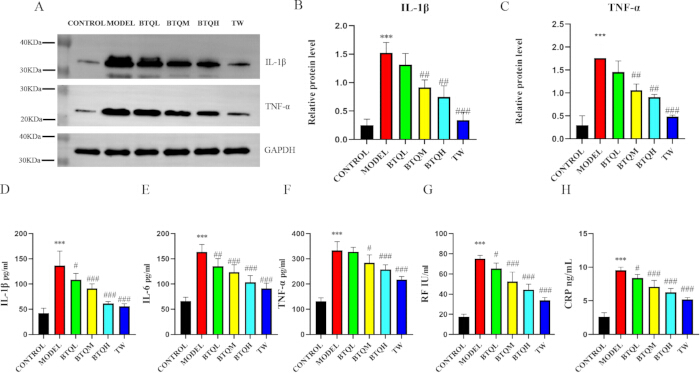
Figure 3: Effects of Bitongqing Decoction on inflammatory markers in serum and joint tissue from collagen-induced arthritis rats. (A–C) Western blotting and densitometric analysis of IL-1β and TNF-α in synovial tissue. (D–H) Serum concentrations of IL-1β, TNF-α, IL-6, rheumatoid factor, and C-reactive protein. Data are presented as mean ± SD from n = 3 biologically independent rats per group selected using a computer-generated random sequence; technical replicates were averaged before analysis. Data were analyzed using one-way ANOVA followed by Tukey's multiple-comparison test, or Kruskal-Wallis testing followed by Dunn's multiple-comparison test when parametric assumptions are not met. P < 0.05, P < 0.01, and P < 0.001 versus NC; #P < 0.05, ##P < 0.01, and ###P < 0.001 versus the CIA model. Abbreviations: NC = normal control; CIA = collagen-induced arthritis; BTQL = low-dose Bitongqing Decoction; BTQM = middle-dose Bitongqing Decoction; BTQH = high-dose Bitongqing Decoction; TW = positive-control treatment; RF = rheumatoid factor; CRP = C-reactive protein; SD = standard deviation. Please click here to view a larger version of this figure.
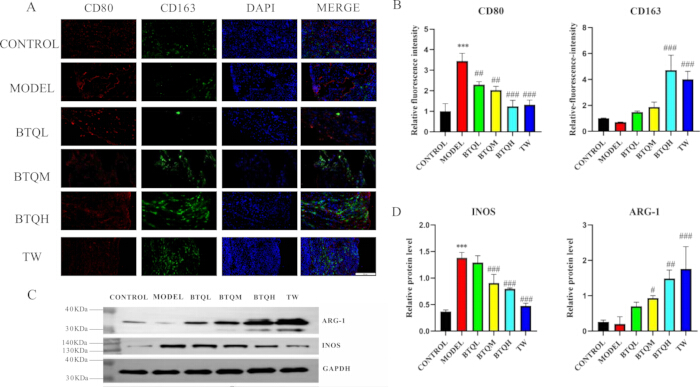
Figure 4: Effects of Bitongqing Decoction on macrophage-associated markers in collagen-induced arthritis rats. (A,B) Synovial CD80, an M1-like marker, and CD163, an M2-like marker, were assessed by immunofluorescence and relative fluorescence intensity; scale bar = 20 µm. (C,D) Synovial iNOS, an M1-like marker, and ARG-1, an M2-like marker, were assessed by western blotting and densitometric analysis. Data are presented as mean ± SD from n = 3 biologically independent rats per group; technical measurements were averaged before analysis. Data were analyzed using one-way ANOVA followed by Tukey's multiple-comparison test, or Kruskal-Wallis testing followed by Dunn's multiple-comparison test when parametric assumptions are not met. P < 0.05, P < 0.01, and P < 0.001 versus NC; #P < 0.05, ##P < 0.01, and ###P < 0.001 versus the CIA model. No CD80/CD163 or iNOS/ARG-1 cell-number ratio was calculated. Abbreviations: NC = normal control; CIA = collagen-induced arthritis; BTQL = low-dose Bitongqing Decoction; BTQM = middle-dose Bitongqing Decoction; BTQH = high-dose Bitongqing Decoction; TW = positive-control treatment; IF = immunofluorescence; SD = standard deviation. Please click here to view a larger version of this figure.
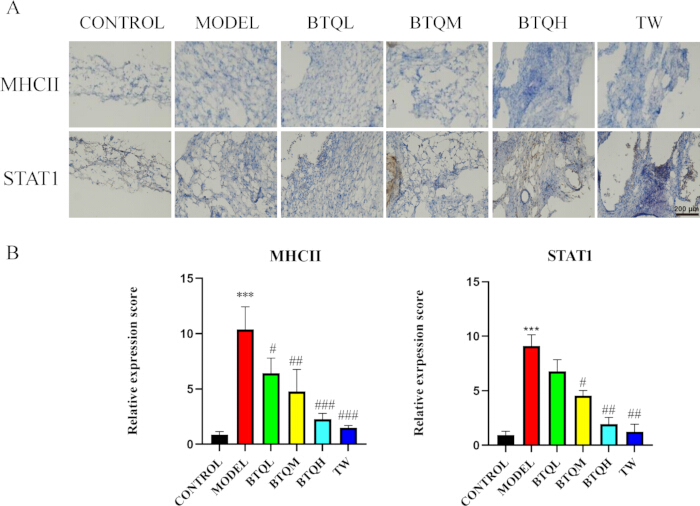
Figure 5: Effects of Bitongqing Decoction on M1-like macrophage-associated markers in collagen-induced arthritis rats. (A,B) Knee-joint MHCII and STAT1 assessed by immunohistochemistry and quantitative image analysis; scale bar = 200 µm. Data are presented as mean ± SD from n = 3 biologically independent rats per group; technical measurements were averaged before analysis. Data were analyzed using one-way ANOVA followed by Tukey's multiple-comparison test, or Kruskal-Wallis testing followed by Dunn's multiple-comparison test when parametric assumptions are not met. P < 0.05, P < 0.01, and P < 0.001 versus NC; #P < 0.05, ##P < 0.01, and ###P < 0.001 versus the CIA model. Abbreviations: NC = normal control; CIA = collagen-induced arthritis; BTQL = low-dose Bitongqing Decoction; BTQM = middle-dose Bitongqing Decoction; BTQH = high-dose Bitongqing Decoction; TW = positive-control treatment; MHCII = major histocompatibility complex class II; STAT1 = signal transducer and activator of transcription 1; SD = standard deviation. Please click here to view a larger version of this figure.
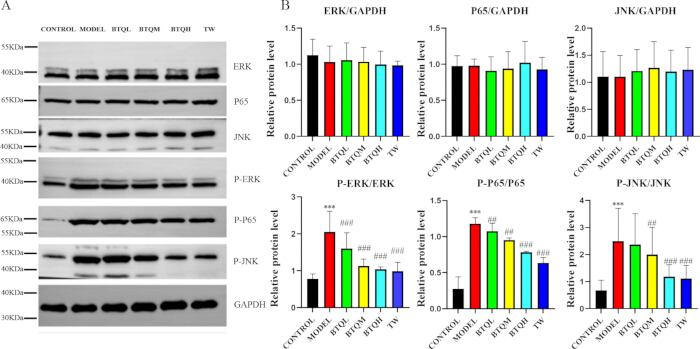
Figure 6: Association of Bitongqing treatment with NF-κB/MAPK signaling proteins in synovial tissue. (A,B) Western blotting and densitometric analysis of P65, phospho-P65, ERK, phospho-ERK, JNK, and phospho-JNK. Data are presented as mean ± SD from n = 3 biologically independent rats per group; technical measurements were averaged before analysis. Data were analyzed using one-way ANOVA followed by Tukey's multiple-comparison test, or Kruskal-Wallis testing followed by Dunn's multiple-comparison test when parametric assumptions are not met. P < 0.05, P < 0.01, and P < 0.001 versus NC; #P < 0.05, ##P < 0.01, and ###P < 0.001 versus the CIA model. p38 and phospho-p38 were not measured. Abbreviations: NC = normal control; CIA = collagen-induced arthritis; BTQL = low-dose Bitongqing Decoction; BTQM = middle-dose Bitongqing Decoction; BTQH = high-dose Bitongqing Decoction; TW = positive-control treatment; ERK = extracellular signal-regulated kinase; JNK = c-Jun N-terminal kinase; MAPK = mitogen-activated protein kinase; SD = standard deviation. Please click here to view a larger version of this figure.
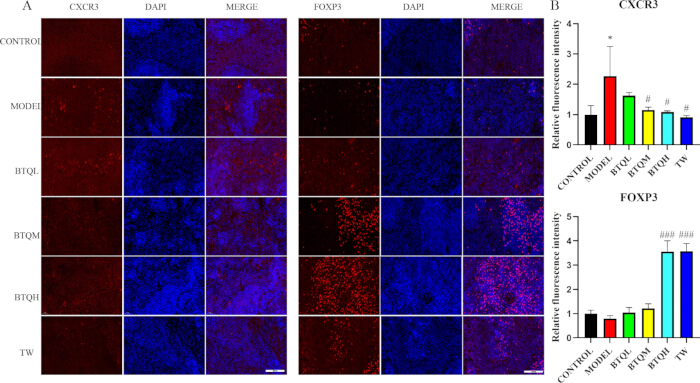
Figure 7: Effects of Bitongqing Decoction on splenic Th1- and Treg-associated markers in collagen-induced arthritis rats. (A,B) CXCR3 and FOXP3 assessed by immunofluorescence and relative fluorescence intensity; scale bar = 200 µm. Data are presented as mean ± SD from n = 3 biologically independent rats per group; technical measurements were averaged before analysis. Data were analyzed using one-way ANOVA followed by Tukey's multiple-comparison test, or Kruskal-Wallis testing followed by Dunn's multiple-comparison test when parametric assumptions are not met. P < 0.05, P < 0.01, and P < 0.001 versus NC; #P < 0.05, ##P < 0.01, and ###P < 0.001 versus the CIA model. No Th1/Treg cell-number ratio was calculated. Abbreviations: NC = normal control; CIA = collagen-induced arthritis; BTQL = low-dose Bitongqing Decoction; BTQM = middle-dose Bitongqing Decoction; BTQH = high-dose Bitongqing Decoction; TW = positive-control treatment; Th1 = T helper 1; Treg = regulatory T cell; CXCR3 = C-X-C motif chemokine receptor 3; FOXP3 = forkhead box P3; IF = immunofluorescence; SD = standard deviation. Please click here to view a larger version of this figure.
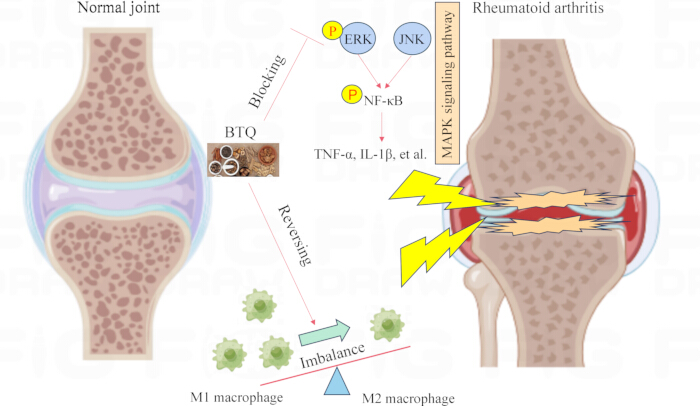
Figure 8: Proposed noncausal schematic summary of the study findings. The schematic illustrates treatment-associated changes in inflammatory mediators, NF-κB/ERK/JNK-related proteins, and macrophage-associated marker profiles. The illustrated relationships represent a proposed working model and do not establish pathway-specific causality or a directly measured M1/M2 balance. Abbreviations: BTQ = Bitongqing Decoction; NF-κB = nuclear factor kappa B; ERK = extracellular signal-regulated kinase; JNK = c-Jun N-terminal kinase. Please click here to view a larger version of this figure.
| Common Name | Latin Botanical/Mineral Name | Dose (g) | Company/Supplier | Batch Number |
| Cassia twig | Cinnamomum cassia Presl | 15 | Affiliated Hospital of Nanjing University of Chinese Medicine | 2509001 |
| Radix paeoniae alba | Paeonia lactiflora Pall. | 15 | Affiliated Hospital of Nanjing University of Chinese Medicine | 2509001 |
| Plaster stone | Gypsum | 30 | Affiliated Hospital of Nanjing University of Chinese Medicine | 2509001 |
| Rehmannia | Rehmannia glutinosa (Gaert.) Libosch. ex Fisch. et Mey. | 30 | Affiliated Hospital of Nanjing University of Chinese Medicine | 2509001 |
| Radix saposhnikoviae | Saposhnikovia divaricata (Turcz.) Schischk. | 15 | Affiliated Hospital of Nanjing University of Chinese Medicine | 2509001 |
| Rhizoma atractylodis | Atractylodes lancea (Thunb.) DC. | 15 | Affiliated Hospital of Nanjing University of Chinese Medicine | 2509001 |
| Radix gentianae macrophyllae | Gentiana macrophylla Pall. | 15 | Affiliated Hospital of Nanjing University of Chinese Medicine | 2509001 |
| Rhizoma smilacis glabrae | Smilax glabra Roxb. | 30 | Affiliated Hospital of Nanjing University of Chinese Medicine | 2509001 |
| Honeysuckle | Lonicera japonica Thunb. | 15 | Affiliated Hospital of Nanjing University of Chinese Medicine | 2509001 |
| Caulis sinomenii | Sinomenium acutum (Thunb.) Rehd. Et Wils. | 15 | Affiliated Hospital of Nanjing University of Chinese Medicine | 2509001 |
| Giant knotweed rhizome | Reynoutria japonica Houtt. | 15 | Affiliated Hospital of Nanjing University of Chinese Medicine | 2509001 |
| Licorice root | Glycyrrhiza uralensis Fisch | 15 | Affiliated Hospital of Nanjing University of Chinese Medicine | 2509001 |
Table 1: Standard formulation of Bitongqing Decoction. The table lists the common names, Latin botanical names, prescribed quantities of raw materials, and sources for the 12 ingredients used to prepare the aqueous extract.
| α-Hederin | Terpenoids | C41H66O12 | 749.4445672 | 7.1964 |
| Eupatilin | Flavonoids | C18H16O7 | 343.0815797 | 6.6619 |
| Tangeretin | Flavonoids | C20H20O7 | 373.1271565 | 6.8989 |
| Calycosin | Flavonoids | C16H12O5 | 285.0749376 | 6.3022 |
| Morusin | Flavonoids | C25H24O6 | 421.1644592 | 9.5777 |
| Apigenin | Flavonoids | C15H10O5 | 269.0449153 | 1.8133 |
Table 2: Representative compounds annotated in Bitongqing-containing serum. Ten representative compounds are listed with retention times expressed in minutes. Values originally exported as rtmed in seconds were converted to minutes by dividing by 60. Corrected retention times are as follows: oleanolic acid, 11.9153 min; iristectorigenin B, 4.6726 min; ginsenoside Rg5, 9.6731 min; quercetin, 3.4098 min; α-hederin, 7.1964 min; eupatilin, 6.6619 min; tangeretin, 6.8989 min; calycosin, 6.3022 min; morusin, 9.5777 min; and apigenin, 1.8133 min.
Supplementary Table 1: Chemical features annotated in Bitongqing-containing serum in negative-ion mode. The table lists chemical features identified in serum by negative-ion mass spectrometry.Please click here to download this file.
Supplementary Table 2: Chemical features annotated in Bitongqing-containing serum in positive-ion mode. The table lists chemical features identified in serum by positive-ion mass spectrometry.Please click here to download this file.
讨论
This protocol integrates Bitongqing Decoction (BTQ) serum pharmacochemistry with an intact-animal collagen-induced arthritis (CIA) model and complementary structural, histological, biochemical, and spatial protein measurements. Its principal advantage is cross-modal interpretation, allowing circulating chemical features to be evaluated alongside joint erosion, synovitis, inflammatory mediators, macrophage-associated markers, splenic immune markers, and signaling proteins. This integrated approach is broader than a single-cell or single-endpoint assay, although it requires greater animal use, coordinated tissue allocation, and careful control of batch-to-batch and imaging variability.
Macrophage activation in rheumatoid arthritis (RA) exists along a continuum and is influenced by local nutrients, oxygen availability, cytokines, and cell-cell interactions. Pro-inflammatory and reparative metabolic programs in the bone microenvironment provide relevant context for the CD80/CD163 and iNOS/ARG-1 patterns measured in this study13,14,15. RA is not exclusively macrophage-driven; fibroblast-like synoviocytes, T cells, B cells, osteoclasts, cytokine networks, and systemic muscular and metabolic changes also contribute to disease pathophysiology10,12,16,17. The marker panel used in this protocol, therefore, represents selected components of a broader multicellular network. Future studies should evaluate the effects of BTQ on synoviocytes, osteoclasts, lymphocyte subsets, and their cytokine-mediated interactions. Osteoarthritis-focused biomaterial and multi-omic studies provide complementary methodological perspectives, but their disease mechanisms should not be conflated with those of autoimmune RA18,19,20,21.
Critical steps include consistent emulsion preparation on ice, prespecified randomization and tissue-side allocation, controlled EDTA decalcification, standardized imaging settings, and prompt low-temperature serum processing. Emulsions that disperse during the cold-water drop test require further emulsification before use. During decalcification, consistently monitor the endpoint to minimize section tearing from insufficient decalcification and antigen loss from prolonged exposure. Exclude visibly hemolyzed serum samples from metabolomic analysis, and inject pooled quality-control samples at predefined intervals. Record instrument acquisition parameters and analysis settings directly from the corresponding acquisition files to support reproducibility.
The molecular findings require cautious interpretation. Reduced phospho-P65, phospho-ERK, and phospho-JNK signals after BTQ treatment are consistent with decreased NF-κB/ERK/JNK activation but do not demonstrate that these pathways directly mediate the treatment effect. p38 is relevant as a background member of the MAPK family; however, neither p38 nor phospho-p38 was measured in this study. Similarly, individual M1-like/M2-like and Th1-associated/Treg-associated marker intensities do not establish cell-state conversion or numerical balance. Pathway inhibition studies, genetic perturbation, flow cytometry, lineage-resolved single-cell analysis, and targeted metabolite validation would be required to support stronger causal inference.
Limitations include incomplete direct assignment of targets to individual BTQ constituents, the relatively small biological sample size used for molecular endpoints, potential selection bias if the three animals were not randomly prespecified, and dependence on batch-specific herbal and instrument quality control. Future studies should validate corrected compound annotations using reference standards, report identification confidence levels, expand cellular profiling, and evaluate dose-exposure-response relationships. Within these limitations, the workflow supports the conclusion that BTQ treatment is associated with improved CIA-related outcomes, altered inflammatory and immune-marker profiles, and reduced NF-κB/ERK/JNK phosphorylation.
披露
The authors declare no competing interests. No AI tool was used to generate or analyze the study data or to create the reported experimental results.
致谢
The study received support from the National Natural Science Foundation of China (81973769) and Xuzhou Medical University (ZX202406), with no involvement in the study design, data collection, and analysis, decision to publish, or manuscript preparation by the funding organization.
材料
| 姓名 | 公司 | 目录编号 | 评论 |
|---|---|---|---|
| Atractylodes lancea | Affiliated Hospital of Nanjing University of Chinese Medicine | Hospital dispensing record | BTQ crude drug |
| 10% EDTA decalcification solution | Commercial reagent | N/A | Joint decalcification |
| 4% paraformaldehyde | Commercial reagent | N/A | Tissue fixation |
| Acetonitrile, LC-MS grade | Merck | 100030 | LC-MS analysis |
| ARG1 antibody | Proteintech | 16001-1-AP | Western blot |
| BCA protein assay kit | Yeasen | 20201ES86 | Protein quantification |
| Beta-actin antibody | Proteintech | 66009-1-Ig | Western blot loading control |
| Bovine type II collagen | Sigma-Aldrich | 234184-M | CIA induction |
| CD163 antibody | Proteintech | 83285-4-RR | IHC |
| CD80 antibody | Proteintech | 86532-1-RR | IHC |
| Chemiluminescence imaging system | Bio-Rad | ChemiDoc series | Western blot imaging |
| Cinnamomum cassia twig | Affiliated Hospital of Nanjing University of Chinese Medicine | Hospital dispensing record | BTQ crude drug |
| Complete Freund's adjuvant | Sigma-Aldrich | 344289 | CIA induction |
| CoraLite488-conjugated goat anti-rabbit IgG | Proteintech | SA00013-2 | Fluorescence secondary antibody |
| CTAn | Bruker | Version 1.17 | Micro-CT analysis |
| CXCR3 antibody | Proteintech | 26756-1-AP | IF |
| ERK1/2 antibody | Proteintech | 11257-1-AP | Western blot |
| Female Sprague-Dawley rats | Jiangsu Huachuang Xinnuo Pharmaceutical Technology Co., Ltd. | SCXK (Su) 2020-0009 | Specific-pathogen-free animals |
| Formic acid | Merck | 5.33002 | LC-MS analysis |
| FOXP3 antibody | Proteintech | 85128-6-RR | IF |
| Gentiana macrophylla root | Affiliated Hospital of Nanjing University of Chinese Medicine | Hospital dispensing record | BTQ crude drug |
| Glycyrrhiza uralensis root | Affiliated Hospital of Nanjing University of Chinese Medicine | Hospital dispensing record | BTQ crude drug |
| GraphPad Prism | GraphPad Software | Version 9.0 | Statistical analysis and graphing |
| Gypsum Fibrosum | Affiliated Hospital of Nanjing University of Chinese Medicine | Hospital dispensing record | BTQ crude drug |
| HRP-conjugated goat anti-mouse IgG | Proteintech | SA00001-1 | Secondary antibody |
| HRP-conjugated goat anti-rabbit IgG | Proteintech | SA00001-2 | Secondary antibody |
| IL-1beta antibody | Proteintech | 84274-1-RR | Western blot |
| ImageJ | National Institutes of Health | Version 1.53c | Image analysis |
| Incomplete Freund's adjuvant | Sigma-Aldrich | N/A | CIA booster immunization |
| iNOS antibody | Proteintech | 22226-1-AP | Western blot |
| Isoflurane | RWD Life Science | N/A | Animal anesthesia |
| JNK antibody | Proteintech | 66210-1-Ig | Western blot |
| LAS X | Leica Microsystems | Version 3.7 | Microscope image acquisition |
| Light/fluorescence microscope | Leica Microsystems | N/A | Histology, IHC and IF imaging |
| Lonicera japonica stem | Affiliated Hospital of Nanjing University of Chinese Medicine | Hospital dispensing record | BTQ crude drug |
| Methanol, LC-MS grade | Merck | N/A | LC-MS analysis |
| MHCII antibody | Proteintech | 17221-1-AP | IHC |
| Micro-CT scanner | Bruker | N/A | Knee-joint imaging |
| Microplate reader | Molecular Devices | N/A | ELISA absorbance at 450 nm |
| NF-kB p65 antibody | Proteintech | 10745-1-AP | Western blot |
| NRecon | Bruker | N/A | Micro-CT reconstruction |
| Orbitrap MS120 mass spectrometer | Thermo Fisher Scientific | MS120 | High-resolution mass spectrometry |
| Paeonia lactiflora root | Affiliated Hospital of Nanjing University of Chinese Medicine | Hospital dispensing record | BTQ crude drug |
| Phospho-ERK1/2 (Thr202/Tyr204) antibody | Proteintech | 28733-1-AP | Western blot |
| Phospho-JNK (Tyr185) antibody | Proteintech | 80024-1-RR | Western blot |
| Phospho-NF-kB p65 (Ser468) antibody | Proteintech | 82335-1-RR | Western blot |
| R | R Foundation for Statistical Computing | Version 4.2 | Data analysis |
| Rat C-reactive protein ELISA kit | Jiangsu Meimian Industrial Co., Ltd. | MM-0081R1 | Serum ELISA |
| Rat IL-1beta ELISA kit | Jiangsu Meimian Industrial Co., Ltd. | MM-0047R1 | Serum ELISA |
| Rat IL-6 ELISA kit | Jiangsu Meimian Industrial Co., Ltd. | MM-0190R1 | Serum ELISA |
| Rat rheumatoid factor ELISA kit | CUSABIO (Wuhan) | CSB-E13666r | Serum ELISA; 15.6-1000 mIU/mL; sensitivity 3.9 mIU/mL |
| Rat TNF-alpha ELISA kit | Jiangsu Meimian Industrial Co., Ltd. | MM-0180R1 | Serum ELISA |
| Rehmannia glutinosa root | Affiliated Hospital of Nanjing University of Chinese Medicine | Hospital dispensing record | BTQ crude drug |
| Reynoutria japonica rhizome | Affiliated Hospital of Nanjing University of Chinese Medicine | Hospital dispensing record | BTQ crude drug |
| RIPA lysis buffer | Beyotime | P0013B | Protein extraction |
| Rotary evaporator | EYELA | N/A | BTQ extract concentration |
| Saposhnikovia divaricata root | Affiliated Hospital of Nanjing University of Chinese Medicine | Hospital dispensing record | BTQ crude drug |
| Sinomenium acutum stem | Affiliated Hospital of Nanjing University of Chinese Medicine | Hospital dispensing record | BTQ crude drug |
| Smilax glabra rhizome | Affiliated Hospital of Nanjing University of Chinese Medicine | Hospital dispensing record | BTQ crude drug |
| SoftMax Pro | Molecular Devices | Version 7.1 | Microplate reader software |
| STAT1 antibody | Proteintech | 66545-1-Ig | IHC |
| TNF-alpha antibody | Proteintech | 26162-1-AP | Western blot |
| Tripterygium glycosides tablets | Commercial pharmaceutical product | N/A | Positive-control treatment |
| Waters ACQUITY UPLC BEH C18 column | Waters | N/A | Chromatographic separation |
| XCMS | Bioconductor | Version 3.20 | LC-MS data processing |
参考文献
- Chen Y et al. Chinese registry of rheumatoid arthritis (CREDIT): Introduction and prevalence of remission in Chinese patients with rheumatoid arthritis. Clinical and Experimental Rheumatology. 2018;36(5):836-840.
- Wolfe F, Allaire S, Michaud K. The prevalence and incidence of work disability in rheumatoid arthritis, and the effect of anti-tumor necrosis factor on work disability. Journal of Rheumatology. 2007;34(11):2211-2217.
- Nagy G, van Vollenhoven RF. Sustained biologic-free and drug-free remission in rheumatoid arthritis, where are we now? Arthritis Research & Therapy. 2015;17:181.
- Udalova IA, Mantovani A, Feldmann M. Macrophage heterogeneity in the context of rheumatoid arthritis. Nature Reviews Rheumatology. 2016;12(8):472-485.
- Kennedy A, Fearon U, Veale DJ, Godson C. Macrophages in synovial inflammation. Frontiers in Immunology. 2011;2:52.
- Bresnihan B et al. Synovial tissue sublining CD68 expression is a biomarker of therapeutic response in rheumatoid arthritis clinical trials: consistency across centers. Journal of Rheumatology. 2009;36(8):1800-1802.
- Mulherin D, Fitzgerald O, Bresnihan B. Synovial tissue macrophage populations and articular damage in rheumatoid arthritis. Arthritis & Rheumatism. 1996;39(1):115-124.
- Tak PP et al. Analysis of the synovial cell infiltrate in early rheumatoid synovial tissue in relation to local disease activity. Arthritis & Rheumatism. 1997;40(2):217-225.
- Haringman JJ et al. Synovial tissue macrophages: a sensitive biomarker for response to treatment in patients with rheumatoid arthritis. Annals of the Rheumatic Diseases. 2005;64(6):834-838.
- Roberts CA, Dickinson AK, Taams LS. The interplay between monocytes/macrophages and CD4+ T cell subsets in rheumatoid arthritis. Frontiers in Immunology. 2015;6:571.
- Yeo L et al. Expression of chemokines CXCL4 and CXCL7 by synovial macrophages defines an early stage of rheumatoid arthritis. Annals of the Rheumatic Diseases. 2016;75(4):763-771.
- Bartok B, Firestein GS. Fibroblast-like synoviocytes: key effector cells in rheumatoid arthritis. Immunological Reviews. 2010;233(1):233-255.
- Cutolo M, Campitiello R, Gotelli E, Soldano S. The role of M1/M2 macrophage polarization in rheumatoid arthritis synovitis. Frontiers in Immunology. 2022;13:867260.
- Zhu W et al. Anti-citrullinated protein antibodies induce macrophage subset disequilibrium in RA patients. Inflammation. 2015;38(6):2067-2075.
- Wang C et al. Immunometabolism of macrophages in the bone microenvironment: a new perspective for bone healing therapy. Journal of Advanced Research. 2026;82:485-506.
- Guo Q et al. Rheumatoid arthritis: pathological mechanisms and modern pharmacologic therapies. Bone Research. 2018;6:15.
- Jin H et al. Pathophysiology of myopenia in rheumatoid arthritis. Bone Research. 2025;13:64.
- Shen X et al. Bone regeneration and antibacterial properties of calcium-phosphorus coatings induced by gentamicin-loaded polydopamine on magnesium alloys. Biomedical Technology. 2024;5:87-101.
- Xiao P et al. Lubrication barriers hydrogel microspheres improve dynamic tissue repair via the blockade of inflammatory communication. Advanced Functional Materials. 2026;36(6):e15734.
- Lu R et al. The biological association between programmed cell death function and osteoarthritis using multi-omic Mendelian randomization. Biomedical Technology. 2025;12:100102.
- Gong Z et al. MXene-based photothermal-responsive injectable hydrogel microsphere modulates physicochemical microenvironment to alleviate osteoarthritis. Smart Medicine. 2025;4:e70006.