This study integrates two public pediatric adipose tissue transcriptomic datasets to characterize obesity-associated candidate genes, coexpression patterns, pathway annotations, immune score associations, and predicted regulatory relationships.
研究文章
Integrative Transcriptomic Analysis of Obesity-Associated Candidate Genes in Pediatric Adipose Tissue
* These authors contributed equally
本文内容
摘要
摘要
Tryptophan metabolism has been linked to pediatric obesity, although the transcriptomic evidence connecting obesity-associated genes with this pathway remains limited. Two public subcutaneous adipose tissue datasets, GSE205668 and GSE104815, were analyzed. GSE205668 included 26 obesity and 35 control samples, and GSE104815 included 4 obesity and 4 control samples. Differential expression screening, weighted gene coexpression network analysis (WGCNA), exploratory coexpression enrichment, immune score analysis, and regulatory network prediction were performed. Four candidate genes, APOL4, FASN, KRT79, and MACROD1, emerged from the exploratory intersection analysis. Their expression was higher in control samples than in obesity samples in both public datasets. Results derived from nominal p-value screens are interpreted as exploratory. The literature-derived tryptophan-related WGCNA score is considered separately from the canonical Kyoto Encyclopedia of Genes and Genomes (KEGG) tryptophan-metabolism pathway. These findings define obesity-associated transcriptomic candidates in pediatric adipose tissue and do not establish direct participation of the four genes in tryptophan metabolism or a causal role in obesity.
引言
Pediatric obesity is associated with metabolic, cardiovascular, and psychosocial burdens that can begin early in life1,2,3,4,5,6. Metabolomic studies have also reported alterations in amino-acid metabolism in children with obesity, including changes involving tryptophan and its downstream metabolites7,8. These observations support investigation of transcriptomic patterns that occur alongside obesity-related metabolic changes. The relationship between individual obesity-associated transcripts and canonical tryptophan-metabolism genes, however, remains incompletely defined.
In the cohorts underlying the available public datasets, pediatric adipose tissue was collected during elective surgery, which limits the number of samples that can be studied9,10. Publicly deposited pediatric adipose tissue transcriptomes therefore provide a practical starting point for generating hypotheses about obesity-associated expression programs. Two such resources are an RNA sequencing dataset from the Leipzig Childhood Adipose Tissue cohort (GSE205668)9 and a microarray dataset of abdominal subcutaneous adipose tissue from prepubertal children with and without obesity (GSE104815)10.
Complementary computational approaches can be applied to such datasets. Differential expression analysis identifies genes that differ between groups. Weighted gene coexpression network analysis (WGCNA) groups genes into modules of correlated expression and relates module eigengenes to sample-level traits. Single-sample gene set scoring summarizes pathway or immune-cell signatures in each sample, and target-prediction resources with network visualization place candidate genes in a predicted regulatory context. Each step can be implemented with open-source R/Bioconductor packages and network software11,12,13,14,15,16,17. Combining these approaches in one workflow prioritizes genes that meet both a between-group criterion and a coexpression criterion, and it describes each prioritized gene in pathway, immune-score, and regulatory context using the same public data. Analyzing each dataset with a platform-appropriate pipeline and requiring a concordant direction of change across datasets reduces reliance on a single cohort. Because every input is publicly available, the workflow can be repeated and adapted to other pediatric tissue datasets. It is intended for researchers who wish to prioritize candidate genes from small public pediatric transcriptomic datasets before designing targeted experimental studies.
Two public pediatric adipose tissue transcriptomic datasets were therefore integrated to identify reproducible obesity-associated expression patterns and to examine their coexpression, pathway, immune score, and regulatory network context. The four genes highlighted in this study are treated as candidate obesity-associated transcripts. Their identification does not assign them to the canonical tryptophan-metabolism pathway.
方案
Data sources
Publicly available transcriptomic datasets GSE205668 and GSE104815 were retrieved from the National Center for Biotechnology Information (NCBI) Gene Expression Omnibus (GEO). GSE205668 comprised 61 pediatric subcutaneous adipose tissue samples, including 26 from children with obesity and 35 controls, and was generated on the HiSeq 2500 platform (GPL16791). According to the GEO series record, sequencing quality was assessed with FastQC, reads were aligned to hg38 with TopHat v2.0.8b, gene-level counts were obtained with featureCounts, and source processing included ComBat.
GSE104815 comprised eight abdominal subcutaneous adipose tissue samples, including four from children with obesity and four non-obese controls, and was generated on the Human LncRNA Microarray V4 platform (GPL21827). According to the GEO record, signal extraction was performed with Feature Extraction software v11.0.1.1, followed by quantile normalization in GeneSpring GX v12.1. The two datasets were processed and analyzed independently because they were generated on different platforms. Their expression matrices were not merged, and no cross-dataset batch correction was applied.
Participant characteristics available for each dataset are summarized in Table 1. GSE205668 was derived from the Leipzig Childhood Adipose Tissue cohort, which enrolled Caucasian children aged 0–18 years undergoing elective orthopedic surgery, herniotomy, orchidopexy, or other surgery. Children with diabetes, generalized inflammation, malignant disease, genetic syndromes, permanent immobilization, or medication that might affect adipose tissue biology were excluded, and obesity was defined as a body mass index (BMI) standard deviation score (SDS) above 1.88, corresponding to the 97th centile of German reference data9. GSE104815 was derived from a cohort of 31 obese and 31 non-obese prepubertal Chinese children from whom abdominal subcutaneous adipose tissue was collected during surgery. Obesity was defined as a BMI above the 95th percentile of the Chinese reference. Children with genetic obesity syndromes, infectious or autoimmune disease, tumors, hormone deficiency, malnutrition, type 2 diabetes, or medication affecting blood pressure, glucose, or lipid metabolism were excluded, and four children from each group were selected at random for microarray profiling10. The source study reported no difference in age or sex between the obese and non-obese groups of the parent cohort. Sample-level age, sex, BMI SDS, pubertal stage, and comorbidity data were not consistently available in the public records for the analyzed samples, and baseline values for the eight children profiled in GSE104815 were not reported separately in the source publication. These variables are therefore reported at the cohort level, and matching of obesity and control samples was not described for either analyzed sample set.
For WGCNA, the trait was the literature-derived tryptophan-related score used in the original analysis. Because the constituent gene list could not be reconstructed from the retained analysis materials, this score was treated as exploratory. Supplementary Table 1 provides the 40 genes annotated to KEGG hsa00380 as a reproducible reference for canonical tryptophan metabolism. This reference set was used for pathway context and was not substituted into the WGCNA trait.
Identification of differentially expressed genes and enrichment analysis
Differential expression analysis of GSE205668 was performed with DESeq211, and GSE104815 was analyzed with limma12. The differentially expressed gene (DEG) screening threshold was nominal p < 0.05 with |log₂FC| > 0.5, where log₂FC denotes log₂ fold change. Each dataset was analyzed independently. Shared genes were defined by overlap of the two screening lists with concordant direction of change. Venn diagrams were generated with ggVennDiagram13. Gene Ontology, Kyoto Encyclopedia of Genes and Genomes, and Disease Ontology enrichment of the shared screening list was performed with clusterProfiler14. A gene–disease association network of the shared screening list was also generated (Figure 2B). Because multiple-testing adjustment was not applied at the DEG screening stage, these DEG counts and enrichment results are reported as exploratory results and are not treated as confirmatory evidence. Genes in the shared screening list, including the four candidate genes, were not tested for differential expression under false discovery rate control, so candidate-gene selection depends on this unadjusted screen.
Exploratory weighted gene coexpression network analysis
Weighted gene coexpression network analysis was performed with WGCNA15 in GSE205668. Hierarchical clustering identified no sample-level outliers. Soft-threshold powers of 1–20 were evaluated, and β = 10 was selected because the signed scale-free topology fit index at this power exceeded the prespecified threshold of R2 = 0.85 while mean connectivity remained low. Dynamic tree cutting with a minimum module size of 150 genes identified eight assigned modules and one gray module of unassigned genes. The literature-derived exploratory tryptophan-related score used in the analysis was calculated with GSVA16. Module eigengenes were correlated with that score using Pearson correlation. MEblack showed the strongest positive association, with r = 0.44 and p = 4 × 10⁻4. Among assigned non-gray modules, MEyellow showed the strongest negative association, with r = −0.35 and p = 0.006. These module associations are treated as exploratory and are not interpreted as evidence that module members are canonical tryptophan-metabolism genes. The WGCNA settings comprised the candidate power range (1–20), the R2 threshold (0.85), β = 10, the minimum module size (150 genes), dynamic tree cutting, and Pearson correlation between module eigengenes and the score. The signed scale-free fit index exceeded 0.85 across adjacent powers of 8–15 (Figure 3B).
Identification and characterization of candidate genes
Candidate genes were identified from the exploratory intersection of the shared DEG screening list and the selected WGCNA module genes. Chromosomal locations were checked against current NCBI Gene records and summarized as APOL4 at 22q12.3, FASN at 17q25.3, KRT79 at 12q13.13, and MACROD1 at 11q13.1. Figure 4B is a schematic drawn from these NCBI Gene cytogenetic band assignments, with approximate positions on the GRCh38 assembly. The two selected modules (MEblack and MEyellow) together contained 1,117 genes, and the four candidate genes were identified from the intersection of this combined module gene set with the shared DEG screening list (Figure 4A). Candidate-gene expression patterns were examined in GSE205668 and GSE104815.
Exploratory coexpression enrichment analysis
For each candidate gene, Spearman correlations with all genes in GSE205668 were calculated and genes were ranked by the correlation coefficient. Enrichment analysis was then performed with clusterProfiler using the c2.kegg.v7.4.symbols collection from the Molecular Signatures Database. This procedure characterizes coexpression neighborhoods and is not interpreted as phenotype-based gene set enrichment analysis (GSEA) or as direct functional validation of an individual candidate gene. Complete normalized enrichment scores (NES), nominal p values, adjusted p values, q values, leading-edge summaries, and core-enrichment genes are reported in Supplementary File 1. Corresponding enrichment curves are provided in Supplementary Figure 1A–D.
Immune infiltration analysis
Scores for 28 inferred immune-cell populations were calculated in GSE205668 by single-sample gene set enrichment analysis (ssGSEA) implemented in GSVA16. Group comparisons used the Wilcoxon rank-sum test. The unadjusted comparison identified 13 nominal signals. No multiplicity-adjusted significance is assigned to individual immune-cell populations. Effect estimates and multiplicity-adjusted p values were not calculated for the 28 comparisons, so the cell-level findings rest solely on this unadjusted exploratory screen. Spearman correlations between candidate-gene expression and the 28 inferred immune-cell scores were examined as exploratory associations. These scores reflect transcriptomic inference rather than direct cell counts.
Construction of a regulatory network
DIANA microT-CDS and miRDB were used to predict microRNAs (miRNAs) associated with the candidate genes. Predictions shared by both resources were retained. starBase was used to identify long noncoding RNAs (lncRNAs) linked to the shared miRNAs with clipExpNum > 50. ChEA3 was used to predict transcription factors regulating the candidate genes. Predicted transcription factors were intersected with the DEG screening list to obtain differentially expressed transcription factors. Cytoscape17 was used to visualize the lncRNA-miRNA-mRNA and transcription-factor candidate-gene networks.
Statistical analysis
All analyses were performed in R. The R version was 4.3.0 (Windows), and the Bioconductor packages were from Bioconductor release 3.17, including DESeq2 1.40, limma 3.56, GSVA 1.48, and clusterProfiler 4.8. WGCNA (CRAN) 1.72-5 and ggVennDiagram 1.5.2 were also used. Wilcoxon rank-sum tests were used for two-group comparisons, and Spearman correlation was used for gene-score associations. Unless an adjusted p value or q value is explicitly reported, p values are nominal. The DEG and immune score analyses are therefore interpreted as exploratory. Adjusted p values and q values are reported for the coexpression enrichment results in Supplementary File 1.
结果
Exploratory differential expression screening identified a shared obesity-associated gene set
Using the nominal screening threshold, 695 genes were identified in GSE205668, including 372 upregulated and 323 downregulated genes, and 3,163 genes in GSE104815, including 1,641 upregulated and 1,522 downregulated genes. The concordant overlap contained 193 genes, with 97 upregulated and 96 downregulated in obesity samples (Figure 1A–F). Because these counts were generated with a nominal p value threshold, they are retained as exploratory screening results. Gene Ontology annotations included regulation of immune effector processes, leukocyte migration, secretory granule membrane, specific granule, amide binding, and vitamin binding (Figure 2A). The gene–disease association network linked shared genes to breast carcinoma, invasive bladder carcinoma, and latent tuberculosis terms (Figure 2B). KEGG annotations included cytokine–cytokine receptor interaction, calcium signaling pathway, tuberculosis, glycosphingolipid biosynthesis, fatty acid biosynthesis, and butanoate metabolism (Figure 2C–D). Disease Ontology annotations included intestinal disease, nephritis, obstructive lung disease, chronic obstructive pulmonary disease, and upper respiratory tract disease (Figure 2E–F). These terms describe annotation of the shared screening list and do not imply disease causality.
Exploratory WGCNA identified two modules with the strongest associations with the literature-derived score
Hierarchical clustering identified no sample-level outliers (Figure 3A). At β = 10, the scale-free topology fit index exceeded the R2 threshold of 0.85 (Figure 3B). Dynamic tree cutting with a minimum module size of 150 genes identified eight assigned modules and one gray module (Figure 3C). MEblack showed the strongest positive association with the exploratory score, with r = 0.44 and p = 4 × 10⁻4. Among assigned non-gray modules, MEyellow showed the strongest negative association, with r = −0.35 and p = 0.006. Together, these modules contained 1,117 genes (Figure 3D). The module-score associations are interpreted as exploratory coexpression relationships.
Four candidate genes emerged from the exploratory intersection analysis
The intersection of the shared DEG screening list and the selected WGCNA module genes identified APOL4, FASN, KRT79, and MACROD1 as candidate genes (Figure 4A). Verified chromosomal locations are APOL4 at 22q12.3, FASN at 17q25.3, KRT79 at 12q13.13, and MACROD1 at 11q13.1 (Figure 4B). Exploratory coexpression enrichment results for the four candidates are reported in Supplementary File 1 and Supplementary Figure 1A–D. These results describe genes that vary with each candidate transcript and are not presented as direct functional GSEA of the obesity phenotype.
Immune-score analysis showed exploratory group and gene-score associations
Scores for all 28 inferred immune-cell populations were visualized in GSE205668 (Figure 5A). The unadjusted screen identified 13 populations at nominal p < 0.05, including activated B cells, activated dendritic cells, and central memory CD4 T cells (Figure 5B). The direction of change was not uniform across populations. The strongest observed correlations were between APOL4 and neutrophil scores, with r = 0.44, and between MACROD1 and central memory CD8 T-cell scores, with r = −0.62 (Figure 5C). These results are exploratory and do not establish candidate gene regulation of specific immune-cell populations.
Predicted regulatory networks were partial and exploratory
The lncRNA-miRNA-mRNA network contained three of the four candidate genes, 55 miRNAs, and 9 lncRNAs. APOL4 was connected through NEAT1-hsa-miR-513b-5p and XIST-hsa-miR-136-5p relationships (Figure 6A). MACROD1 was absent because no complete lncRNA-miRNA-mRNA chain meeting the stated intersection criteria was retained for that candidate, so the displayed network is partial. The intersection of 533 predicted transcription factors with the DEG screening list yielded five differentially expressed transcription factors. In the displayed network, FASN was associated with SALL4, TWIST1, RARB, and STAT4 (Figure 6B and Figure 6C). The four candidate genes showed higher expression in control samples than in obesity samples in both public datasets (Figure 7A and Figure 7B). GSE104815 contains only four samples per group, so panel B is presented descriptively without inferential significance labels.
Overall, the public transcriptomic analyses identify four obesity-associated candidate genes in pediatric adipose tissue. The evidence is exploratory. It does not establish direct involvement of these genes in canonical tryptophan metabolism, a cellular mechanism, diagnostic performance, or causality.
DATA AVAILABILITY:
The gene-expression data for GSE205668 and GSE104815 are publicly available from the NCBI Gene Expression Omnibus. The study contains no newly collected clinical samples and no wet-lab validation data. The supplementary material includes the coexpression enrichment tables and the canonical KEGG hsa00380 reference gene set used for pathway context.
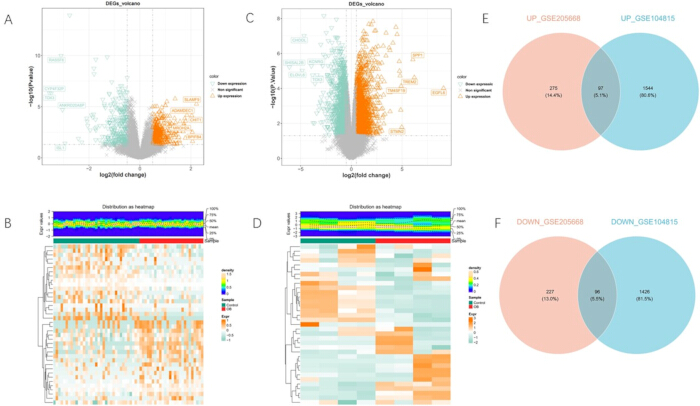
Figure 1: Exploratory differential expression screening in two public pediatric adipose tissue datasets. (A) Volcano plot for GSE205668. (B) Heatmap for GSE205668. (C) Volcano plot for GSE104815. (D) Heatmap for GSE104815. (E) Overlap of upregulated genes. (F) Overlap of downregulated genes. GSE205668 contains 26 obesity and 35 control samples. GSE104815 contains 4 obesity and 4 control samples. DEG counts were obtained using the nominal screening threshold and are interpreted as exploratory. Please click here to view a larger version of this figure.
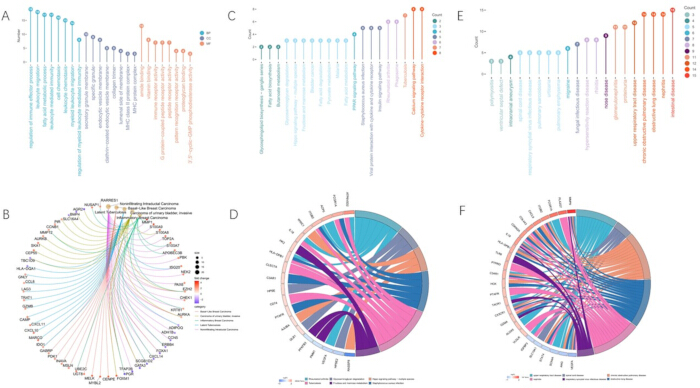
Figure 2: Functional annotation of the shared exploratory screening list. (A) Gene Ontology enrichment lollipop plot of biological process (BP), cellular component (CC), and molecular function (MF) terms; the vertical axis shows the number of shared genes annotated to each term. (B) Gene–disease association network linking shared genes to five disease terms: basal-like breast carcinoma, carcinoma of urinary bladder (invasive), inflammatory breast carcinoma, latent tuberculosis, and noninfiltrating intraductal carcinoma. Gene node color indicates log2 fold change, and term node size indicates the number of linked genes. (C) KEGG enrichment lollipop plot; the vertical axis and point color show gene counts. (D) KEGG chord diagram linking shared genes, colored by log2 fold change, to six KEGG pathways. (E) Disease Ontology enrichment lollipop plot. (F) Disease Ontology chord diagram linking shared genes to six Disease Ontology terms. The displayed terms are annotations of the 193-gene exploratory overlap and are not ranked in the text as causal pathways. Please click here to view a larger version of this figure.
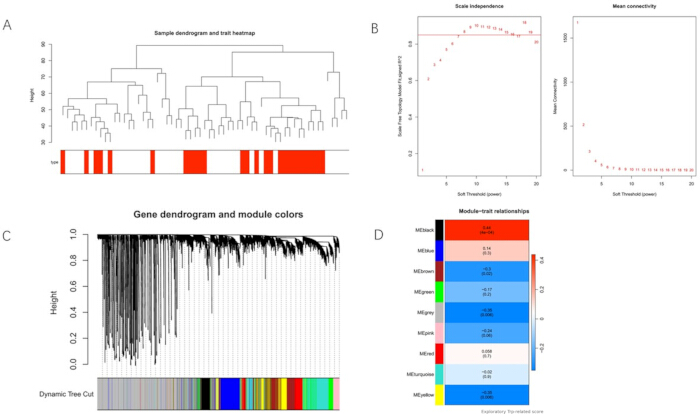
Figure 3: Exploratory WGCNA module associations. (A) Hierarchical clustering of GSE205668 samples. (B) Scale-free topology fit and mean connectivity across soft-threshold powers. (C) Coexpression modules identified by dynamic tree cutting. (D) Correlations between module eigengenes and the literature-derived exploratory tryptophan-related score. MEblack showed r = 0.44 with p = 4 × 10⁻4. Among assigned non-gray modules, MEyellow showed r = −0.35 with p = 0.006. The selected power was β = 10, and the red horizontal line in panel B marks the R2 threshold of 0.85. Panel D shows eight assigned modules and the gray module of unassigned genes. Please click here to view a larger version of this figure.
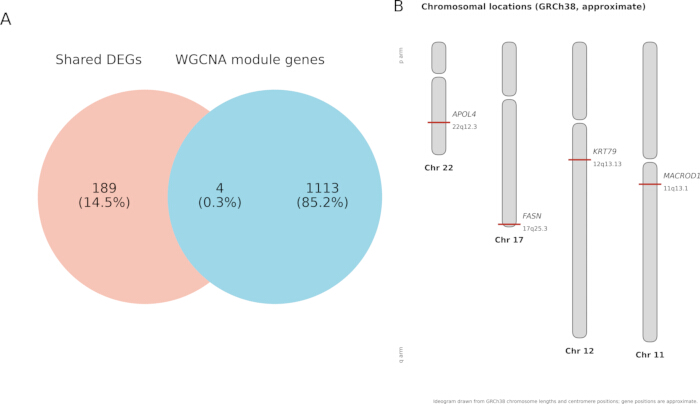
Figure 4: Candidate-gene intersection and verified chromosomal locations. (A) Intersection of the shared exploratory DEG list and selected WGCNA module genes (MEblack and MEyellow, 1,117 genes). (B) Verified locations of APOL4 at 22q12.3, FASN at 17q25.3, KRT79 at 12q13.13, and MACROD1 at 11q13.1. Chromosome lengths and gene positions are drawn approximately to scale on the GRCh38 assembly, with the short arm (p) at the top of each chromosome. Please click here to view a larger version of this figure.
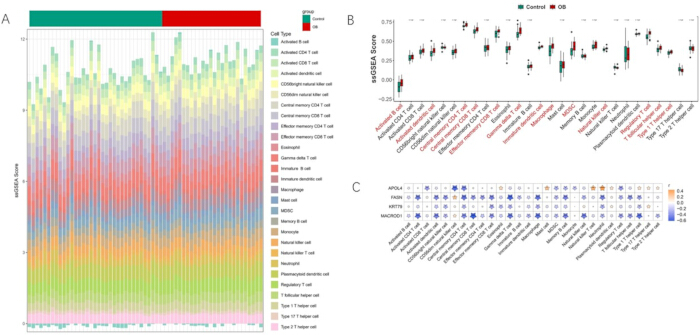
Figure 5: Inferred immune-cell scores in GSE205668. (A) Stacked bar plot of single-sample gene set enrichment analysis (ssGSEA) scores for 28 inferred immune-cell populations. Each bar represents one sample, each colored segment represents one cell population, and the annotation bar above the plot indicates group (green, control, n = 35; red, obesity [OB], n = 26). (B) Boxplots of the 28 inferred immune-cell scores by group (green, control; red, OB). The horizontal axis shows cell populations and the vertical axis shows ssGSEA scores. Boxes show the interquartile range with the median as the center line, whiskers extend to 1.5 times the interquartile range, and points show values beyond the whiskers. Red x-axis labels denote the 13 populations with nominal p < 0.05 in the Wilcoxon rank-sum test, and ns denotes nominal p ≥ 0.05. No multiplicity-adjusted significance is assigned to individual cell populations. (C) Spearman correlations between candidate-gene expression and inferred immune-cell scores. Orange indicates positive and blue indicates negative correlations; color intensity and star size increase with the absolute correlation coefficient (color scale, r from −0.6 to 0.4). Marks within the stars indicate nominal significance without multiplicity adjustment. * denotes nominal p < 0.05, ** denotes nominal p < 0.01, and *** denotes nominal p < 0.001. The immune analyses are exploratory. Please click here to view a larger version of this figure.
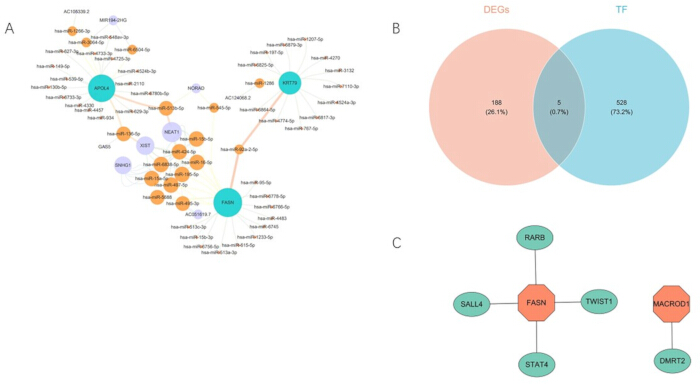
Figure 6: Predicted regulatory networks. (A) Partial lncRNA-miRNA-mRNA network. Green nodes indicate mRNAs, orange nodes indicate miRNAs, and purple nodes indicate lncRNAs. MACROD1 is absent from this panel because no complete regulatory chain meeting the stated intersection criteria was retained. (B) Intersection of predicted transcription factors and the DEG screening list. (C) Transcription-factor and candidate-gene network. The networks are predictive and do not establish regulatory causality. Please click here to view a larger version of this figure.
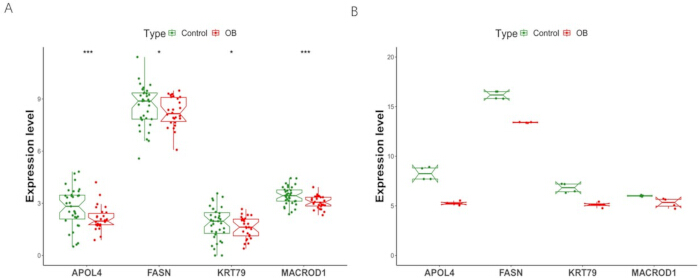
Figure 7: Expression patterns of candidate genes in public datasets. (A) GSE205668 with 35 control and 26 obesity (OB) samples. (B) GSE104815 with 4 control and 4 OB samples. Green denotes control and red denotes OB. Each point represents one sample. Notched boxplots show the median (center line), the interquartile range (box), whiskers extending to 1.5 times the interquartile range, and notches approximating the 95% confidence interval of the median. The vertical axis shows normalized expression values as processed for each dataset. In panel A, group comparisons used the Wilcoxon rank-sum test; * denotes nominal p < 0.05 and *** denotes nominal p < 0.001. GSE104815 is presented descriptively because each group contains four samples, and no inferential significance labels are assigned to panel B. This figure is a public-dataset comparison and is not an independent experimental validation. Please click here to view a larger version of this figure.
Table 1: Characteristics of the two public pediatric adipose tissue datasets. Cohort-level characteristics were taken from the GEO records and source publications9,10. Entries marked as not available indicate variables that were not reported for the analyzed samples. BMI, body mass index; SDS, standard deviation score; GEO, Gene Expression Omnibus. Sample-level clinical variables were not consistently available in the public records. Please click here to download this file.
Supplementary Figure 1: Exploratory coexpression enrichment profiles for the four candidate genes. (A) APOL4. (B) FASN. (C) KRT79. (D) MACROD1. Genes were ranked by Spearman correlation with APOL4, FASN, KRT79, or MACROD1 in GSE205668 before KEGG gene-set enrichment. The curves therefore describe coexpression neighborhoods and are not interpreted as phenotype-based GSEA or direct functional validation. Supplementary File 1 provides NES, nominal p values, adjusted p values, q values, leading-edge summaries, and core-enrichment genes.Please click here to download this file.
Supplementary Table 1: Canonical human tryptophan-metabolism reference genes from KEGG hsa00380. The 40-gene set is supplied for reproducible pathway context and was not used to calculate the exploratory WGCNA score.Please click here to download this file.
Supplementary File 1: Exploratory coexpression enrichment results for APOL4, FASN, KRT79, and MACROD1, including gene-set size, enrichment score, NES, nominal p value, adjusted p value, q value, rank, leading-edge summary, and core-enrichment genes.Please click here to download this file.
讨论
The analysis identifies APOL4, FASN, KRT79, and MACROD1 as exploratory obesity-associated candidates. Their selection arose from an intersection between the shared DEG screening list and WGCNA modules associated with a literature-derived exploratory score. The four genes are not classified as canonical tryptophan-metabolism genes. A canonical KEGG hsa00380 reference set is provided separately in Supplementary Table 1 to clarify pathway membership. Expression of the 40 canonical hsa00380 genes and pathway-level tryptophan-metabolism activity were not compared between obesity and control samples in either dataset. The present results therefore do not show whether canonical tryptophan-metabolism genes differ between groups in pediatric adipose tissue, and the four candidates are interpreted only as obesity-associated transcripts. APOL4 is located at 22q12.3 and has been described in lipid-related and transcriptomic contexts18,19,20. In the present analysis, its relevance is limited to an obesity-associated expression signal that requires independent biological assessment.
FASN is located at 17q25.3 and encodes a central enzyme in de novo fatty-acid synthesis21,22. Previous studies have linked FASN with adipose biology, insulin resistance, inflammation, and several disease models23,24,25,26,27,28,29,30,31,32,33,34,35. FASN expression was lower in obesity samples than in control samples in both public datasets. This pattern is compatible with altered lipid-related transcription in adipose tissue. The available data do not determine whether FASN contributes to obesity development or reflects tissue composition and disease state.
KRT79 is located at 12q13.13, and MACROD1 is located at 11q13.1. KRT79 has been studied in epithelial and sebaceous-gland biology, while MACROD1 has been examined in transcriptional regulation, mitochondrial biology, and tissue injury36,37,38,39,40,41,42,43,44. Both transcripts were lower in obesity samples than in controls. Together with the APOL4 and FASN patterns and the exploratory immune score results, these observations suggest that the four candidates capture several aspects of the adipose transcriptomic state. The data do not support a gene-specific crosstalk mechanism.
The candidate-gene enrichment curves are interpreted as coexpression enrichment. They summarize pathways represented among genes that covary with each candidate transcript. They do not test obesity-associated pathway activation directly. Ribosome, oxidative phosphorylation, lysosome, peroxisome, and chemokine signaling gene-set labels were among those observed in the coexpression enrichment results. The complete list of enriched gene sets is provided in Supplementary File 1.
The immune analysis is based on ssGSEA-derived scores rather than direct cell counts. Thirteen of 28 populations showed nominal group differences, and the direction of change was not uniform. The observed correlations of APOL4 with neutrophil scores and MACROD1 with central memory CD8 T-cell scores remain exploratory. They do not establish regulation of a specific immune population. The regulatory network analyses are likewise predictive and should be interpreted as hypotheses for future testing.
This study has several limitations. GSE104815 contains only 4 samples per group, which limits inferential testing and precludes a reliable diagnostic performance analysis. The DEG and immune score screens used nominal p value thresholds and therefore have an increased false-positive risk. Because the four candidate genes were selected from the unadjusted DEG screen, the candidate list may include false-positive findings, and their differential expression under false discovery rate control remains to be established. WGCNA parameters were not tested in a sensitivity analysis. Canonical tryptophan-metabolism genes were not compared directly between groups. The literature-derived WGCNA score is treated as exploratory because its constituent gene list could not be reconstructed from the retained analysis materials. The canonical KEGG hsa00380 gene set is therefore provided separately as a reproducible pathway reference. Age, sex, pubertal stage, BMI z score, and lipid or glucose covariates were not consistently available across the public records, so a uniform covariate-adjusted cross-dataset analysis was not performed. The study includes no newly collected human samples and no wet-lab experiment. Independent studies with prespecified pathway definitions, multiple-testing control, complete clinical metadata, and experimental confirmation are required.
Future work should proceed in four directions. First, the differential expression and immune-score screens should be repeated with false discovery rate control, and the canonical KEGG hsa00380 gene set should be scored directly, in larger pediatric adipose tissue cohorts that provide age, sex, pubertal stage, and BMI SDS for covariate adjustment. Second, APOL4, FASN, KRT79, and MACROD1 expression should be measured by reverse transcription quantitative polymerase chain reaction (RT-qPCR) and at the protein level in independently collected pediatric adipose tissue, with separation of adipocytes and stromal vascular cells or single-nucleus RNA sequencing to identify the cell types that express them. Third, paired measurement of tryptophan, kynurenine, and related metabolites in serum and adipose tissue would test whether candidate-gene expression tracks tryptophan metabolism in the same children. Fourth, gain- and loss-of-function experiments in human preadipocyte models, together with reporter and chromatin immunoprecipitation assays for the predicted miRNA and transcription-factor interactions, would test the mechanistic hypotheses generated here.
披露
All authors declare that they have no conflicts of interest, financial or otherwise, that could be perceived as prejudicing the impartiality of the research reported in this manuscript.
Author's Contributions:
Aimei Miao contributed to conceptualization and methodology, performed the formal analysis, developed the software, and prepared the original draft. Lei Xu contributed to data curation, validation, visualization, and investigation and prepared the original draft. Biying Chen performed the investigation, validation, and formal analysis. Fan Su contributed to software, data curation, and visualization. Jingxia Yang contributed to methodology, provided resources, and reviewed and edited the manuscript. Zhenglan Li contributed to investigation and data curation. Shiqin Li performed validation and prepared the visualizations. Junjun Du performed the formal analysis and reviewed and edited the manuscript. Chenlin Ji contributed to conceptualization, provided resources, supervised and administered the project, acquired funding, and reviewed and edited the manuscript.
致谢
This work was supported by the Suzhou Medical Innovation Research Project Foundation (grant no. SKYD2022137).
材料
| 姓名 | 公司 | 目录编号 | 评论 |
|---|---|---|---|
| Gene Expression Omnibus | NCBI | GSE205668, GPL16791 | Pediatric subcutaneous adipose tissue RNA sequencing dataset |
| Gene Expression Omnibus | NCBI | GSE104815, GPL21827 | Pediatric abdominal subcutaneous adipose tissue microarray dataset |
| R | R Foundation for Statistical Computing | Software environment, version 4.3.0 | Statistical computing and all R-based analyses |
| DESeq2 | Bioconductor | R package, version 1.40 (Bioconductor 3.17) | Differential expression analysis for GSE205668 |
| limma | Bioconductor | R package, version 3.56 (Bioconductor 3.17) | Differential expression analysis for GSE104815 |
| WGCNA | R package | R package, version 1.72-5 (CRAN) | Weighted gene coexpression network analysis |
| GSVA | R package | R package, version 1.48 (Bioconductor 3.17) | Single sample gene set enrichment scoring |
| clusterProfiler | Bioconductor | R package, version 4.8 (Bioconductor 3.17) | Functional annotation and coexpression enrichment analysis |
| ggVennDiagram | R package | R package, version 1.5.2 (CRAN) | Venn diagram visualization |
| Cytoscape | Cytoscape Consortium | Software | Regulatory network visualization |
| NCBI Gene | NCBI | Web resource | Verification of the chromosomal locations of the candidate genes |
| DIANA microT-CDS | DIANA Lab | Web resource | miRNA target prediction |
| miRDB | Public database | Web resource | miRNA target prediction |
| starBase | Public database | Web resource | lncRNA and miRNA interaction prediction |
| ChEA3 | Ma’ayan Laboratory | Web resource | Transcription factor prediction |
| MSigDB | Broad Institute | c2.kegg.v7.4.symbols | KEGG gene sets used for exploratory coexpression enrichment |
| KEGG | Kyoto Encyclopedia of Genes and Genomes | hsa00380 | Canonical human tryptophan metabolism reference set |
参考文献
- Suzuki Y et al. Associations among amino acid, lipid, and glucose metabolic profiles in childhood obesity. BMC Pediatr. 2019;19(1):273.
- Feng X et al. Integrative analysis of exosomal miR-452 and miR-4713 downregulating NPY1R for the prevention of childhood obesity. Dis Markers. 2022;2022:2843353.
- Boden G. Obesity, insulin resistance and free fatty acids. Curr Opin Endocrinol Diabetes Obes. 2011;18(2):139–43.
- Luo M et al. Neighbourhood speed limit and childhood obesity. Obes Rev. 2021;22(Suppl 1):e13052.
- Jia P et al. Fast-food restaurant, unhealthy eating, and childhood obesity: a systematic review and meta-analysis. Obes Rev. 2021;22(Suppl 1):e12944.
- Giles LC et al. Growth trajectories in early childhood, their relationship with antenatal and postnatal factors, and development of obesity by age 9 years: results from an Australian birth cohort study. Int J Obes (Lond). 2015;39(7):1049–56.
- Lischka J et al. Tryptophan metabolism is associated with BMI and adipose tissue mass and linked to metabolic disease in pediatric obesity. Nutrients. 2022;14(2):286.
- De Spiegeleer M et al. Paediatric obesity: a systematic review and pathway mapping of metabolic alterations underlying early disease processes. Mol Med. 2021;27(1):145.
- Yang CH et al. Independent phenotypic plasticity axes define distinct obesity sub-types. Nat Metab. 2022;4(9):1150–65.
- Liu Y et al. Integrated analysis of long noncoding RNA and mRNA expression profile in children with obesity by microarray analysis. Sci Rep. 2018;8(1):8750.
- Love MI, Huber W, Anders S. Moderated estimation of fold change and dispersion for RNA-seq data with DESeq2. Genome Biol. 2014;15(12):550.
- Ritchie ME et al. limma powers differential expression analyses for RNA-sequencing and microarray studies. Nucleic Acids Res. 2015;43(7):e47.
- Gao CH, Yu G, Cai P. ggVennDiagram: an intuitive, easy-to-use, and highly customizable R package to generate Venn diagram. Front Genet. 2021;12:706907.
- Yu G, Wang LG, Han Y, He QY. clusterProfiler: an R package for comparing biological themes among gene clusters. OMICS. 2012;16(5):284–7.
- Langfelder P, Horvath S. WGCNA: an R package for weighted correlation network analysis. BMC Bioinformatics. 2008;9:559.
- Hänzelmann S, Castelo R, Guinney J. GSVA: gene set variation analysis for microarray and RNA-seq data. BMC Bioinformatics. 2013;14:7.
- Shannon P et al. Cytoscape: a software environment for integrated models of biomolecular interaction networks. Genome Res. 2003;13(11):2498–504.
- Monajemi H, Fontijn RD, Pannekoek H, Horrevoets AJG. The apolipoprotein L gene cluster has emerged recently in evolution and is expressed in human vascular tissue. Genomics. 2002;79(4):539–46.
- Wang Z, Wang F. Identification of ten-gene related to lipid metabolism for predicting overall survival of breast invasive carcinoma. Contrast Media Mol Imaging. 2022;2022:8348780.
- Zhu H et al. APOL4, a novel immune-related prognostic biomarker for glioma. J Clin Med. 2022;11(19):5765.
- Pitel F et al. Mapping of FASN and ACACA on two chicken microchromosomes disrupts the human 17q syntenic group well conserved in mammals. Mamm Genome. 1998;9(4):297–300.
- Reho JJ, Rahmouni K. Oxidative and inflammatory signals in obesity-associated vascular abnormalities. Clin Sci (Lond). 2017;131(14):1689–700.
- Wallace M et al. Enzyme promiscuity drives branched-chain fatty acid synthesis in adipose tissues. Nat Chem Biol. 2018;14(11):1021–31.
- Ramgopal M, Kruthika BS, Surekha D, Meriga B. Terminalia paniculata bark extract attenuates non-alcoholic fatty liver via down regulation of fatty acid synthase in high fat diet-fed obese rats. Lipids Health Dis. 2014;13:58.
- Menendez JA, Vazquez-Martin A, Ortega FJ, Fernandez-Real JM. Fatty acid synthase: association with insulin resistance, type 2 diabetes, and cancer. Clin Chem. 2009;55(3):425–38.
- Angeles TS, Hudkins RL. Recent advances in targeting the fatty acid biosynthetic pathway using fatty acid synthase inhibitors. Expert Opin Drug Discov. 2016;11(12):1187–99.
- Berndt J et al. Fatty acid synthase gene expression in human adipose tissue: association with obesity and type 2 diabetes. Diabetologia. 2007;50(7):1472–80.
- Papaevangelou E et al. The effect of FASN inhibition on the growth and metabolism of a cisplatin-resistant ovarian carcinoma model. Int J Cancer. 2018;143(4):992–1002.
- Gu C et al. Dihydroartemisinin ameliorates retinal vascular dysfunction in diabetes mellitus via the FASN/Kmal-mTOR/SREBP1 feedback loop. Pharmacol Res. 2021;174:105871.
- Gao XL et al. Upregulation of microRNA-335-5p reduces inflammatory responses by inhibiting FASN through the activation of AMPK/ULK1 signaling pathway in a septic mouse model. Cytokine. 2018;110:466–78.
- Plataki M et al. Fatty acid synthase downregulation contributes to acute lung injury in murine diet-induced obesity. JCI Insight. 2019;4(15):e127823.
- Singh N et al. Inhibition of fatty acid synthase is protective in pulmonary hypertension. Br J Pharmacol. 2016;173(12):2030–45.
- Singh N et al. Fatty acid synthase modulates proliferation, metabolic functions and angiogenesis in hypoxic pulmonary artery endothelial cells. Eur J Pharmacol. 2017;815:462–9.
- Wu Z et al. Inhibition of fatty acid synthase protects obese mice from acute lung injury via ameliorating lung endothelial dysfunction. Respir Res. 2023;24(1):81.
- Schleinitz D et al. Effect of genetic variation in the human fatty acid synthase gene (FASN) on obesity and fat depot-specific mRNA expression. Obesity (Silver Spring). 2010;18(6):1218–25.
- Veniaminova NA et al. Keratin 79 identifies a novel population of migratory epithelial cells that initiates hair canal morphogenesis and regeneration. Development. 2013;140(24):4870–80.
- Bortoletto E et al. Meta-analysis of keratoconus transcriptomic data revealed altered RNA editing levels impacting keratin genomic clusters. Invest Ophthalmol Vis Sci. 2023;64(7):12.
- Veniaminova NA et al. Niche-specific factors dynamically regulate sebaceous gland stem cells in the skin. Dev Cell. 2019;51(3):326–40.e4.
- Chen B et al. Screening and identification of prognostic tumor-infiltrating immune cells and genes of endometrioid endometrial adenocarcinoma: based on The Cancer Genome Atlas database and bioinformatics. Front Oncol. 2020;10:554214.
- Kim D, Choi I, Ha SK, Gonzalez FJ. Keratin 79 is a PPARA target that is highly expressed by liver damage. Biochem Biophys Res Commun. 2023;650:132–6.
- Han WD et al. Estrogenically regulated LRP16 interacts with estrogen receptor alpha and enhances the receptor's transcriptional activity. Endocr Relat Cancer. 2007;14(3):741–53.
- Wu Z et al. LRP16 integrates into NF-kappaB transcriptional complex and is required for its functional activation. PLoS One. 2011;6(3):e18157.
- Agnew T et al. MacroD1 is a promiscuous ADP-ribosyl hydrolase localized to mitochondria. Front Microbiol. 2018;9:20.
- Zhu YX et al. Screening of key biomarkers of tendinopathy based on bioinformatics and machine learning algorithms. PLoS One. 2021;16(10):e0259475.