This study compared extended preoperative ceftriaxone prophylaxis with a single dose in 252 patients undergoing ureteral lithotripsy with negative urine cultures. Extended prophylaxis was associated with lower inflammatory markers and fewer infection-related symptoms. However, confirmed infection prevention and safety remain unproven; these exploratory findings do not support routine prolonged prophylaxis.
研究文章
Extended Ceftriaxone Prophylaxis and Postoperative Inflammation and Infection-Related Symptoms After Ureteral Lithotripsy with Negative Urine Cultures
本文内容
摘要
摘要
Postoperative inflammatory and infection-related manifestations can occur after rigid ureteroscopic lithotripsy (RUL), including in patients with negative preoperative urine cultures. Whether extending prophylaxis improves outcomes for clinically confirmed infections remains uncertain. To explore differences in postoperative inflammatory markers and infection-related manifestations between an extended preoperative ceftriaxone regimen and a single prophylactic dose in culture-negative patients undergoing RUL. This single-center exploratory study included 252 analyzed patients and was reported as randomized. The extended-regimen group (n = 122) received ceftriaxone at 2 g intravenously every 12 h for 3–7 days before surgery; the single-dose group (n = 130) received 2 g intravenously 30–60 min before surgery. No prospective sample size or power calculation was performed. WBC, NEUT%, CRP, and PCT were assessed preoperatively and on postoperative days 1 and 3. Exploratory, unadjusted time-specific comparisons were calculated from the reported summary statistics; these do not constitute a longitudinal repeated-measures analysis. Clinical manifestations, surgical complications, and discharge SF-36 scores were also summarized. Postoperative mean WBC, NEUT%, CRP, and PCT values were lower in the extended-regimen group on days 1 and 3 (all unadjusted, summary-based p < 0.001). Preoperative WBC also differed (p = 0.040), and stone diameter differed between groups (p = 0.025). The reported symptom composite occurred in 20/122 patients (16.4%) and 39/130 patients (30.0%), respectively (two-sided Fisher's exact p = 0.012). Group-specific confirmed-infection rates were not reported. Selected SF-36 domain scores were higher at discharge. Numerical longitudinal-model outputs and ceftriaxone-related adverse-event frequencies were not reported. Extended ceftriaxone prophylaxis was associated with lower postoperative inflammatory-marker values and fewer reported infection-related manifestations. These exploratory findings do not establish prevention of confirmed postoperative infection, equivalent ceftriaxone safety, or a basis for recommending routine prolonged prophylaxis. Confirmatory studies with prespecified analyses, verified infectious endpoints, and complete safety reporting are needed.
引言
Ureteral calculi are a frequent urological problem, and urolithiasis represents a substantial global disease burden1,2,3. Stones may cause pain, obstruction, infection, and impaired renal function4. Rigid ureteroscopic lithotripsy (RUL) provides endoscopic access for fragmentation and removal of ureteral stones5,6. Postoperative inflammatory manifestations and infectious complications can nevertheless occur, including in patients with negative preoperative urine cultures7,8,9,10. Distinguishing symptoms caused by instrumentation or stent irritation from clinically established infection is essential when evaluating prophylaxis11,12.
A negative midstream urine culture does not establish that all potential microbial reservoirs are absent13,14,15. However, postoperative WBC, CRP, PCT, fever, and urinary symptoms are not, by themselves, proof of bacterial infection16,17,18,19. This study did not report stone cultures, molecular microbiology, or systematically adjudicated infection outcomes. Any suggestion that extended prophylaxis suppresses stone-associated microorganisms, therefore, remains a hypothesis rather than a demonstrated mechanism.
The European Association of Urology guidance supports perioperative prophylaxis for endourological treatment and notes that a single prophylactic dose before ureteroscopy is sufficient20. Evidence from other stone procedures and higher-risk populations should not be transferred directly to culture-negative RUL21,22,23,24. Prolonged exposure also raises antimicrobial-stewardship concerns25,26,27,28,29. This exploratory study compares extended ceftriaxone prophylaxis with a single preoperative dose, focusing on inflammatory-marker summaries and infection-related manifestations rather than assuming a reduction in confirmed infection.
方案
This single-center exploratory study was conducted from January through December 2024 following approval by the Hospital Ethics Committee of the First Affiliated Hospital of Anhui University of Chinese Medicine (Ethics Review Approval No. 2023XJS-WK15). No prospective sample size or power calculation was performed. The available cohort was analyzed without a prespecified power target; consequently, nonsignificant findings cannot establish equivalence or rule out clinically important differences, particularly for uncommon infections and adverse events30. All the materials are listed in the Table of Materials. A schematic of the study is given in Figure 1.
Study design and patient population
The study was reported as a single-center randomized comparison at a tertiary-care hospital from January through December 2024. The analyzed population comprised 252 participants: 122 in the extended-regimen group and 130 in the single-dose group (Figure 2). The extended regimen was ceftriaxone 2 g intravenously every 12 h for 3–7 days before surgery, and the comparator was a single 2 g preoperative intravenous dose. Written informed consent was obtained before enrolment. The study and its conclusions are considered exploratory.
Inclusion and exclusion criteria
Inclusion criteria:
Eligibility required an age of 18–70 years and radiological confirmation of ureteral calculi by ultrasound, plain radiography, computed tomography (CT), or another appropriate imaging method. The stone diameter had to be 2.0 cm or less. Participants also had to have a sterile midstream urine culture and normal urinalysis, defined as no bacterial growth and a urinary white blood cell count of ≤5 per high-power field. To limit confounding, anyone who had taken antibiotics within the preceding two weeks was not eligible. Patients were required to be clinically stable, without severe cardiac, hepatic, or renal dysfunction. Procedures had to be performed by an attending physician or a more senior surgeon, and only records with complete, accessible clinical information were analyzed.
Exclusion criteria:
Known hypersensitivity to ceftriaxone was an exclusion criterion
The final analyzed group sizes were 122 and 130. These are analysis denominators and do not, by themselves, establish the numbers initially randomized, the intended allocation ratio, or the absence of post-randomization exclusions or loss to follow-up31.
Randomization and group assignment
The reported allocation method used an electronically generated random sequence and sealed, opaque envelopes. Participants and treating clinicians could not be blinded because treatment duration was apparent. Outcome assessors and statisticians were reported to be unaware of treatment allocation. The analyzed groups comprised 122 extended-regimen and 130 single-dose participants.
Baseline data collection
Before treatment, baseline information was collected for all participants so that the two groups could be characterized and compared. Recorded demographic variables included age, sex, and body mass index (BMI). Stone characteristics comprised location, size, number, and computed tomography (CT) value, while medical history included hypertension, diabetes mellitus, and other relevant comorbidities. Preoperative testing consisted of a complete blood count, hepatic and renal function tests, serum electrolytes, a coagulation profile, and inflammatory biomarkers, including C-reactive protein (CRP) and procalcitonin (PCT).
Patient demographics and clinical characteristics
The analysis included 252 patients, with 122 in the extended-regimen group and 130 in the single-dose group. Demographic and stone-related characteristics are summarized in Table 1. All displayed sex, stone-location, and stone-number category counts sum to the corresponding group denominator. Summary-based comparisons indicate a difference in stone diameter; therefore, baseline balance is not assumed.
Therapeutic methods
Preoperative examinations and patient preparation
Each participant underwent a preoperative assessment to confirm suitability for RUL and identify perioperative risks. This evaluation included medical history, physical examination, and routine laboratory testing. The laboratory workup comprised complete blood count, urinalysis, urine culture, renal function testing, and coagulation studies. Non-contrast CT or urinary-system ultrasound was used to define stone location, dimensions, number, and density, and to assess the upper urinary tract. Patients with a positive urine culture or clinical evidence of urinary tract infection were not enrolled, so all participants entered surgery with negative preoperative cultures. Baseline white blood cell count (WBC), neutrophil percentage (NEUT%), C-reactive protein (CRP), and procalcitonin (PCT) were obtained before the procedure. Standard preparation was completed before surgery. Patients fasted for at least 6 h, underwent routine skin preparation, and had vital signs monitored. Hypertension, diabetes mellitus, and other underlying conditions were stabilized as needed. The procedure and its potential complications were explained to participants, and written informed consent was obtained before study enrollment.
Surgical procedure
RUL was carried out according to the same operative protocol in both groups. Depending on anesthetic assessment and clinical status, patients underwent either general anesthesia or combined spinal-epidural anesthesia and were placed in the lithotomy position. After sterile preparation and draping, a guidewire was passed cystoscopically from the urethra into the ureter. A Wolf 8/9.8 Fr rigid ureteroscope was then advanced over the guidewire to the calculus. Instrument selection was guided by stone size and location. Once the stone was visualized, holmium: YAG laser lithotripsy was used for fragmentation, with laser settings typically adjusted to 8–10 W power and 10–15 Hz frequency. Continuous irrigation with warm saline was used throughout the procedure to maintain a clear surgical field and facilitate visualization. Stones fragmented into pieces ≤2 mm were allowed to pass spontaneously with irrigation, whereas fragments larger than 2 mm were carefully removed using stone retrieval baskets to ensure effective clearance. At the completion of lithotripsy, the ureter was inspected for any mucosal injury or residual fragments. A 5 Fr double-J ureteral stent was routinely inserted in all patients to ensure adequate ureteral drainage and prevent postoperative obstruction. The stent was typically removed 3–7 days after surgery, depending on the patient's recovery and clinical condition. To minimize operator-related variability and maintain consistency in surgical outcomes, all procedures were performed by a team of experienced urologists with more than five years of clinical experience in endourological surgery.
Ceftriaxone regimens and postoperative care
Preoperative ceftriaxone prophylaxis
The extended-regimen group received ceftriaxone, a cephalosporin antibiotic, at 2 g intravenously every 12 h for 3–7 days before RUL. The regimen, therefore, encompassed different durations of preoperative exposure rather than one fixed treatment duration. The single-dose group received 2 g of ceftriaxone intravenously 30–60 min before RUL. The comparison was between the reported durations of prophylaxis; the comparison does not establish the comparative effectiveness of individual antibiotic agents or classes.
Postoperative care
All patients received standard supportive care, including hydration, pain relief, and monitoring of vital signs. On the first postoperative day, patients were encouraged to ambulate early. Patients were also advised to increase fluid intake to approximately 2000–3000 mL per day, unless contraindicated. This measure was intended to facilitate the passage of stone fragments.
Outcome measures
Primary outcome measures
The primary reported outcomes were WBC, NEUT%, CRP, and PCT before surgery and on postoperative days 1 and 3, together with postoperative fever, chills, urinary frequency, urgency, and dysuria. The symptom composite was defined as at least one of these manifestations, with each affected participant intended to be counted once. This endpoint is distinct from confirmed infection.
Secondary outcome measures
Secondary outcomes included operative time, postoperative hospital stay, double-J stent duration, surgical complications, 1-month stone-clearance status, and SF-36 scores at discharge. Numerical results are reported here only for surgical complications and discharge SF-36 scores; the other prespecified secondary outcomes were not reported by treatment group. Repeated measurements within each participant require a longitudinal analysis that accounts for within-participant correlation32,33. Numerical group, time, and group-by-time statistics and multiplicity-adjusted pairwise comparisons are not reported here. Accordingly, time-specific summaries are interpreted as exploratory comparisons and do not establish a differential longitudinal treatment effect.
Statistical analysis and data handling
Continuous variables are presented as mean ± SD and categorical variables as n (%). For exploratory summary-based comparisons, two-sided Welch t tests were calculated from the displayed means, SDs, and stated group sizes34; these p-values are approximate because the input summaries are rounded. Two-sided Fisher exact tests were calculated from the displayed 2 × 2 counts35; stone location used a Pearson chi-square test without continuity correction. P-values are unadjusted for multiplicity and are interpreted descriptively in this exploratory study36,37. These calculations do not replace participant-level longitudinal modeling or establish the number of observed measurements at each visit. The reported multivariable logistic regression estimates are retained separately as exploratory associations with the symptom composite. No longitudinal-model statistics, adjusted pairwise results, or numerical collinearity diagnostics are inferred from aggregate summaries.
Primary observation indicators
Inflammatory marker monitoring
Venous blood samples were reported to have been collected before surgery and on postoperative days 1 and 3 for WBC, NEUT%, CRP, and PCT measurement. Laboratory analyses were performed in the same laboratory using standardized procedures. These measurements characterize systemic inflammation; postoperative elevations are not specific for bacterial infection16,17,18,19.
Infection-related symptoms
Postoperative manifestations included fever (temperature ≥38.0°C), chills, urinary frequency, urgency, and dysuria. Fever duration and peak temperature were recorded. For interpretation, microbiologically confirmed postoperative infection requires a compatible postoperative clinical syndrome together with a clinically significant positive urine, blood, or other relevant culture. A clinically diagnosed, culture-negative infection requires separate documented diagnostic adjudication. Neither isolated symptoms, inflammatory-marker elevations, nor SIRS alone constitutes confirmed infection38. The symptom composite, therefore, cannot be used as a confirmed-infection rate. The reported SIRS definition required at least two of the following: temperature >38°C or <36°C; heart rate >90/min; respiratory rate >20/min or PaCO₂ <32 mmHg; or WBC >12 × 109/L, <4 × 10⁹/L, or >10% band forms39. Group-specific SIRS and confirmed-infection incidences were not reported.
Secondary observation indicators
Surgical parameters
Operative and recovery variables were recorded in a standardized manner. Operative time was measured from the introduction of the ureteroscope until completion of the procedure. Postoperative length of stay was the number of days from surgery until hospital discharge. Double-J stent duration was calculated from placement at surgery to subsequent removal. These measures were used to compare procedural efficiency and recovery between the two treatment arms.
Complication assessment
Reported surgical and urological complications comprised hemorrhage, ureteral perforation, urinary obstruction, and double-J stent-related symptoms. These events were analyzed separately from ceftriaxone-related harms. Group-specific frequencies of allergic reactions, gastrointestinal events, hepatic or renal abnormalities, and Clostridioides difficile-associated events were not reported. The absence of these data from the results must not be interpreted as zero events or equivalent drug safety40.
Stone clearance rate
Stone clearance was scheduled for assessment one month after surgery using ultrasound or plain radiography. The stated complete-clearance category comprised no residual stone or only asymptomatic fragments ≤2 mm. Partial clearance comprised asymptomatic fragments >2 mm and ≤4 mm; failure comprised fragments >4 mm or symptomatic residual stones requiring further intervention. Treatment-group counts for these categories were not reported.
Quality of Life (QoL) assessment
Health-related quality of life was reported to have been assessed with the SF-3641, before surgery and at discharge. The eight domains were physical functioning, role-physical, bodily pain, general health, vitality, social functioning, role-emotional, and mental health42. Only discharge scores are tabulated; baseline-adjusted change cannot be assessed from the reported results.
结果
Baseline characteristics and availability of secondary outcomes
Table 1 summarizes baseline characteristics for 122 extended-regimen and 130 single-dose participants. The displayed category counts are consistent with these denominators. The mean stone diameter was 0.8 ± 0.3 cm versus 0.9 ± 0.4 cm (approximate unadjusted Welch P = 0.025); other displayed baseline comparisons had p ≥ 0.05. These comparisons do not establish clinical equivalence or exclude residual imbalance. Postoperative hospital stay, actual double-J stent duration, operative-time summaries, and 1-month stone-clearance counts were not reported by the group. Figure 3 displays baseline characteristics using the same group summaries as Table 1. Continuous values are shown as mean ± SD and categorical values as patient counts. Table 1 identifies the exploratory summary-based statistical comparisons.
Comparison of postoperative inflammatory markers between groups
Before surgery, WBC was 6.1 ± 1.2 × 10⁹/L in the extended-regimen group and 6.4 ± 1.1 × 10⁹/L in the single-dose group (approximate unadjusted Welch p = 0.040). Preoperative NEUT%, CRP, and PCT comparisons had p = 0.296, 0.527, and 1.000, respectively (Table 2). Thus, the claim that all preoperative inflammatory markers were comparable is not supported by the displayed summaries. On postoperative days 1 and 3, all four mean marker values were lower in the extended-regimen group (all unadjusted summary-based p < 0.001; Tables 3 and 4). Figures 4–6 display the marker summaries at each time point. Both groups had higher postoperative mean values than preoperative values, followed by lower means on day 3 than on day 1. These descriptive patterns do not establish a faster recovery trajectory because numerical group-by-time results and adjusted longitudinal contrasts are not reported. The reported percentage-change summaries are presented in Table 5 and Figures 7 and 8. These values are retained as descriptive summaries of individual percentage change; the percentage changes cannot be reconstructed or validated from ratios of rounded group means. No longitudinal or adjusted p-values are assigned to these summaries.
Comparison of postoperative infection-related symptoms between groups
The reported symptom composite occurred in 20/122 extended-regimen participants (16.4%) and 39/130 single-dose participants (30.0%; two-sided Fisher exact p = 0.012). Fever occurred in 7/122 (5.7%) versus 13/130 (10.0%; p = 0.249), and chills in 5/122 (4.1%) versus 9/130 (6.9%; P = 0.414). Urinary frequency occurred in 2/122 (1.6%) versus 6/130 (4.6%; p = 0.283), urgency in 2/122 (1.6%) versus 5/130 (3.8%; p = 0.448), and dysuria in 4/122 (3.3%) versus 6/130 (4.6%; p = 0.750). These are unadjusted comparisons of manifestations rather than confirmed infections (Table 6; Figure 9). No pooled urinary-symptom test is reported because patient-level overlap among symptoms is not available.
Comparison of postoperative complications between groups
The reported overall surgical-complication counts were 13/122 (10.7%) and 19/130 (14.6%) in the extended-regimen and single-dose groups. Exploratory Fisher exact comparisons did not show statistically significant differences for the reported surgical outcomes (Table 7; Figure 10). These findings neither establish equivalence nor characterize ceftriaxone-related safety. Exact group-specific frequencies of allergic, gastrointestinal, hepatic, renal, and C. difficile-associated events were not reported. Reported overall counts are interpreted as participant-level totals; event overlap cannot be established from the category summaries alone. Numerical variance inflation factors (VIFs) and tolerance values were not reported, so the absence of problematic multicollinearity cannot be established from Table 843.
Analysis of risk factors for postoperative infection-related manifestations
The reported multivariable model concerned infection-related manifestations rather than microbiologically confirmed infection (Table 8). The model included age ≥60 years, diabetes mellitus, stone CT value ≥1000 HU, operative duration ≥60 min, and single-dose ceftriaxone prophylaxis. Separate univariable results were not reported. Reported adjusted odds ratios were 2.35 (95% CI 1.26–4.36) for age ≥60 years, 2.81 (1.43–5.56) for diabetes, 1.92 (1.06–3.52) for stone CT value ≥1000 HU, 2.46 (1.28–4.67) for operative duration ≥60 min, and 2.63 (1.36–5.03) for single-dose ceftriaxone prophylaxis. Table 8 presents the reported coefficients, standard errors, Wald statistics, odds ratios, confidence intervals, and P-values. The model estimates have not been reconstructed from patient-level data. These exploratory associations do not establish causation or identify a subgroup in which extended prophylaxis is effective44. In particular, an association between regimen and symptoms does not prove that a prolonged course prevents confirmed infection. No treatment-by-risk-factor interaction analysis is reported.
Comparison of the quality of life between groups
SF-36 discharge scores are shown in Table 9 and Figure 11. Approximate unadjusted Welch p-values from the displayed summaries were physical functioning, 0.166; role-physical, 0.238; bodily pain, <0.001; general health, <0.001; vitality, <0.001; social functioning, <0.001; role-emotional, 0.170; mental health, 0.070. Mean scores were higher in the extended-regimen group for bodily pain, general health, vitality, and social functioning. These comparisons are exploratory. The extended-regimen group had higher scores in selected SF-36 domains at discharge. Baseline SF-36 values, baseline-adjusted comparisons, multiplicity-adjusted results, and a prespecified clinically important difference were not reported. These findings therefore describe exploratory between-group differences at discharge and do not demonstrate improvement from baseline or a direct ceftriaxone effect45.
DATA AVAILABILITY:
The raw data that support the findings of this study are publicly available in the form of a supplementary compressed folder called “Rawdata.rar”. Please click here to download this file.
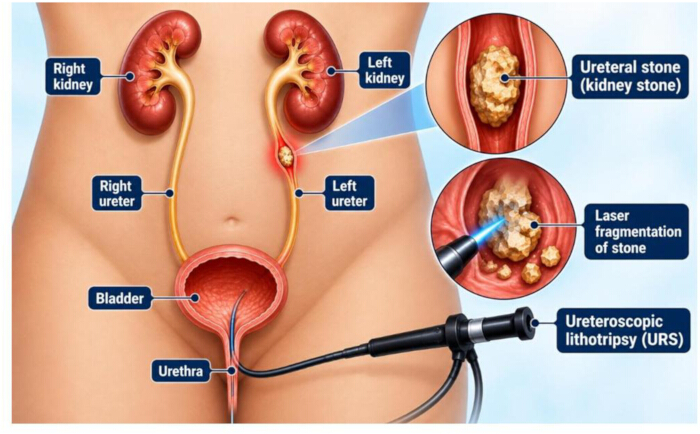
Figure 1: Schematic diagram. Schematic overview of ureteroscopic access to the ureter and renal pelvis for stone visualization and laser fragmentation. Figure 1 is an original anatomical schematic created by the authors using Canva Pro. Please click here to view a larger version of this figure.
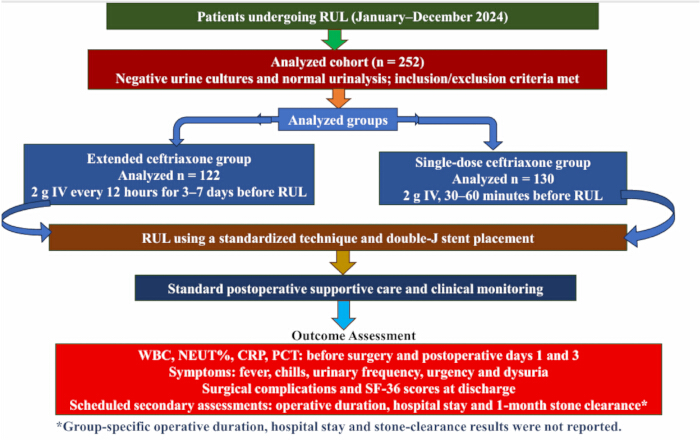
Figure 2: Overview of the ceftriaxone prophylaxis regimens and assessment schedule. The displayed n = 122 and n = 130 are the counts for the analyzed groups. This overview does not establish initial randomization counts or the absence of attrition. Figure 2 is an original study regimen diagram created using Microsoft PowerPoint, version 2019. Abbreviations: RUL = rigid ureteroscopic lithotripsy. Please click here to view a larger version of this figure.
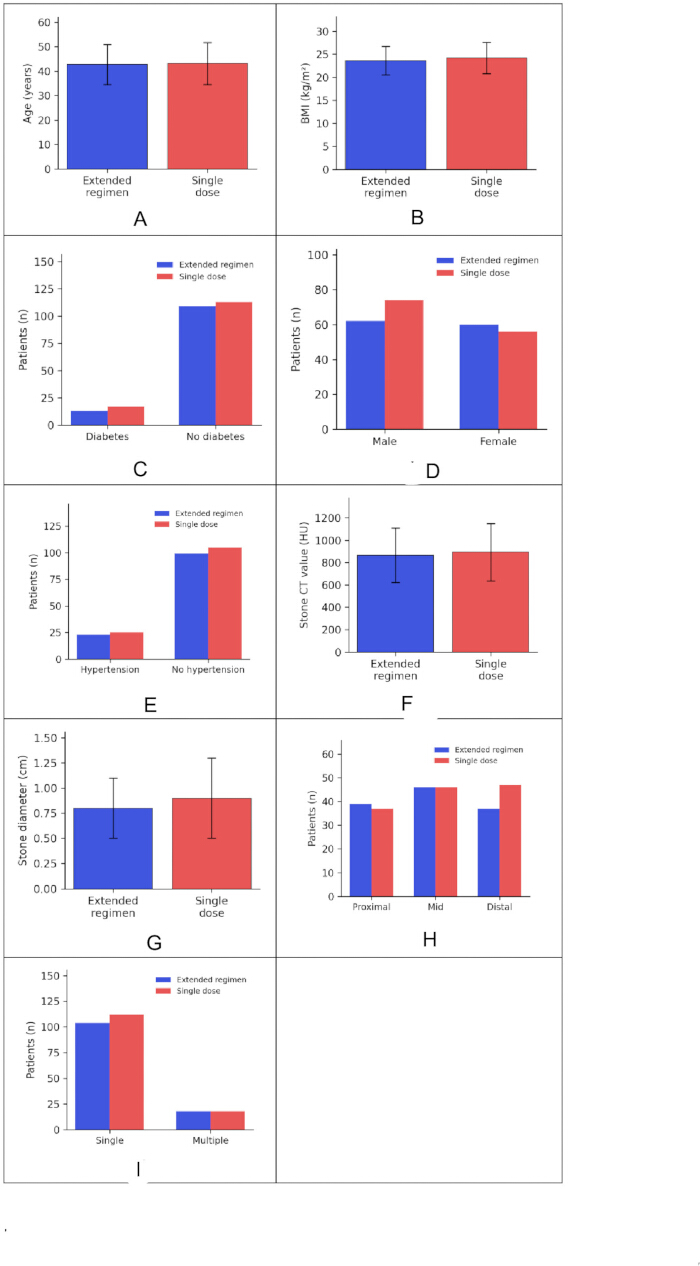
Figure 3: Baseline characteristics of the ceftriaxone groups. (A) Age, (B) BMI, (C) Diabetes, (D) Sex, (E) Hypertension, (F) Stone CT value, (G) Stone diameter, (H) Stone location, and (I) Stone number. Continuous variables are mean ± SD; categorical panels display patient counts. Group summaries match Table 1. Statistical comparisons are exploratory summary-based checks reported in Table 1. Figures 3–11 were generated by the authors from this study’s data using GraphPad Prism 9.3.1. The authors confirm that these figures contain no previously published images, adapted panels, or third-party icons. Please click here to view a larger version of this figure.
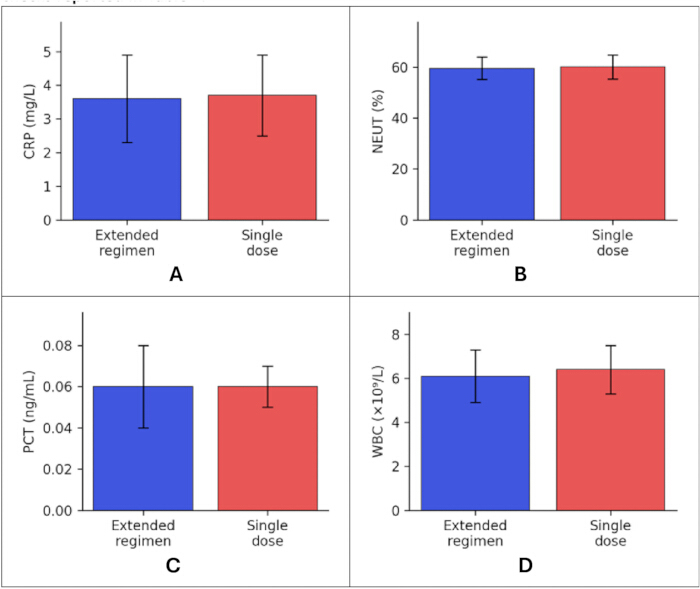
Figure 4: Preoperative levels. (A) CRP, (B) NEUT%, (C) PCT, and (D) WBC. Bars show mean ± SD for the extended-regimen (n = 122) and single-dose (n = 130) ceftriaxone groups. Panel order and plotted values match Table 2. Approximate unadjusted time-specific p-values are reported in Table 2; these are not longitudinal-model results. Please click here to view a larger version of this figure.
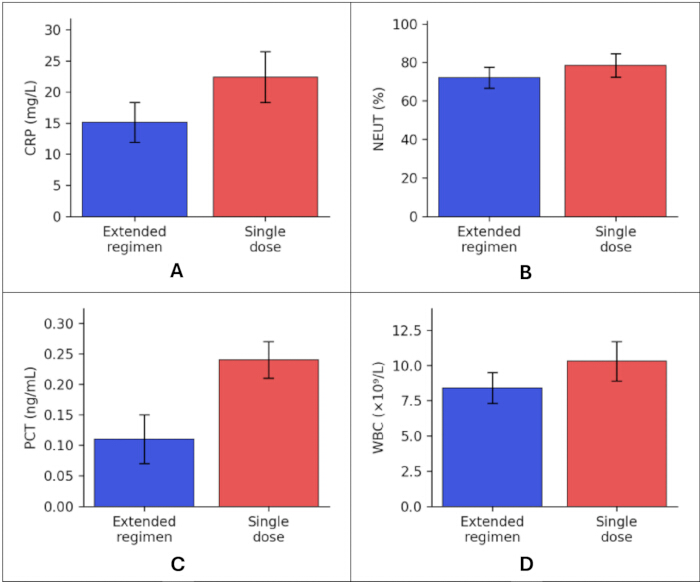
Figure 5: Postoperative day-1 levels. (A) CRP, (B) NEUT%, (C) PCT, and (D) WBC. Bars show the ceftriaxone group mean ± SD, as reported in Table 3. Time-specific comparisons in Table 3 are approximate and unadjusted. No group, time, group-by-time, or adjusted pairwise model statistics are represented. Please click here to view a larger version of this figure.
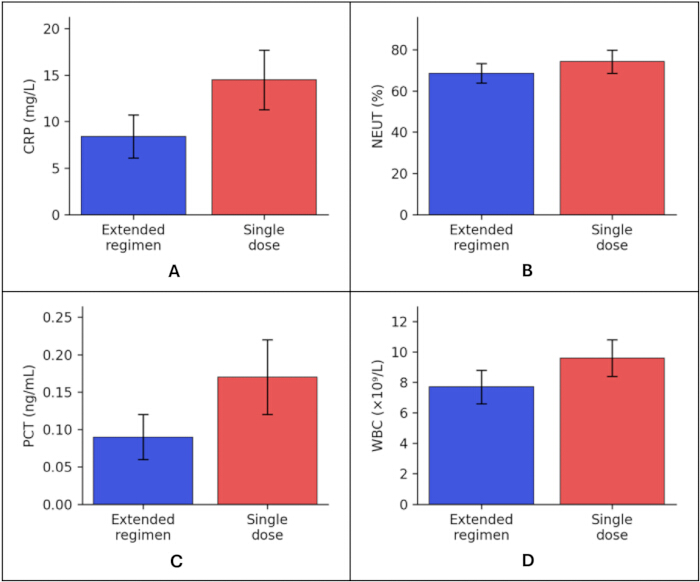
Figure 6: Postoperative day-3 levels. (A) CRP, (B) NEUT%, (C) PCT, and (D) WBC. Bars show the ceftriaxone group mean ± SD, as reported in Table 4. Time-specific comparisons in Table 4 are approximate and unadjusted. No group, time, group-by-time, or adjusted pairwise model statistics are represented. Please click here to view a larger version of this figure.
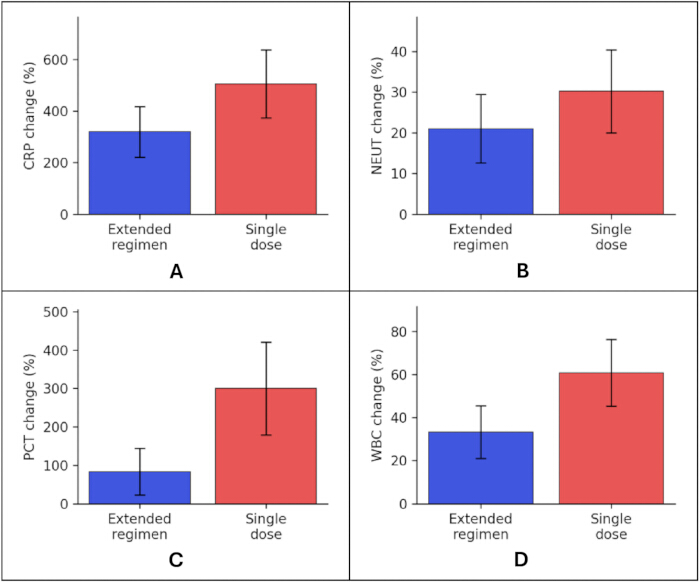
Figure 7: Reported percentage changes from preoperative values to postoperative day 1. (A) CRP, (B) NEUT%, (C) PCT, and (D) WBC. Bars show the ceftriaxone group mean ± SD from Table 5. Individual percentage-change values cannot be reconstructed from group means. No adjusted longitudinal inference is shown. Please click here to view a larger version of this figure.
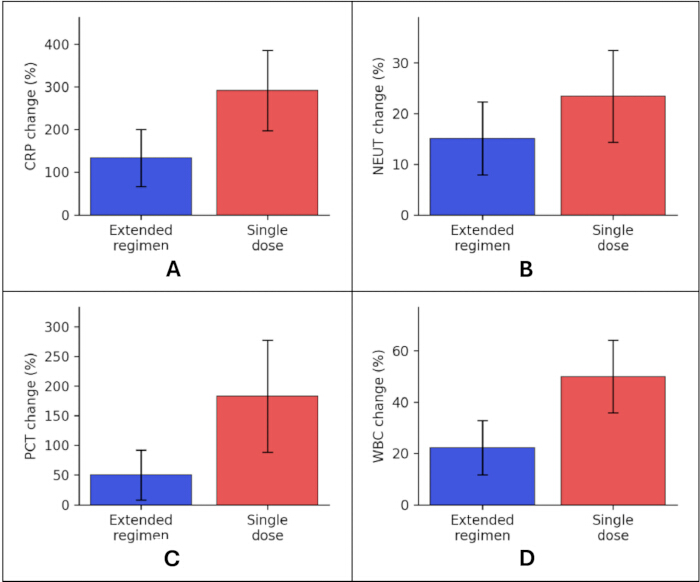
Figure 8: Reported percentage changes from preoperative values to postoperative day 3. (A) CRP, (B) NEUT%, (C) PCT, and (D) WBC. Bars show the ceftriaxone group mean ± SD from Table 5. Individual percentage-change values cannot be reconstructed from group means. No adjusted longitudinal inference is shown. Please click here to view a larger version of this figure.
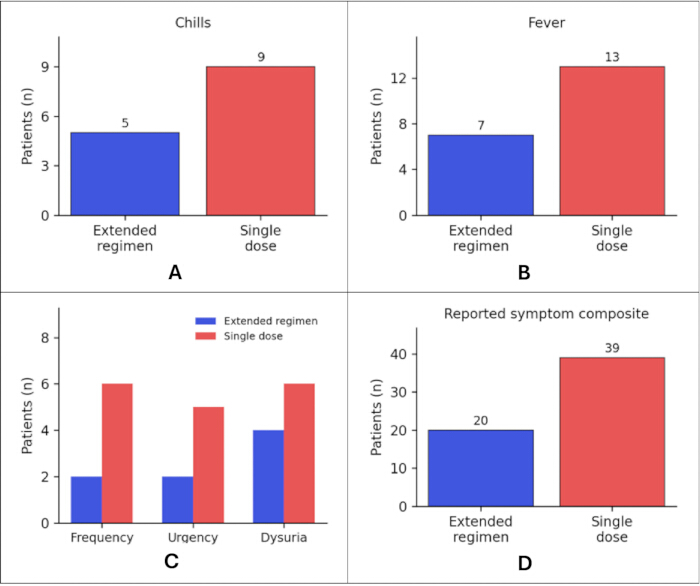
Figure 9: Reported infection-related manifestations. (A) Chills, (B) Fever, (C) Urinary frequency, urgency, and dysuria, and (D) The symptom composite. Bars show ceftriaxone-group patient counts, with group denominators of 122 and 130, respectively. Symptoms are not confirmed infections. Unadjusted two-sided Fisher's exact p-values are given in Table 6. No symptom-free urinary-symptom category is inferred from overlapping event counts. Please click here to view a larger version of this figure.
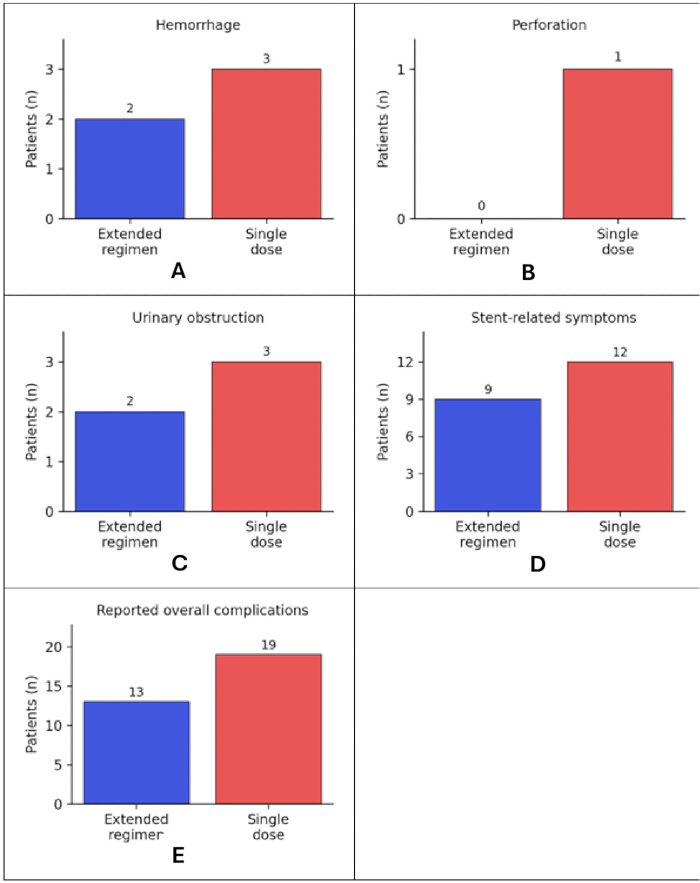
Figure 10. Reported surgical complications. (A) Hemorrhage, (B) Ureteral perforation, (C) Urinary obstruction, (D) Double-J stent-related symptoms, and (E) Overall complication count. Bars show ceftriaxone-group patient counts with group denominators of 122 and 130. Unadjusted two-sided Fisher's exact p-values are given in Table 7. These panels do not report ceftriaxone-related safety. Please click here to view a larger version of this figure.
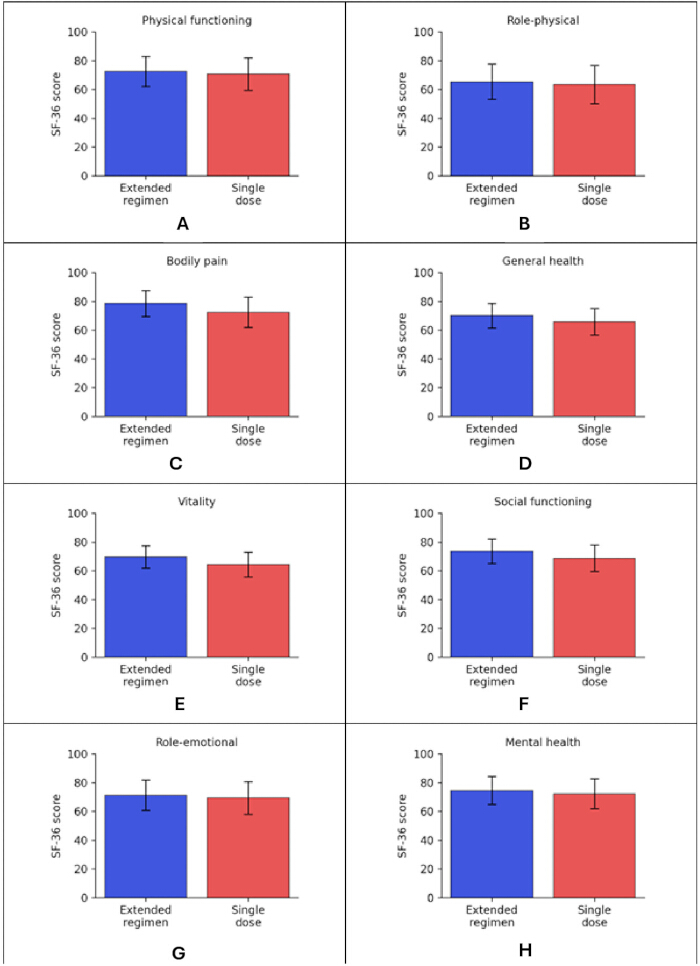
Figure 11. SF-36 scores at discharge. (A) Physical functioning, (B) Role-physical, (C) Bodily pain, (D) General health, (E) Vitality, (F) Social functioning, (G) Role-emotional, and (H) Mental health. Bars show ceftriaxone-group mean ± SD from Table 9 on the 0–100 score scale. Approximate unadjusted summary-based Welch comparisons are given in Table 9; no baseline-adjusted or multiplicity-adjusted treatment effect is shown. Please click here to view a larger version of this figure.
| Characteristics | Extended-regimen group (n = 122) | Single-dose group (n = 130) | p-value |
| Sex (M/F) | 62 / 60 | 74 / 56 | 0.376 |
| Age (years) | 42.7 ± 8.2 | 43.1 ± 8.6 | 0.706 |
| BMI (kg/m²) | 23.6 ± 3.1 | 24.2 ± 3.4 | 0.144 |
| Hypertension [n (%)] | 23 (18.9%) | 25 (19.2%) | 1 |
| Diabetes [n (%)] | 13 (10.7%) | 17 (13.1%) | 0.567 |
| Stone Location [n (%)] | 0.61 | ||
| Proximal ureter | 39 (32.0%) | 37 (28.5%) | |
| Mid ureter | 46 (37.7%) | 46 (35.4%) | |
| Distal ureter | 37 (30.3%) | 47 (36.2%) | |
| Stone Diameter (cm) | 0.8 ± 0.3 | 0.9 ± 0.4 | 0.025 |
| Stone Number [n (%)] | 0.859 | ||
| Single | 104 (85.2%) | 112 (86.2%) | |
| Multiple | 18 (14.8%) | 18 (13.8%) | |
| Stone CT Value (HU) | 866 ± 245 | 893 ± 257 | 0.394 |
Table 1: Baseline characteristics of the extended and single-dose ceftriaxone groups. Demographic, comorbidity, and stone characteristics are summarized for 122 and 130 participants, respectively. Continuous values are mean ± SD, and categorical values are n (%); comparisons are exploratory. Data are mean ± SD or n (%), using denominators of 122 and 130. Approximate two-sided Welch t-test p-values were calculated from the displayed rounded continuous summaries. Categorical comparisons use two-sided Fisher's exact tests, except for stone location (Pearson chi-square, χ2 = 0.990, df = 2). All p-values are exploratory and unadjusted. Abbreviations: BMI = body mass index; CT = computed tomography; HU = Hounsfield units.
| Group | WBC (×10⁹/L) | NEUT (%) | CRP (mg/L) | PCT (ng/mL) |
| Extended regimen (n = 122) | 6.1 ± 1.2 | 59.6 ± 4.4 | 3.6 ± 1.3 | 0.06 ± 0.02 |
| Single dose (n = 130) | 6.4 ± 1.1 | 60.2 ± 4.7 | 3.7 ± 1.2 | 0.06 ± 0.01 |
| p-value | 0.04 | 0.296 | 0.527 | 1 |
Table 2: Preoperative inflammatory markers in the extended and single-dose ceftriaxone groups. White blood cell count, neutrophil percentage, C-reactive protein, and procalcitonin are summarized before surgery. Values are mean ± SD; p-values are approximate, unadjusted comparisons of rounded group summaries. Data are mean ± SD. Approximate unadjusted two-sided Welch p-values were calculated from the displayed rounded summaries and n = 122/130. These are preoperative comparisons, not longitudinal-model outputs. Abbreviations: WBC = white blood cell count; NEUT = neutrophil percentage; CRP = C-reactive protein; PCT = procalcitonin.
| Group | WBC (×10⁹/L) | NEUT (%) | CRP (mg/L) | PCT (ng/mL) |
| Extended regimen (n = 122) | 8.4 ± 1.1 | 72.1 ± 5.4 | 15.1 ± 3.2 | 0.11 ± 0.04 |
| Single dose (n = 130) | 10.3 ± 1.4 | 78.4 ± 6.1 | 22.4 ± 4.1 | 0.24 ± 0.03 |
| p-value | <0.001 | <0.001 | <0.001 | <0.001 |
Table 3: Inflammatory markers on postoperative day 1 in the extended and single-dose ceftriaxone groups. Day-1 white blood cell count, neutrophil percentage, C-reactive protein, and procalcitonin are summarized as mean ± SD. p-values are approximate unadjusted between-group comparisons, not longitudinal treatment effects. Data are mean ± SD. P-values are approximate, unadjusted, two-sided Welch comparisons of day-1 rounded summaries using n = 122/130. They do not test a group-by-time interaction and are not adjusted for longitudinal contrasts.
| Group | n | WBC (×10⁹/L) | NEUT (%) | CRP (mg/L) | PCT (ng/mL) |
| Extended-regimen group | 122 | 7.7 ± 1.1 | 68.6 ± 4.7 | 8.4 ± 2.3 | 0.09 ± 0.03 |
| Single-dose group | 130 | 9.6 ± 1.2 | 74.3 ± 5.6 | 14.5 ± 3.2 | 0.17 ± 0.05 |
| P-value | - | <0.001 | <0.001 | <0.001 | <0.001 |
Table 4: Inflammatory markers on postoperative day 3 in the extended and single-dose ceftriaxone groups. Data are mean ± SD. p-values are approximate, unadjusted, two-sided Welch comparisons of day-3 rounded summaries using n = 122/130. They do not test a group-by-time interaction and are not adjusted for longitudinal contrasts.
| Marker | Time point | Extended regimen (n = 122) | Single dose (n = 130) |
| WBC | Postoperative Day 1 | 33.3±12.3 | 60.9±15.6 |
| Postoperative Day 3 | 22.2±10.6 | 50.0±14.2 | |
| NEUT% | Postoperative Day 1 | 21.0±8.4 | 30.2±10.2 |
| Postoperative Day 3 | 15.1±7.2 | 23.4±9.1 | |
| CRP | Postoperative Day 1 | 319.4±98.2 | 505.4±132.1 |
| Postoperative Day 3 | 133.3±67.4 | 291.9±94.3 | |
| PCT | Postoperative Day 1 | 83.3±60.5 | 300.0±120.6 |
| Postoperative Day 3 | 50.0±42.3 | 183.3±94.5 |
Table 5: Percentage change in inflammatory markers from preoperative values after ceftriaxone prophylaxis. Values are the reported mean ± SD percentage changes. Mean individual percentage change is distinct from the percentage change calculated from group means. —, adjusted longitudinal p-value not reported. No repeated-measures inference is assigned to these descriptive summaries.
| Symptom | Extended-regimen group (n = 122) | Single-dose group (n = 130) | p-value |
| Fever | 7 (5.7%) | 13 (10.0%) | 0.249 |
| Chills | 5 (4.1%) | 9 (6.9%) | 0.414 |
| Urinary symptoms | — | ||
| Urinary Frequency | 2 (1.6%) | 6 (4.6%) | 0.283 |
| Urinary Urgency | 2 (1.6%) | 5 (3.8%) | 0.448 |
| Dysuria | 4 (3.3%) | 6 (4.6%) | 0.75 |
| Reported symptom composite | 20 (16.4%) | 39 (30.0%) | 0.012 |
Table 6: Postoperative infection-related manifestations in the extended and single-dose ceftriaxone groups [n (%)]. Data are n (%). p-values were calculated using two-sided Fisher's exact tests from the displayed counts and are unadjusted. The reported composite is at least one manifestation per participant; it is not a confirmed infection. —, no pooled urinary-symptom comparison because unique-patient overlap counts are unavailable.
| Complication | Extended-regimen group (n = 122) | Single-dose group (n = 130) | p-value |
| Hemorrhage | 2 (1.6%) | 3 (2.3%) | 1 |
| Perforation | 0 (0.0%) | 1 (0.8%) | 1 |
| Urinary obstruction | 2 (1.6%) | 3 (2.3%) | 1 |
| Double-J stent-related symptoms | 9 (7.4%) | 12 (9.2%) | 0.653 |
| Overall complication rate | 13 (10.7%) | 19 (14.6%) | 0.449 |
Table 7: Postoperative complications in the extended and single-dose ceftriaxone groups [n (%)]. Data are n (%), calculated from the displayed counts and n = 122/130. p-values use two-sided Fisher's exact tests and are unadjusted. The reported overall count is distinct from a sum of overlapping events. Surgical complications do not establish ceftriaxone safety; ceftriaxone-related adverse-event frequencies were not reported.
| Risk factor | β | SE | Wald | OR | 95% CI | p-value |
| Age ≥ 60 years | 0.853 | 0.316 | 7.29 | 2.35 | 1.26 – 4.36 | 0.007 |
| Diabetes mellitus | 1.034 | 0.349 | 8.78 | 2.81 | 1.43 – 5.56 | 0.003 |
| Stone CT value ≥1000 HU | 0.653 | 0.309 | 4.48 | 1.92 | 1.06 – 3.52 | 0.034 |
| Operative duration ≥60 min | 0.902 | 0.328 | 7.48 | 2.46 | 1.28 – 4.67 | 0.006 |
| Single-dose ceftriaxone | 0.968 | 0.335 | 8.38 | 2.63 | 1.36 – 5.03 | 0.004 |
Table 8: Multivariable logistic regression of postoperative infection-related manifestations after ceftriaxone prophylaxis. Reported multivariable estimates for the infection-related manifestation outcome. Reference categories are age <60 years, no diabetes, stone CT value <1000 HU, operative duration <60 min, and extended regimen. Numerical VIF and tolerance values and complete model diagnostics were not reported; the estimates remain exploratory. Abbreviations: β = regression coefficient; SE = standard error; OR = odds ratio; CI = confidence interval.
| Domain | Extended regimen (n = 122) | Single dose (n = 130) | p-value |
| Physical functioning | 72.6 ± 10.4 | 70.7 ± 11.3 | 0.166 |
| Role-physical | 65.4 ± 12.3 | 63.5 ± 13.2 | 0.238 |
| Bodily pain | 78.5 ± 9.1 | 72.5 ± 10.5 | <0.001 |
| General health | 70.1 ± 8.6 | 65.8 ± 9.2 | <0.001 |
| Vitality | 69.7 ± 7.7 | 64.3 ± 8.6 | <0.001 |
| Social functioning | 73.6 ± 8.4 | 68.7 ± 9.2 | <0.001 |
| Role-emotional | 71.3 ± 10.6 | 69.4 ± 11.3 | 0.17 |
| Mental health | 74.5 ± 9.7 | 72.2 ± 10.4 | 0.07 |
Table 9: SF-36 scores at discharge in the extended and single-dose ceftriaxone groups. Data are mean ± SD. P-values are approximate, unadjusted two-sided Welch tests calculated from the displayed rounded summaries and n = 122/130. Baseline SF-36 values and multiplicity-adjusted comparisons were not reported. Higher scores indicate better reported health status.
讨论
This exploratory study found lower postoperative mean inflammatory marker levels and a lower reported symptom-composite frequency among patients receiving extended ceftriaxone prophylaxis. These observations require cautious interpretation. WBC already differed before surgery, the stone diameter differed between groups, and numerical repeated-measures results were not reported. Separate postoperative comparisons cannot determine whether treatment altered the trajectory of inflammation independently of baseline differences32,33,45. Biomarker changes also do not establish a bacterial mechanism or prevention of confirmed infection16,17,18,19.
Fever, chills, frequency, urgency, and dysuria can occur after instrumentation and stent placement. The combined occurrence of these manifestations is clinically relevant but is not equivalent to culture-confirmed infection11,12. This study did not report a separately adjudicated infection endpoint or group-specific SIRS rates. Similarly, nonsignificant surgical-complication comparisons cannot establish ceftriaxone safety when drug-related adverse events are not quantified30,40. These distinctions preclude concluding that prolonged prophylaxis safely prevents postoperative infection.
The findings should be considered alongside current prophylaxis guidance and directly relevant external evidence46,47. EAU guidance notes that a single prophylactic dose before ureteroscopy is sufficient20. In a retrospective cohort of culture-negative patients undergoing flexible ureterorenoscopy, Méndez-Guerrero and colleagues reported more lower urinary tract infections and more multidrug-resistant isolates with extended prophylaxis, without a significant difference in upper urinary tract infection or sepsis7. Although the procedure and observational design differ from the present study, the contrasting results argue against translating lower inflammatory-marker values into a recommendation for prolonged prophylaxis. Evidence from percutaneous stone surgery or culture-positive populations addresses different clinical settings20,21,22,23,24,48,49.
The 3–7-day ceftriaxone regimen introduces clinically relevant exposure heterogeneity. At the reported twice-daily schedule, it corresponds nominally to 6–14 preoperative doses (12–28 g), compared with a single 2 g dose; actual exposure depends on adherence and dose timing. Without duration-specific patient counts, selection criteria, and outcomes, the effects of shorter and longer courses cannot be separated. Additional intravenous administrations may increase cannulation, nursing, monitoring, medication, and patient-time requirements; inpatient versus outpatient administration and costs were not quantified. Longer antimicrobial exposure also raises resistance and drug-related harm concerns50,51,52,53,54. These burdens must be assessed alongside any benefits before a prolonged regimen can be justified.
The absence of prospective sample-size planning, incomplete participant-flow information, lack of numerical longitudinal model and collinearity results, and incomplete secondary-outcome and safety reporting limit inference. Multiple unadjusted comparisons increase the possibility of chance findings, whereas nonsignificant results do not exclude clinically important differences30,36,37. The single-center setting and variable treatment duration further limit generalizability. Future prospectively registered studies should prespecify the sample size, allocation, and analysis populations, one fixed or explicitly stratified regimen, a clinically adjudicated infection endpoint, repeated-measures analysis, complete adverse-event surveillance, resource use, and follow-up for antimicrobial resistance31,40,55. The present findings are hypothesis-generating and do not justify routine prolonged prophylaxis or a recommendation for any specific high-risk subgroup.
In culture-negative patients undergoing RUL, extended ceftriaxone prophylaxis was associated with lower postoperative inflammatory-marker values and fewer reported infection-related manifestations. The exploratory evidence does not demonstrate prevention of confirmed infection or equivalent ceftriaxone safety. Routine prolonged prophylaxis is not supported by these results.
披露
The authors declare they have no financial interests.
Author's Contributions:
All authors conceptualized and designed the study. Jin Wei, Ming Liu, and JianAn Zou collected the patient data and interpreted the findings. All authors wrote the manuscript. Heyuan Hua, Mingfeng Shao, and Moh Aijaz revised and edited the manuscript and participated in the submission process. All authors reviewed and approved the final manuscript.
致谢
The author gratefully acknowledges the academic support and research environment provided by Anhui University of Traditional Chinese Medicine First Affiliated Hospital, HeFei, China, 230001, during this research study. The figure was drawn using Canva Pro, Microsoft PowerPoint (version 2019), and GraphPad Prism 9.3.1 (GraphPad Software, USA). The authors confirm that these figures contain no previously published images, adapted panels, or third-party icons. The author received no specific grant from any funding agency in the public, commercial, or not-for-profit sectors for the preparation of this manuscript.
材料
| 姓名 | 公司 | 目录编号 | 评论 |
|---|---|---|---|
| Canva Pro | Canva Pty Ltd | https://www.canva.com/ | |
| Ceftriaxone | S. Silom Medical Technology Co., Ltd. | CAS 74578-69-1 | |
| Hematology Analyzer | Hunan Runmei Gene Technology Co., Ltd. | BCA 330 Automatic | |
| Computed tomography (CT) system | XINDRAY MEDICAL | Model NO. XRCT01 | |
| C-reactive protein (CRP) assay/analyzer | Shenzhen Coris Medical Technology Co., Ltd. | Z3 Crp Fully Automatic | |
| Cystoscope | IClear HealthCare | CHI-GBS series | |
| Double-J ureteral stent | Fushan or OEM | 5fr/6fr/8fr | |
| GraphPad Prism | GraphPad Software, LLC | Version 9.3.1; https://www.graphpad.com/scientific-software/prism/ | |
| Guidewire | Rapidguid | HS Code 9018390000 | |
| YAG Laser Lithotripsy System for Kidney and Ureteral Stones | MECANMED | Model NO. MCS0065W | |
| Microsoft PowerPoint | Microsoft Corporation | Version 2019; https://www.microsoft.com/microsoft-365/powerpoint | |
| Digital X-Ray Radiography system | Dawei Medical (Jiangsu) Co., Ltd. | RD-500B | |
| Procalcitonin (PCT) Chemiluminescence Immunoassay Analyzer | Nanjing Norman Biological Technology Co., Ltd | HS Code 90275000 | |
| Rigid ureteroscope, 8/9.8 Fr | Richard Wolf GmbH | https://www.richard-wolf.com/ | |
| SF-36 Health Survey | RAND / Medical Outcomes Study | https://www.rand.org/health-care/surveys_tools/mos/36-item-short-form.html | |
| Sterile normal saline for irrigation | Hangzhou Weize Import and Export Co., Ltd | size 500ml | |
| Stone retrieval basket | Hunan Reborn Medical Science and Technology Development Co., Ltd | Model NO. F1.7, F2.2 | |
| Ultrasound system | Guangzhou UMY Medical Equipment Co., Ltd | UMUS7716 Ultrasound System | |
| Urine culture testing system/media | Foshan Medco Medical Equipment Co. Ltd | Model NO. SC-BW20 |
参考文献
- GBD 2021 Urolithiasis Collaborators. The global, regional, and national burden of urolithiasis in 204 countries and territories, 2000–2021: a systematic analysis for the Global Burden of Disease Study 2021. EClinicalMedicine. 2024;78:102924.
- Romero V, Akpinar H, Assimos DG. Kidney stones: a global picture of prevalence, incidence, and associated risk factors. Rev Urol. 2010;12(2):e86–e96.
- Scales CD Jr, Smith AC, Hanley JM, Saigal CS; Urologic Diseases in America Project. Prevalence of kidney stones in the United States. Eur Urol. 2012;62(1):160–165.
- Rule AD et al. Kidney stones and the risk for chronic kidney disease. Clin J Am Soc Nephrol. 2009;4(4):804–811.
- Bhanot R, Jones P, Somani B. Minimally invasive surgery for the treatment of ureteric stones – state-of-the-art review. Res Rep Urol. 2021;13:227–236.
- Wetherell DR et al. Advances in ureteroscopy. Transl Androl Urol. 2014;3(3):321–327.
- Méndez-Guerrero DM et al. Antibiotic prophylaxis in flexible ureterorenoscopy with negative urine culture. BJUI Compass. 2023;4(6):688–694.
- Somani BK et al. Complications associated with ureterorenoscopy (URS) related to treatment of urolithiasis: the Clinical Research Office of Endourological Society URS Global study. World J Urol. 2017;35(4):675–681.
- de la Rosette J et al. The Clinical Research Office of the Endourological Society Ureteroscopy Global Study: indications, complications, and outcomes in 11,885 patients. J Endourol. 2014;28(2):131–139.
- Prata F et al. Urinary tract infection predictors in patients undergoing retrograde intrarenal surgery for renal stones: does the instrument make the difference? J Clin Med. 2024;13(10):2758.
- Joshi HB et al. Indwelling ureteral stents: evaluation of symptoms, quality of life and utility. J Urol. 2003;169(3):1065–1069.
- Pooli A, Cook G, Isharwal S, Desai V, LaGrange C. Urinalysis findings are not predictive of positive urine culture in patients with indwelling stents. Can J Urol. 2016;23(5):8446–8450.
- Mariappan P, Loong CW. Midstream urine culture and sensitivity test is a poor predictor of infected urine proximal to the obstructing ureteral stone or infected stones: a prospective clinical study. J Urol. 2004;171(6 Pt 1):2142–2145.
- Eswara JR, Shariftabrizi A, Sacco D. Positive stone culture is associated with a higher rate of sepsis after endourological procedures. Urolithiasis. 2013;41(5):411–414.
- Nevo A, Mano R, Schreter E, Lifshitz DA. Clinical implications of stent culture in patients with indwelling ureteral stents prior to ureteroscopy. J Urol. 2017;198(1):116–121.
- Meisner M. Update on procalcitonin measurements. Ann Lab Med. 2014;34(4):263–273.
- Wacker C, Prkno A, Brunkhorst FM, Schlattmann P. Procalcitonin as a diagnostic marker for sepsis: a systematic review and meta-analysis. Lancet Infect Dis. 2013;13(5):426–435.
- Simon L, Gauvin F, Amre DK, Saint-Louis P, Lacroix J. Serum procalcitonin and C-reactive protein levels as markers of bacterial infection: a systematic review and meta-analysis. Clin Infect Dis. 2004;39(2):206–217.
- Pepys MB, Hirschfield GM. C-reactive protein: a critical update. J Clin Invest. 2003;111(12):1805–1812.
- European Association of Urology. EAU Guidelines on Urolithiasis [Internet]. Arnhem: EAU Guidelines Office; 2026 [cited 2026 Sep 23]. Section 3.4.8.a, Antibiotic therapy. Available from: https://uroweb.org/guidelines/urolithiasis/chapter/guidelines.
- Gavi F et al. Antibiotic prophylaxis in stone surgery: a systematic review of the literature. World J Urol. 2025;43(1):144.
- He C et al. Antibiotic administration for negative midstream urine culture patients before percutaneous nephrolithotomy. Urolithiasis. 2021;49(6):505–512.
- Patel H, Shekar PA, Reddy D, Dumra A, Shivakumar KS. A randomized controlled trial comparing two protocols of preoperative antibiotics in patients with positive urine culture undergoing percutaneous nephrolithotomy. World J Urol. 2023;41(8):2225–2232.
- Xu P et al. Preoperative antibiotic therapy exceeding 7 days can minimize infectious complications after percutaneous nephrolithotomy in patients with positive urine culture. World J Urol. 2022;40(1):193–199.
- Yang HJ. Prophylactic antimicrobial therapy and antimicrobial stewardship in urologic surgery. Urogenit Tract Infect. 2023;18(1):8–14.
- Salam MA et al. Antimicrobial resistance: a growing serious threat to global public health. Healthcare (Basel). 2023;11(13):1946.
- Giamarellou H, Galani L, Karavasilis T, Ioannidis K, Karaiskos I. Antimicrobial stewardship in the hospital setting: a narrative review. Antibiotics (Basel). 2023;12(10):1557.
- Nayyar R, Kumar S; Collaborative Working Group on Use of Antibiotics in Endourology. Peri-operative antibiotic usage during endourological surgery: a multi-institutional, national-level, cross-sectional audit of prevalent practice pattern in India. Indian J Urol. 2023;39(2):133–141.
- Marino F, Rossi F, Murri R, Sacco E. Antibiotic prophylaxis in urologic interventions: who, when, where? Urologia. 2024;91(1):11–25.
- Altman DG, Bland JM. Statistics notes: absence of evidence is not evidence of absence. BMJ. 1995;311(7003):485.
- Hopewell S et al. CONSORT 2025 statement: updated guideline for reporting randomized trials. BMJ. 2025;389:e081123.
- Gueorguieva R, Krystal JH. Move over ANOVA: progress in analyzing repeated-measures data and its reflection in papers published in the Archives of General Psychiatry. Arch Gen Psychiatry. 2004;61(3):310–317.
- Schober P, Vetter TR. Repeated measures designs and analysis of longitudinal data: if at first you do not succeed-try, try again. Anesth Analg. 2018;127(2):569–575.
- Welch BL. The generalization of 'Student's' problem when several different population variances are involved. Biometrika. 1947;34(1–2):28–35.
- Fisher RA. On the interpretation of χ2 from contingency tables, and the calculation of P. J R Stat Soc. 1922;85(1):87–94.
- Wasserstein RL, Lazar NA. The ASA's statement on p-values: context, process, and purpose. Am Stat. 2016;70(2):129–133.
- Bender R, Lange S. Adjusting for multiple testing—when and how? J Clin Epidemiol. 2001;54(4):343–349.
- Singer M et al. The Third International Consensus Definitions for Sepsis and Septic Shock (Sepsis-3). JAMA. 2016;315(8):801–810.
- Bone RC et al. Definitions for sepsis and organ failure and guidelines for the use of innovative therapies in sepsis. Chest. 1992;101(6):1644–1655.
- Junqueira DR et al. CONSORT Harms 2022 statement, explanation, and elaboration: updated guideline for the reporting of harms in randomised trials. BMJ. 2023;381:e073725.
- Ware JE Jr, Sherbourne CD. The MOS 36-item short-form health survey (SF-36). I. Conceptual framework and item selection. Med Care. 1992;30(6):473–483.
- McHorney CA, Ware JE Jr, Raczek AE. The MOS 36-item short-form health survey (SF-36). II. Psychometric and clinical tests of validity in measuring physical and mental health constructs. Med Care. 1993;31(3):247–263.
- O'Brien RM. A caution regarding rules of thumb for variance inflation factors. Qual Quant. 2007;41(5):673–690.
- Sun X, Briel M, Walter SD, Guyatt GH. Is a subgroup effect believable? Updating criteria to evaluate the credibility of subgroup analyses. BMJ. 2010;340:c117.
- Vickers AJ, Altman DG. Statistics notes: analysing controlled trials with baseline and follow up measurements. BMJ. 2001;323(7321):1123–1124.
- Chew BH et al. A single dose of intraoperative antibiotics is sufficient to prevent urinary tract infection during ureteroscopy. J Endourol. 2016;30(1):63–68.
- Greene DJ et al. American Urological Association antibiotic best practice statement and ureteroscopy: does antibiotic stewardship help? J Endourol. 2018;32(4):283–288.
- Sur RL et al. A randomized controlled trial of preoperative prophylactic antibiotics for percutaneous nephrolithotomy in moderate to high infectious risk population: a report from the EDGE Consortium. J Urol. 2021;205(5):1379–1386.
- Chew BH et al. A randomized controlled trial of preoperative prophylactic antibiotics prior to percutaneous nephrolithotomy in a low infectious risk population: a report from the EDGE Consortium. J Urol. 2018;200(4):801–808.
- Tamma PD et al. Association of adverse events with antibiotic use in hospitalized patients. JAMA Intern Med. 2017;177(9):1308–1315.
- Branch-Elliman W et al. Association of duration and type of surgical prophylaxis with antimicrobial-associated adverse events. JAMA Surg. 2019;154(7):590–598.
- Brown KA et al. Antibiotic prescribing choices and their comparative C. difficile infection risks: a longitudinal case-cohort study. Clin Infect Dis. 2021;72(5):836–844.
- Costelloe C, Metcalfe C, Lovering A, Mant D, Hay AD. Effect of antibiotic prescribing in primary care on antimicrobial resistance in individual patients: systematic review and meta-analysis. BMJ. 2010;340:c2096.
- Dancer SJ. The problem with cephalosporins. J Antimicrob Chemother. 2001;48(4):463–478.
- Chan AW et al. SPIRIT 2025 statement: updated guideline for protocols of randomized trials. BMJ. 2025;389:e081477.