This systematic review and meta-analysis pooled 12 lung-cancer models predicting checkpoint inhibitor pneumonitis. Validation C-statistics averaged 0.82, but a 0.51–0.95 prediction interval, predominantly unclear risk of bias with two high-risk studies, and scarce external validation preclude clinical deployment.
研究文章
Machine Learning, Radiomics, and Clinical Models Predicting Checkpoint Inhibitor Pneumonitis in Lung Cancer: A Systematic Review and Meta-analysis
本文内容
摘要
摘要
Checkpoint inhibitor pneumonitis (CIP) is a potentially fatal immune-related adverse event of immune checkpoint inhibitor (ICI) therapy in lung cancer, and many machine-learning (ML), computed tomography (CT) radiomics, deep-learning, and clinical models have been proposed to predict it. This systematic review searched PubMed, Embase, Web of Science, CINAHL, and SinoMed, supplemented by citation searching and other sources, with independent dual-reviewer screening throughout and a reproducible PubMed verification search updated to August 16, 2026. Twelve peer-reviewed lung-cancer CIP-occurrence models (4,875 patients, 1,057 events) formed the main analysis; validation C-statistics were pooled on the logit scale with restricted maximum likelihood and Hartung-Knapp intervals, stratified by validation design. The pooled validation C-statistic was 0.82 (95% confidence interval 0.75–0.88) with high heterogeneity (I2 = 90.7%) and a wide 95% prediction interval of 0.51–0.95, which is the decision-relevant quantity. By validation design, internal cross-validation pooled to 0.83, internal split-sample to 0.76, and only two studies reported external validation (0.84 and 0.92, described narratively). Imaging-based models (k = 8) showed numerically higher discrimination than clinical models (k = 4; 0.85 versus 0.78, moderator p = 0.46) without a statistically significant difference, and this comparison is confounded by design covariates. Estimates were stable on leave-one-out, alternative-model, cohort-overlap, and standard-error-source sensitivity analyses (range 0.80–0.84). Under the standard Prediction model Risk Of Bias ASsessment Tool, applied independently by two reviewers with consensus resolution, two studies were at high, nine at unclear, and one at low overall risk of bias; certainty of evidence was low (very low under a stricter appraisal scenario, which left the pooled estimate essentially unchanged). Current models separate risk groups on average but remain unready for clinical use; adequately powered, externally validated, and calibration-reported models are needed.
引言
ICIs targeting programmed cell death protein 1 (PD-1) and its ligand (PD-L1) have transformed the treatment of lung cancer and are now standard first-line therapy for many patients1. Their benefit is accompanied by immune-related adverse events, of which CIP is among the most clinically serious and a leading cause of treatment-related death2,3. Within the broader landscape of immune-related toxicity, pulmonary events carry a disproportionate share of fatal outcomes, and mechanistic understanding of these adverse events continues to evolve4. CIP occurs in roughly 5%–20% of ICI-treated lung-cancer patients, is more frequent and more severe in lung cancer than in most other tumor types, and is frequently difficult to distinguish from infection, tumor progression, or radiation pneumonitis5,6,7. Because management hinges on early recognition, ICI interruption, and corticosteroids8, reliable pre-treatment or early risk prediction could enable closer monitoring, prophylaxis, or treatment modification9,10.
Two complementary modeling strategies have been pursued. Quantitative imaging — handcrafted CT radiomics, deep learning, and quantitative-CT metrics — extracts predictive signal directly from routine scans, often combined with clinical variables11,12,13,14; radiomics promises to convert standard images into mineable, reproducible biomarkers when acquired and processed to community standards15,16. In parallel, purely clinical and laboratory nomograms predict CIP from accessible variables such as interstitial lung abnormality, prior thoracic radiotherapy, lymphocyte count, and performance status17,18,19. Whether the additional segmentation effort, scanner dependence, and overfitting risk of imaging models yields better discrimination than simple clinical models is a clinically decisive but unanswered question.
The field is fragmented across populations, predictor types, outcome definitions, and validation rigor, and individual reports tend to emphasize high apparent discrimination without addressing reproducibility or calibration. Prediction of CIP occurrence, differentiation of established CIP from radiation or other pneumonitis, differentiation from coronavirus disease 2019 (COVID-19) pneumonia, pneumonitis after combined radiotherapy and ICI, and generic immune-related adverse-event prediction are distinct clinical questions; in this review they were prespecified as separate pools and are never combined in one interpretive framework. A recent meta-analysis pooled ML models for radiation pneumonitis and CIP in lung cancer broadly20 but did not contrast imaging with clinical models, did not separate CIP-occurrence prediction from differential diagnosis, and predated several 2025–2026 studies. We therefore conducted a focused systematic review and meta-analysis to (i) quantify the pooled discrimination of CIP-occurrence prediction models in lung cancer with the prediction interval as the primary transportability statement, (ii) explore whether reported discrimination differs between imaging-based and clinical models, (iii) characterize heterogeneity via validation-design strata, subgroups, and meta-regression, and (iv) appraise risk of bias in independent duplicate with the standard Prediction model Risk Of Bias ASsessment Tool (PROBAST) and certainty with the Grading of Recommendations Assessment, Development and Evaluation (GRADE) framework21,22. We hypothesized that apparent discrimination would be substantial but undermined by heterogeneity and methodological limitations.
方案
The review was conducted and reported per the PRISMA 2020 statement23; data extraction followed CHARMS24; risk of bias was assessed with PROBAST22; and reporting of the appraised models was framed against the TRIPOD statement21. The review was not prospectively registered, which is acknowledged as a limitation; the protocol, PICOTS eligibility framework, search strategies, extraction dataset, appraisal files, dual-review screening and adjudication logs, and analysis code are deposited in an Open Science Framework (OSF) repository (DOI: 10.17605/OSF.IO/KYNXB). The deposit is documentation of completed work, not a prospective preregistration, and is described as such in the repository. The software and computational resources used in this protocol are listed in the Table of Materials.
Eligibility criteria
Include original, peer-reviewed studies that enrolled lung-cancer patients receiving ICIs and developed or validated a CT-radiomics, deep-learning, ML, quantitative-CT, or clinical-nomogram model predicting the occurrence or grade of CIP, reporting at least one discrimination metric. Exclude, and analyze separately where prespecified, studies differentiating established CIP from radiation, COVID-19, or other pneumonia; radiotherapy-plus-ICI mixed pneumonitis that cannot isolate CIP; and generic immune-related adverse-event models. Carry mixed-cancer cohorts in a separate pan-cancer supplementary pool. Admit preprints to sensitivity analysis only.
Information sources and search
Search PubMed, Embase, Web of Science Core Collection, CINAHL, and SinoMed from inception to June 22, 2026, using database-specific full Boolean strategies (Supplementary Table 1), supplemented by citation searching of prior reviews20 and included studies, preprint repositories, and other sources. Export all records and de-duplicate by digital object identifier, PubMed identifier, and title-author-year matching. Verify currency with a fully reproducible Boolean PubMed strategy (Supplementary Table 1) executed on August 16, 2026: this strategy retrieved 78 records in total and three records published after the original June 22, 2026 search, none of which met the eligibility criteria after screening, indicating that the evidence base is current.
Study selection and data extraction
Screen titles and abstracts, and then full texts, against the criteria in independent duplicate: two reviewers screened every record, with disagreements resolved by consensus discussion and a third arbiter available; inter-rater agreement before consensus was 97.3% at the title/abstract screening stage (Cohen’s κ = 0.92, 95% CI 0.89–0.95) and 95.8% at the full-text eligibility stage. Extract data in duplicate with a piloted CHARMS-based form, resolving discrepancies against the source publication. Record one primary reason per full-text exclusion (Supplementary Table 2). Define the unit of analysis as one model per study: when a study reports several models, select the author-recommended or final combined model on the most independent evaluation set (external > internal validation > cross-validation; apparent estimates never pooled), with the priority any-grade CIP > grade ≥ 2 > grade ≥ 3; record all alternative models for sensitivity analysis. Extract design, country, center, recruitment period, population, ICI exposure, CIP definition and adjudication, predictor types, modeling methods, sample size, events, events per variable, validation approach, calibration reporting, and discrimination with its uncertainty.
Risk of bias and applicability
Rate each study's participants, predictors, outcome, and analysis domains as low, high, or unclear risk with an overall judgment and applicability assessment, per the standard PROBAST guidance22. Two assessors independently rated every study and documented domain-level reasons, with disagreements resolved by consensus—“unclear” was reserved for insufficient reporting and “high” for documented, unmitigated flaws; before consensus, the reviewers agreed on 43 of 48 domain-level judgments (89.6%), with substantial inter-rater agreement (Cohen’s κ = 0.80, 95% CI 0.64–0.97). Retain the stricter initial appraisal in full as a sensitivity scenario (Supplementary Table 3). For radiomics and deep-learning studies, additionally record acquisition and reconstruction parameters, segmentation methodology, feature-extraction software compliance with the Image Biomarker Standardization Initiative, and dimensionality-reduction practice15,16.
Statistical synthesis
Pool validation C-statistics on the logit scale by restricted maximum likelihood (REML) random effects with Hartung-Knapp confidence intervals25,26, reporting the 95% prediction interval27 with τ2 and I2 for every pool. Derive standard errors from reported 95% confidence intervals; where absent, approximate them from events and non-events by the Hanley-McNeil relationship28,29 — this applied to three studies (Tan 2022, Lyu 2025, Tao 2026) — and treat these estimates as a named sensitivity analysis rather than equivalent primary evidence. Report the primary pool alongside validation-design strata (external, internal cross-validation, internal split-sample) with a between-stratum moderator test; describe the external stratum narratively when it contains fewer than three studies. Prespecify subgroups (imaging versus clinical models; NSCLC-only versus broader-lung) and random-effects meta-regression (publication year, event count, model type). Run sensitivity analyses excluding Hanley-McNeil-approximated estimates, case-enriched sampling, the low-performing outlier, each study in turn (leave-one-out), the alternative-model set (replacing every author-recommended model with the lowest adequately validated alternative reported in the same study), each member of the suspected overlapping-cohort pair, and the studies at high consensus risk of bias. Label funnel-plot, Egger, Begg, and trim-and-fill procedures as exploratory given 12 studies30,31,32, and do not interpret the trim-and-fill estimate as an unbiased pooled effect. As an exploratory extension, reconstruct 2 × 2 tables where classification counts are recoverable, document every denominator and threshold assumption (Supplementary Table 4), pool with the bivariate Reitsma model33,34, and vary the Fagan pre-test probability across the reported CIP incidence range of 5%–20%5,6,7. Perform all analyses in R with metafor 5.0–1 and mada 0.5–11; deposit the analysis scripts, the frozen extraction dataset, and every model output in the OSF repository. SciForYou Meta Analysis (sciforyou.top) was additionally used to assist with meta-analytic data processing and graphical output. All effect-size transformations, model specifications, sensitivity analyses, and numerical results reported in the revised manuscript were independently reproduced and verified using the deposited R scripts.
Certainty assessment
Rate certainty with GRADE adapted for prognostic-model reviews35,36, beginning at high certainty for bodies of prognosis evidence per GRADE guidance36 and downgrading for risk of bias, inconsistency, imprecision, and suspected publication bias as applicable; record the certainty that would result under the stricter appraisal scenario.
结果
Search, selection, and study characteristics
The dual-reviewer search identified 896 records: 810 from databases (PubMed n = 434, Embase n = 78, Web of Science Core Collection n = 242, CINAHL n = 15, SinoMed n = 41) and 86 from other sources, including citation searching and preprint repositories. After removal of 115 duplicates, two reviewers independently screened 781 records and excluded 612. Of 169 reports sought for retrieval, 145 could not be retrieved despite systematic full-text requests—predominantly conference abstracts and reports without accessible full text. Twenty-four full-text reports were assessed for eligibility in duplicate; one was excluded (composite immune-related adverse-event outcome without isolable CIP; Supplementary Table 2), and 23 studies were included: 12 peer-reviewed lung-cancer CIP-occurrence models (4,875 patients, 1,057 CIP events) forming the main analysis, four CT-radiomics models differentiating CIP from radiation or other-cause pneumonitis37,38,39,40 (separate pool), six mixed-cancer models (pan-cancer supplementary pool), and one preprint admitted to sensitivity analysis only (Figure 1). Reports on adjacent clinical questions (differentiation from COVID-19 pneumonia, pneumonitis after combined radiotherapy and ICIs, generic immune-related adverse-event prediction) were excluded at screening as prespecified; their characteristics are shown for transparency in Table 1 (context rows). The August 2026 verification search added no eligible studies. Table 1 lists, for every model, the outcome definition, CIP grade and adjudication, prediction time point, sample size, event count, events per variable, model type, and validation design. Events per variable were below recommended minimums41 in 11 of 12 studies (only Tao 2026, approximately 36, exceeded them; Lyu 2025 was below 1; Xie 2026's authors reported approximately 2.1) (Supplementary Figure 1; Supplementary Table 5). A prespecified cohort-overlap check of centers and recruitment periods identified one suspected pair: Jia 2022 and Du 2025 share the same development center (First Affiliated Hospital of Xi'an Jiaotong University), overlapping recruitment windows (2019–2021 versus 2019–2022), the same adjudication panel design, and a common author, and are also the only two externally validated studies; both single-study exclusions are reported below. No other pair shared a named center.
Risk of bias under standard PROBAST assessment
Both reviewers applied the standard PROBAST independently and resolved differences by consensus; the consensus judgments reserve unclear for insufficient reported information and high for documented, unmitigated flaws (Figure 2; domain-level judgments and rationales in Supplementary Table 3). Overall risk of bias was high in 2 of 12 studies (Xie 2026: delta-radiomics predictors sharing the on-treatment CT with outcome ascertainment, events per variable of approximately 2.1, and author-acknowledged residual overfitting; Yadav 2025: 23 development events against more than 1,500 candidate features with a near-degenerate operating point, specificity 0.08, and no calibration), unclear in 9, and low in 1 (Jia 2022: prespecified predictors, external validation in an independent cohort, and reported calibration). At domain level, the analysis domain was high in 2, low in 2 (Jia 2022; Tao 2026), and unclear in eight—most often because optimism control, calibration, or missing-data handling were insufficiently reported rather than demonstrably flawed; outcome ascertainment was unclear in 11 of 12, as reports rarely stated whether the exclusion-based clinical diagnosis was adjudicated blind to predictors; participants and predictors were low risk in 7 and 9 of 12 (unclear otherwise, high in none). Applicability concerns were unclear in 9 and low in 3. The stricter initial appraisal—which rated the analysis domain, and therefore the overall judgment, high in all 12 studies - is retained in full as a sensitivity scenario (Supplementary Table 3), and its quantitative consequence is bounded in the robustness analyses below. The submitted version of this manuscript summarized risk of bias with a non-standard, less-conservative mapping; that summary has been withdrawn and replaced by the item-level dual-review appraisal throughout.
Pooled discrimination stratified by validation design
Across the 12 models the pooled validation C-statistic was 0.82 (95% CI 0.75–0.88), with high heterogeneity (I2 = 90.7%, τ2 = 0.42, Q = 86.3, p < 0.001) and a wide 95% prediction interval of 0.51–0.95 (Figure 3; all estimates in Table 2). The prediction interval, not the confidence interval, is the transportability-relevant quantity: across comparable validation studies, reported discrimination could plausibly range from little better than chance to excellent. By validation design, internal cross-validation (k = 5) pooled to 0.83 (0.68–0.91) and internal split-sample (k = 5) to 0.76 (0.55–0.89); the two externally validated models reported 0.84 (Jia 2022) and 0.92 (Du 2025) and are described narratively because a two-study stratum cannot support a stable pooled estimate. The between-stratum moderator test was non-significant (QM p = 0.29), and the internal-only pool (k = 10) was 0.80 (0.71–0.87). The estimate was stable across τ2 estimators and confidence-interval constructions (0.818–0.823 across DerSimonian-Laird, Paule-Mandel, Sidik-Jonkman, maximum likelihood, and REML, with and without Hartung-Knapp; alternative displays in Supplementary Figure 2).
Subgroups, meta-regression, and confounding
Imaging-based models (k = 8) pooled to 0.85 (0.73–0.92) and clinical models (k = 4) to 0.78 (0.64–0.88); the moderator test was non-significant (p = 0.46) and the intervals overlap substantially. This comparison is confounded at the study level by sample size, outcome definition, validation design, publication year, tumor subtype, and center (subgroup-level characteristics in Table 1); on current evidence it cannot establish incremental value for imaging models, and no such claim is made. The NSCLC-only subset (k = 8) pooled to 0.82 (0.72–0.89) and the broader-lung subset (k = 4) to 0.84 (0.58–0.95). Random-effects meta-regression identified no significant moderator: publication year (p = 0.30), CIP event count (p = 0.26, k = 12 after correcting one study's missing event count to 44), and model type (p = 0.46) each explained essentially none of the between-study variance.
Robustness, influence, and cohort overlap
Leave-one-out estimates ranged 0.80–0.84 with no metafor-flagged influential study (Supplementary Figure 3 and Supplementary Figure 4); excluding the low-performing outlier (Yadav 2025) gave 0.84 (0.78–0.89). The pool was robust to excluding the three Hanley-McNeil-approximated estimates (0.81, k = 9), to excluding case-enriched sampling (0.80, k = 10), and to adding the preprint (0.83, k = 13). Three new sensitivity analyses address reviewer concerns directly. First, the alternative-model set — replacing every author-recommended model with the lowest adequately validated alternative reported in the same study (five substitutions) — pooled to 0.81 (0.72–0.87), showing that best-model selection inflates the primary estimate only modestly. Second, excluding either member of the suspected Xi'an overlapping pair left the estimate essentially unchanged (drop Du 2025: 0.80, 0.73–0.86; drop Jia 2022: 0.82, 0.74–0.88), so potential double-counting of that cohort does not drive the result. Third, excluding the two studies at high consensus risk of bias left the pooled estimate essentially unchanged and marginally higher (0.84, 95% confidence interval 0.77–0.89; 95% prediction interval 0.57–0.95; I2 = 85.3%; k = 10), so the disagreement between the strict and consensus appraisals does not alter the synthesis conclusions (Supplementary Figure 5). A grade-endpoint substitution for Wang 2024 (grade ≥ 3 model instead of any-grade) gave 0.83. One caveat is retained for the Hanley-McNeil approximation itself: for Tao 2026 the approximated standard error derives from the full 2,082-patient cohort although the C-statistic came from cross-validation, giving that study the largest weight in the pool; the k = 9 sensitivity analysis above bounds the influence of this assumption.
Exploratory small-study effects
With only 12 studies, funnel-based procedures have limited power and are reported as exploratory (Egger regression in Supplementary Figure 3D). Egger's regression suggested small-study effects (z = 2.49, p = 0.032; Begg's p = 0.38), and trim-and-fill imputed four hypothetical studies with an adjusted estimate of 0.79; this adjusted value is a sensitivity illustration under the method's assumptions, not an unbiased pooled effect. Selective reporting of high-performing models remains the most plausible explanation and is treated as a certainty-of-evidence concern rather than a correctable quantity.
Differentiation of established CIP from other pneumonitis
Four CT-radiomics models differentiating CIP from radiation pneumonitis (three studies) or other-cause pneumonitis (one study) pooled to 0.90 (95% CI 0.77–0.96; I2 = 45%). This differentiation task is a different clinical question from occurrence prediction, is kept in a separate pool throughout, and shares the same methodological limitations; the small pool size precludes strong conclusions.
Exploratory diagnostic accuracy
Seven main-analysis studies had recoverable classification counts; their 2 × 2 reconstructions, with every denominator source, threshold, and assumption documented, appear in Supplementary Table 4. Thresholds were heterogeneous (Youden-derived in two studies, a fixed 0.5 probability in one, and unreported in four), so the pooled operating point mixes threshold conventions and is exploratory by design. The bivariate model gave a pooled sensitivity of 0.79 (95% CI 0.70–0.86) and specificity of 0.80 (0.48–0.95), positive likelihood ratio 3.9, negative likelihood ratio 0.26, and a summary ROC area of 0.83 (Figure 4; Supplementary Figure 6). Because the 2 × 2 for Du 2025 required an assumed event count in its external cohort, a sensitivity analysis excluding it gave sensitivity 0.79 and specificity 0.80 (summary ROC 0.82); excluding the specificity outlier (Yadav 2025, specificity 0.08) tightened specificity to 0.86 (0.77–0.92). Across pre-test probabilities spanning the reported CIP incidence range, a model-positive result raised 5%, 10%, 15%, and 20% pre-test probabilities to 17%, 30%, 41%, and 50%, and a model-negative result lowered them to 1.3%, 2.8%, 4.4%, and 6.1%, respectively (Supplementary Figure 7) — modest updating that assumes a fixed, transportable operating point, which current evidence does not establish.
Certainty of evidence
Beginning at high certainty for bodies of prognosis evidence per GRADE guidance36, the evidence for the primary pooled estimate was downgraded once for risk of bias (two high-risk studies and predominant unclear ratings driven by incomplete reporting) and once for inconsistency (I2 = 90.7% with a 0.51–0.95 prediction interval); the exploratory small-study signal (Egger p = 0.032) was noted but not used to downgrade, given the limited power of funnel-based tests at k = 12. The overall certainty for the primary pooled estimate is therefore low. Under the stricter initial appraisal scenario (all 12 studies at high risk of bias), certainty would fall to very low, because excluding the consensus high-risk studies does not lower the pooled estimate, the scenario changes the certainty label but not the synthesis conclusions (Supplementary Table 6). The pan-cancer supplementary pool (k = 6; 0.83, 0.80–0.86, I2 = 0%) and the combined pool (k = 18; 0.82, 0.77–0.86) were consistent with the main estimate, with the caveat that one pan-cancer study shares an author with a main-pool study, and partial cohort overlap there cannot be excluded.
In summary, the protocol's numbered steps were each validated by the corresponding results subsection above: the search step by the verification search and PRISMA flow, the extraction step by the per-model characteristics table, the appraisal step by the dual-review consensus PROBAST distribution and its strict-scenario bound, and the synthesis step by the stratified pools, sensitivity analyses, and certainty assessment. All supplementary and sensitivity analyses are summarized in Supplementary Table 6.
DATA AVAILABILITY:
All data and analysis materials underlying this systematic review, including the frozen CHARMS-based extraction dataset, item-level PROBAST assessments with rationales, dual-review screening and adjudication logs, analysis-ready input files, meta-analytic outputs, and complete R analysis scripts, are publicly available in the Open Science Framework at https://doi.org/10.17605/OSF.IO/KYNXB. Copyrighted full-text articles are not redistributed.
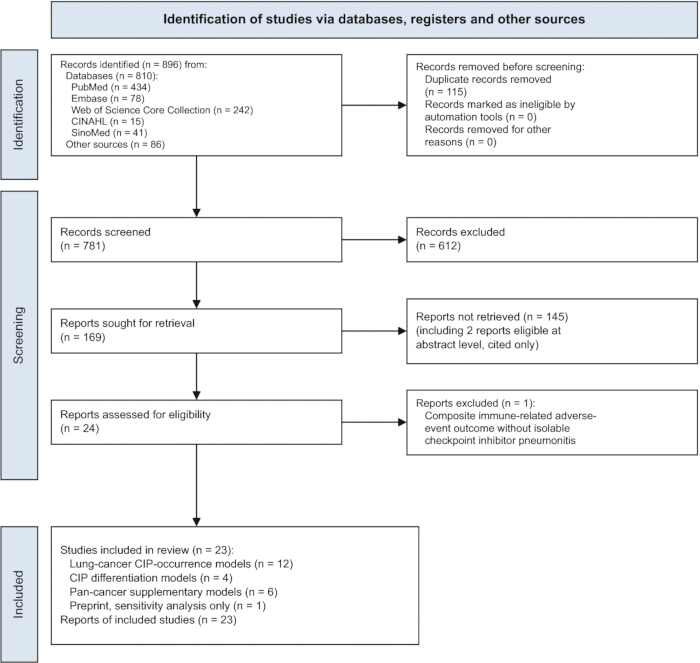
Figure 1: PRISMA 2020 flow diagram. The diagram summarizes study identification, duplicate removal, screening, report retrieval, eligibility assessment, and final inclusion in the main and supplementary analysis pools. Abbreviations: CIP = checkpoint inhibitor pneumonitis; PRISMA = Preferred Reporting Items for Systematic Reviews and Meta-Analyses. Please click here to view a larger version of this figure.
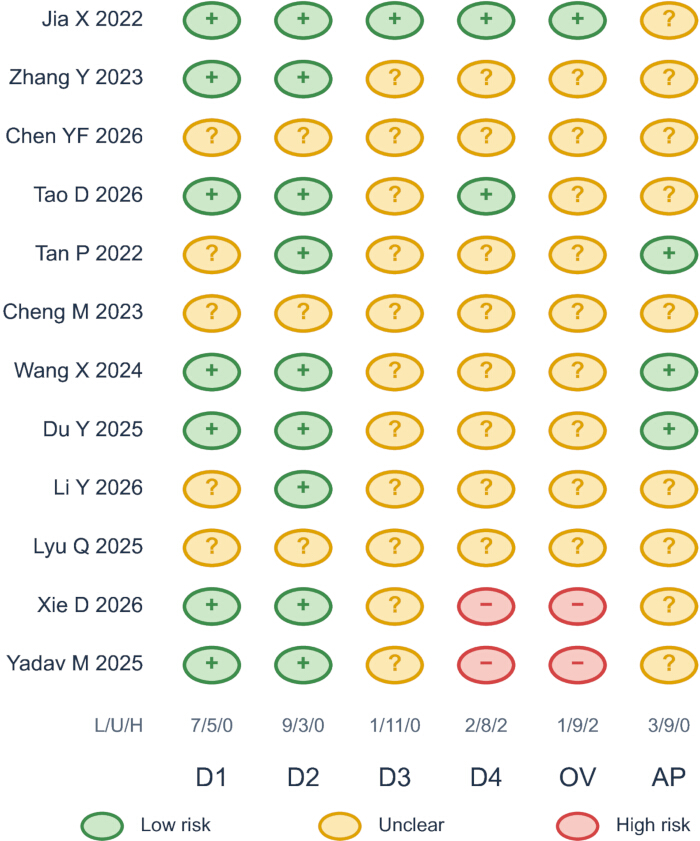
Figure 2: PROBAST risk-of-bias and applicability assessment. Consensus judgments for the 12 studies included in the primary analysis are shown after independent duplicate assessment and consensus resolution. Overall risk of bias was high in two studies, unclear in nine studies, and low in one study. D1, D2, D3, D4 represent participants, predictors, outcome, analysis, respectively. Abbreviations: OV = overall risk of bias; AP = applicability; PROBAST = Prediction model Risk Of Bias ASsessment Tool. Please click here to view a larger version of this figure.
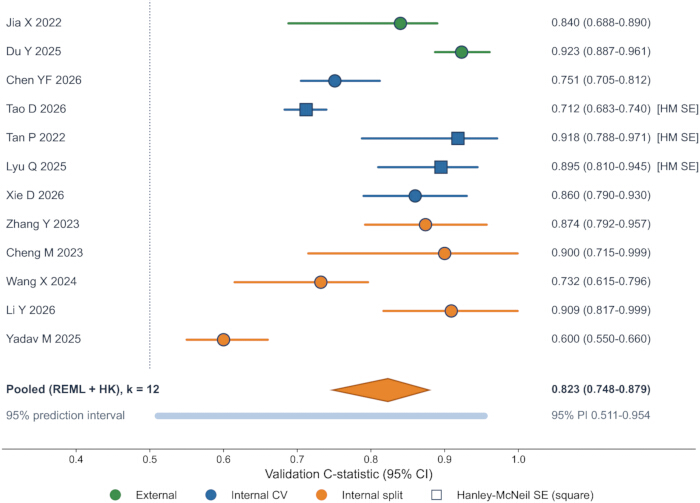
Figure 3: Validation C-statistics for CIP occurrence prediction. Study-specific validation C-statistics and 95% confidence intervals are displayed by validation design. The overall random-effects estimate was calculated using restricted maximum likelihood with Hartung-Knapp adjustment. The 95% prediction interval is also shown. Squares indicate studies whose standard errors were approximated with the Hanley-McNeil method. Abbreviations: CI = confidence interval; CV = cross-validation; HK = Hartung-Knapp; HM = Hanley-McNeil; PI = prediction interval; REML = restricted maximum likelihood; SE = standard error. Please click here to view a larger version of this figure.
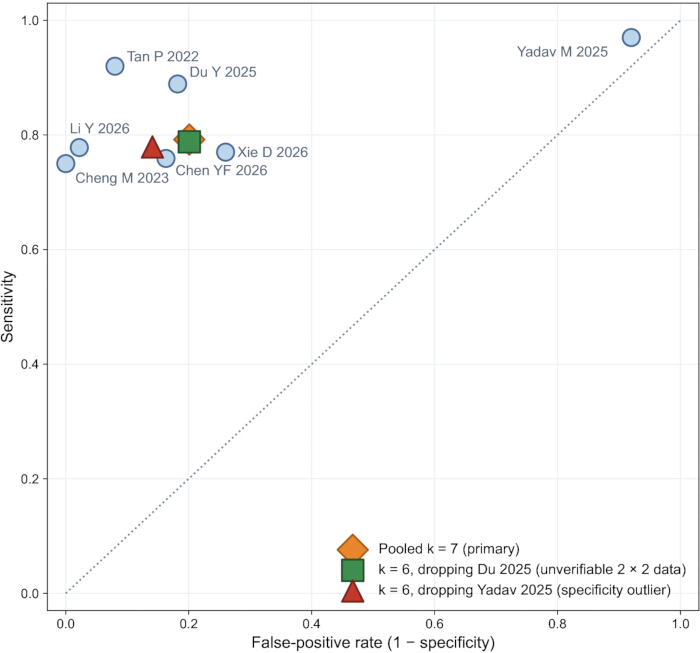
Figure 4: Exploratory summary receiver operating characteristic analysis. The bivariate Reitsma model was fitted to the seven studies with reconstructable 2 × 2 classification data. The pooled sensitivity was 0.79 (95% CI 0.70–0.86) and specificity was 0.80 (95% CI 0.48–0.95). Summary points are shown for the primary pool and for sensitivity analyses excluding Du 2025, for which the 2 × 2 data were unverifiable, and Yadav 2025, which was identified as a specificity outlier. Abbreviation: CI = confidence interval. Please click here to view a larger version of this figure.
Supplementary Figure 1: Development events and final model predictors. The number of development-set outcome events is displayed against the number of predictors retained in each final model. Events-per-variable values are shown descriptively to illustrate the relationship between available outcome information and model complexity. Points are categorized according to EPV ≥ 20, 10 ≤ EPV < 20, and EPV < 10; dashed lines indicate EPV = 10 and EPV = 20. An open marker indicates the study for which the number of final predictors was not reported. Abbreviations: CIP = checkpoint inhibitor pneumonitis; EPV = events per variable; NR = not reported. Please click here to download this file.
Supplementary Figure 2: Alternative displays of the primary meta-analysis. (A) Rainforest display of study-specific and pooled validation C-statistics. (B) Weight-scaled forest display showing the relative contribution of individual studies. (C) Orchard plot summarizing the pooled distribution and uncertainty. (D) Raincloud display showing the distribution of study-level estimates. (E) Power-enhanced funnel plot used for exploratory assessment of small-study effects. Please click here to download this file.
Supplementary Figure 3: Diagnostics for the primary meta-analysis. (A) Drapery plot showing confidence-interval functions across significance levels. (B) Normal Q-Q plot of standardized residuals for assessment of model fit. (C) Leave-one-out and influence diagnostics evaluating the effect of individual studies on the pooled estimate. (D) Egger regression used as an exploratory assessment of small-study effects. Abbreviation: SE = standard error. Please click here to download this file.
Supplementary Figure 4: Sensitivity and stratified analyses of the primary meta-analysis. The ladder plot summarizes the primary estimate, validation-design strata, and prespecified sensitivity analyses, including exclusion of studies judged to be at high consensus risk of bias. Abbreviations: CI = confidence interval; RoB = risk of bias; SE = standard error. Please click here to download this file.
Supplementary Figure 5: Risk-of-bias sensitivity analyses. (A) Comparison of the consensus PROBAST assessment with the stricter initial assessment scenario. (B) Primary meta-analysis after excluding the two studies classified as high risk of bias under the consensus assessment (k = 10; pooled C-statistic 0.84, 95% CI 0.77–0.89). Abbreviations: CI = confidence interval; HK = Hartung-Knapp; PI = prediction interval; PROBAST = Prediction model Risk Of Bias ASsessment Tool; REML = restricted maximum likelihood. Please click here to download this file.
Supplementary Figure 6: Exploratory pooled comparisons. (A) Comparison of the lung-cancer primary pool, pan-cancer supplementary pool, and combined pool. (B) Bivariate pooled operating point with its 95% confidence region in receiver operating characteristic space. Abbreviation: CI = confidence interval. Please click here to download this file.
Supplementary Figure 7: Post-test probabilities across the reported incidence range of checkpoint inhibitor pneumonitis. Post-test probabilities are shown across pre-test probabilities from 5% to 20% using the pooled positive and negative likelihood ratios from the exploratory diagnostic-accuracy analysis. Abbreviations: CIP = checkpoint inhibitor pneumonitis; LR+ = positive likelihood ratio; LR− = negative likelihood ratio. Please click here to download this file.
Table 1: Characteristics of included studies and adjacent-question context reports by pool. The table summarizes outcome type, predictor class, cohort size and split, CIP events, validation design, validation C-statistic, standard-error source, events per variable, and PROBAST assessments. Context rows represent reports addressing adjacent clinical questions that were excluded during screening and are presented for transparency; they were not included in the primary analysis. The PROBAST overall judgments represent consensus between two independent assessors; the stricter initial single-rater assessment is retained as a sensitivity scenario. Percentages represent event rates within the analytic cohort and are not provided for case-enriched, 1:1-matched, or propensity-score-matched designs. Abbreviations: CI = confidence interval; CIP = checkpoint inhibitor pneumonitis; ctrl = control; CV = cross-validation; dev = development cohort; EPV = events per variable; ext = external validation; HM = Hanley-McNeil; ICI = immune checkpoint inhibitor; IIP = ICI-induced pneumonitis; NR = not reported; PROBAST = Prediction model Risk Of Bias ASsessment Tool; PSM = propensity-score matched; RP = radiation pneumonitis; RTP = radiation pneumonitis; SE = standard error; Val C = validation C-statistic. Please click here to download this file.
Table 2: Meta-analysis, subgroup, and sensitivity-analysis results. The table summarizes pooled validation C-statistics, confidence intervals, prediction intervals, heterogeneity estimates, subgroup analyses, sensitivity analyses, validation-design analyses, meta-regression, diagnostic-accuracy analyses, and certainty-of-evidence assessments. Abbreviations: AI = artificial intelligence; CI = confidence interval; CIP = checkpoint inhibitor pneumonitis; DTA = diagnostic test accuracy; HK = Hartung-Knapp; HM = Hanley-McNeil; I2 = percentage of variability attributable to between-study heterogeneity; NSCLC = non-small cell lung cancer; PI = prediction interval; PROBAST = Prediction model Risk Of Bias ASsessment Tool; QM = moderator test statistic; REML = restricted maximum likelihood; RoB = risk of bias; Se = sensitivity; Sp = specificity; SROC = summary receiver operating characteristic; τ2 = between-study variance. Please click here to download this file.
Supplementary Table 1: Database-specific search strategies and search results. Full search strategies for PubMed, Embase, Web of Science Core Collection, CINAHL, and SinoMed are provided, together with the number of records retrieved from each database and the reproducible PubMed verification-search strategy used to assess the currency of the evidence base. Please click here to download this file.
Supplementary Table 2: Full-text exclusion and nonretrieval log. Reports sought for retrieval are documented along with the retrieval status and, where applicable, the primary reason for exclusion. Please click here to download this file.
Supplementary Table 3: PROBAST risk-of-bias and applicability assessments. Item-level assessments for the included studies are presented for both the consensus assessment and the stricter initial assessment scenario, together with domain-specific rationales. Abbreviation: PROBAST = Prediction model Risk Of Bias ASsessment Tool. Please click here to download this file.
Supplementary Table 4: Reconstructed 2 × 2 classification data for the exploratory diagnostic-accuracy analysis. Reconstructed classification data are presented for studies with recoverable information, together with the source or assumption used for each denominator and classification threshold. Please click here to download this file.
Supplementary Table 5: Events-per-variable calculations for the included prediction models. Development-set outcome events, numbers of predictors retained in the final models, and corresponding events-per-variable values are summarized for the included models. Abbreviations: CIP = checkpoint inhibitor pneumonitis; EPV = events per variable. Please click here to download this file.
Supplementary Table 6: Summary of supplementary and sensitivity analyses. Results of the supplementary, subgroup, and sensitivity analyses are summarized together with the corresponding certainty-of-evidence assessments, including the risk-of-bias sensitivity scenario Please click here to download this file.
讨论
In this focused review of CIP-prediction models in lung cancer, ML, CT-radiomics, and clinical models achieved a pooled validation C-statistic of 0.82, reproducing the direction of the broader prior meta-analysis20. The central message, however, is the dispersion rather than the average: heterogeneity was high (I2 = 90.7%) and the 95% prediction interval was wide (0.51–0.95), unexplained by year, event count, or model type, so a model deployed in a new setting could discriminate anywhere from little better than chance to excellently. Imaging-based models were numerically, not significantly, higher than clinical models (0.85 versus 0.78, p = 0.46), a comparison additionally confounded by sample size, outcome definition, validation design, and center; the current evidence cannot establish incremental value for imaging models. Under the consensus dual-review PROBAST, two studies were at high and nine at unclear overall risk of bias—a distribution that chiefly reflects incomplete reporting of blinding, optimism control, and calibration rather than demonstrated flaws; because unreported blinding and low events per variable act in the same upward direction across studies, random-effects pooling does not absorb them, and the pooled estimate should still be read as potentially optimistic, consistent with the exploratory Egger result and the lower trim-and-fill illustration. Excluding the two high-risk studies did not lower the pooled estimate (0.84, k = 10), bounding the quantitative impact of the appraisal disagreement.
The protocol steps most critical to a defensible synthesis were the prespecified separation of clinical questions, the explicit unit of analysis, and the validation-design stratification. Treating occurrence prediction, differentiation from radiation or other pneumonitis, COVID-19 differentiation, radiotherapy-plus-ICI pneumonitis, and generic adverse-event prediction as separate pools prevented incommensurable C-statistics from sharing one interpretive frame; defining one model per study with a prespecified selection rule, recording all alternatives, and quantifying the cost of best-model selection (alternative-model pool 0.81 versus 0.82) bounded selective-reporting bias; and the overlap check that identified the shared Xi'an center behind the only two externally validated studies illustrates why cohort independence cannot be assumed from author lists alone.
Limitations are substantial. The review was not prospectively registered, and although selection, extraction, and appraisal were completed in independent duplicate, the search was designed retrospectively rather than under a registered protocol. A high proportion of reports sought for retrieval could not be obtained (145 of 169, largely conference abstracts and paywalled records without accessible full text); two of these were abstract-level eligible, and bias arising from unavailable full texts cannot be completely excluded. Three pooled standard errors rest on the Hanley-McNeil approximation, one of which (Tao 2026) carries the largest pooled weight; the exploratory 2 × 2 reconstructions embed documented denominator assumptions, one unverifiable; calibration could not be meta-analyzed because slopes, intercepts, and observed-to-expected ratios were reported by no study; and the predominance of single-center retrospective Chinese and US cohorts limits generalizability. These limitations, together with the predominantly unclear risk of bias and two high-risk studies, are why the certainty of evidence is rated low, and very low under the stricter appraisal scenario.
Compared with the prior broader meta-analysis20, this review restricts the primary pool to lung-cancer CIP occurrence, contrasts imaging with clinical predictors under an explicit confounding caveat, quantifies transportability with prediction intervals, prices best-model selection, and applies the standard PROBAST in independent duplicate with an explicit strict-scenario bound — differences that make the headline certainty explicit and raise the reliability of what remains. The differentiation pool (0.90) addresses a genuinely distinct diagnostic dilemma and should not be read as evidence that occurrence prediction works; the exploratory accuracy pool illustrates plausible operating characteristics only under the untested assumption of a fixed transportable threshold.
Future studies should recruit adequately powered incidence cohorts with events-per-variable targets or formal sample-size calculations for model development41; adjudicate CTCAE-graded outcomes independently of the predictors; report discrimination with calibration (slope, intercept, and observed-to-expected ratio) in every cohort; undertake external, ideally multicenter, validation before any clinical claim; follow TRIPOD for reporting and, for radiomics, IBSI-compliant extraction with stability analysis15,16,21; and prospectively register protocols with deposited code and data. Until such models exist, CIP risk prediction in lung cancer should be regarded as a research tool: current models separate risk groups on average, but no model has demonstrated transportable, calibrated performance in independent settings.
披露
The authors have no conflicts of interest to disclose. This review received no external funding. Ethics approval was not required because the work synthesized published aggregate data.
致谢
The authors thank The 988th Hospital of the Joint Logistics Support Force for institutional support and the SciForYou Meta Analysis platform for providing meta-analysis tools. No funding was received for this research.
材料
| 姓名 | 公司 | 目录编号 | 评论 |
|---|---|---|---|
| mada R package | CRAN | Version 0.5-11 | Bivariate diagnostic-accuracy meta-analysis |
| metafor R package | CRAN | Version 5.0-1 | Random-effects meta-analysis and meta-regression |
| R statistical software | R Foundation for Statistical Computing | Version 4.6.1 | Statistical analysis environment |
| SciForYou Meta Analysis | SciForYou | N/A | Meta-analytic data processing and graphical output; all results independently reproduced with the deposited R scripts |
参考文献
- Reck M, et al. Pembrolizumab versus chemotherapy for PD-L1-positive non-small-cell lung cancer. N Engl J Med. 2016;375(19):1823-1833.
- Postow MA, Sidlow R, Hellmann MD. Immune-related adverse events associated with immune checkpoint blockade. N Engl J Med. 2018;378(2):158-168.
- Wang DY, et al. Fatal toxic effects associated with immune checkpoint inhibitors: a systematic review and meta-analysis. JAMA Oncol. 2018;4(12):1721-1728.
- Lin A, et al. The evolving landscape of immunotoxicity: charting mechanisms and future strategies for immune checkpoint inhibitor adverse events. Med Research. 2025;1:322-358.
- Naidoo J, et al. Pneumonitis in patients treated with anti-programmed death-1/programmed death ligand 1 therapy. J Clin Oncol. 2017;35(7):709-717.
- Nishino M, et al. Incidence of programmed cell death 1 inhibitor-related pneumonitis in patients with advanced cancer: a systematic review and meta-analysis. JAMA Oncol. 2016;2(12):1607-1616.
- Suresh K, et al. Pneumonitis in non-small cell lung cancer patients receiving immune checkpoint immunotherapy: incidence and risk factors. J Thorac Oncol. 2018;13(12):1930-1939.
- Schneider BJ, et al. Management of immune-related adverse events in patients treated with immune checkpoint inhibitor therapy: ASCO guideline update. J Clin Oncol. 2021;39(36):4073-4126.
- Zhang Y, et al. A nomogram model for predicting the risk of checkpoint inhibitor-related pneumonitis for patients with advanced non-small-cell lung cancer. Cancer Med. 2023;12(15):15998-16010.
- Hong B, et al. Development and validation of a nomogram for predicting immune-related pneumonitis after sintilimab treatment. Cancer Med. 2024;13(3):e6708.
- Du Y, et al. Radiomics biomarkers to predict checkpoint inhibitor pneumonitis in non-small cell lung cancer. Acad Radiol. 2025;32(3):1685-1695.
- Tan P, et al. Deep learning predicts immune checkpoint inhibitor-related pneumonitis from pretreatment computed tomography images. Front Physiol. 2022;13:978222.
- Lyu Q, et al. Predicting immunotherapy-induced pneumonitis based on chest CT and non-imaging data. Cancers (Basel). 2025;17(18):2980.
- Xie D, et al. Early prediction of immune checkpoint inhibitor-related pneumonitis in advanced non-small cell lung cancer based on primary tumor delta-radiomics features. Front Immunol. 2026;17:1795169.
- Lambin P, et al. Radiomics: the bridge between medical imaging and personalized medicine. Nat Rev Clin Oncol. 2017;14(12):749-762.
- Zwanenburg A, et al. The Image Biomarker Standardization Initiative: standardized quantitative radiomics for high-throughput image-based phenotyping. Radiology. 2020;295(2):328-338.
- Jia X, et al. Predicting checkpoint inhibitors pneumonitis in non-small cell lung cancer using a dynamic online hypertension nomogram. Lung Cancer. 2022;170:74-84.
- Tao D, et al. Nomogram-based prediction of checkpoint inhibitor pneumonitis in lung cancer patients. BMC Cancer. 2026;26(1):373.
- Chen YF, et al. Risk factors and nomogram prediction model for checkpoint inhibitor-related pneumonitis in patients with advanced non-small cell lung cancer. Front Med (Lausanne). 2026;13:1742594.
- Wang S, Wang K, Lin J. Predictive value of machine learning for radiation pneumonitis and checkpoint inhibitor pneumonitis in lung cancer patients: a systematic review and meta-analysis. Sci Rep. 2025;15(1):20961.
- Collins GS, Reitsma JB, Altman DG, Moons KGM. Transparent reporting of a multivariable prediction model for individual prognosis or diagnosis (TRIPOD): the TRIPOD statement. Ann Intern Med. 2015;162(1):55-63.
- Wolff RF, et al. PROBAST: a tool to assess the risk of bias and applicability of prediction model studies. Ann Intern Med. 2019;170(1):51-58.
- Page MJ, et al. The PRISMA 2020 statement: an updated guideline for reporting systematic reviews. BMJ. 2021;372:n71.
- Moons KGM, et al. Critical appraisal and data extraction for systematic reviews of prediction modelling studies: the CHARMS checklist. PLoS Med. 2014;11(10):e1001744.
- Hartung J, Knapp G. A refined method for the meta-analysis of controlled clinical trials with a binary outcome. Stat Med. 2001;20(24):3875-3889.
- IntHout J, Ioannidis JPA, Borm GF. The Hartung-Knapp-Sidik-Jonkman method for random effects meta-analysis is straightforward and considerably outperforms the standard DerSimonian-Laird method. BMC Med Res Methodol. 2014;14:25.
- Riley RD, Higgins JPT, Deeks JJ. Interpretation of random effects meta-analyses. BMJ. 2011;342:d549.
- Hanley JA, McNeil BJ. The meaning and use of the area under a receiver operating characteristic (ROC) curve. Radiology. 1982;143(1):29-36.
- Debray TPA, et al. A framework for meta-analysis of prediction model studies with binary and time-to-event outcomes. Stat Methods Med Res. 2019;28(9):2768-2786.
- Egger M, Davey Smith G, Schneider M, Minder C. Bias in meta-analysis detected by a simple, graphical test. BMJ. 1997;315(7109):629-634.
- Begg CB, Mazumdar M. Operating characteristics of a rank correlation test for publication bias. Biometrics. 1994;50(4):1088-1101.
- Duval S, Tweedie R. Trim and fill: a simple funnel-plot-based method of testing and adjusting for publication bias in meta-analysis. Biometrics. 2000;56(2):455-463.
- Reitsma JB, et al. Bivariate analysis of sensitivity and specificity produces informative summary measures in diagnostic reviews. J Clin Epidemiol. 2005;58(10):982-990.
- Rutter CM, Gatsonis CA. A hierarchical regression approach to meta-analysis of diagnostic test accuracy evaluations. Stat Med. 2001;20(19):2865-2884.
- Guyatt GH, et al. GRADE: an emerging consensus on rating quality of evidence and strength of recommendations. BMJ. 2008;336(7650):924-926.
- Foroutan F, et al. GRADE guidelines 28: use of GRADE for the assessment of evidence about prognostic factors: rating certainty in identification of groups of patients with different absolute risks. J Clin Epidemiol. 2020;121:62-70.
- Qiu Q, et al. Development and validation of a radiomics nomogram using computed tomography for differentiating immune checkpoint inhibitor-related pneumonitis from radiation pneumonitis for patients with non-small cell lung cancer. Front Immunol. 2022;13:870842.
- Cheng J, et al. Differentiation between immune checkpoint inhibitor-related and radiation pneumonitis in lung cancer by CT radiomics and machine learning. Med Phys. 2022;49(3):1547-1558.
- Tohidinezhad F, et al. Computed tomography-based radiomics for the differential diagnosis of pneumonitis in stage IV non-small cell lung cancer patients treated with immune checkpoint inhibitors. Eur J Cancer. 2023;183:142-151.
- Wang P, et al. Distinguishing immune checkpoint inhibitor-related pneumonitis from radiation pneumonitis by CT radiomics features in non-small cell lung cancer. Int Immunopharmacol. 2024;128:111489.
- Riley RD, et al. Minimum sample size for developing a multivariable prediction model: part II - binary and time-to-event outcomes. Stat Med. 2019;38(7):1276-1296.