This protocol enables the reproducible, cost-effective, and highly efficient generation of human neuromyocardial organoids and their application to modeling hypoxia/reoxygenation injury, mitochondrial respiration, and post-injury metabolic recovery in vitro.
方法文章
Human Pluripotent Stem Cell-Derived Neuromyocardial Organoids for Modeling Cardiomyocyte Development and Recovery from Hypoxia/Reoxygenation Injury
本文内容
摘要
摘要
Human induced pluripotent stem cell (hiPSC)-derived organoids have emerged as powerful platforms for modeling human development, disease, and injury responses in vitro. Here, we describe a robust, scalable, and cost-effective protocol for generating neuromyocardial organoids (NMOs) from hiPSCs cultured in three-dimensional (3D) conditions. The protocol combines suspension-based hiPSC maintenance with a stepwise differentiation strategy using chemically defined media formulations to reproducibly co-specify neural and myocardial derivatives within the same organoid. Notably, the protocol relies exclusively on chemically defined, animal-free media and standard, low-cost tissue-culture plasticware, avoiding the ultra-low-attachment plates, anti-adherence coatings, and extracellular matrices required by many existing organoid systems.
The resulting NMOs exhibit spontaneous contractile activity by day 6 and achieve >90% beating efficiency by day 7; they contain multiple cell populations relevant to embryonic development, including cardiomyocytes, neural cells, endothelial cells, and smooth muscle cells. To demonstrate the utility of this organoid platform for injury studies, we further establish a hypoxia/reoxygenation (H/R) injury model in mature (≥30 day), spontaneously beating NMOs. Live Hoechst/Propidium iodide (PI) staining enables longitudinal monitoring of injury-induced cell death in the same organoids, minimizing inter-sample variability. In parallel, real-time oxygen consumption rate (OCR) measurements using a real-time OCR monitoring system allow non-invasive assessment of metabolic and respiratory recovery following injury. Together, this protocol provides an accessible and reproducible platform for studying human multi-lineage tissue development, multicellular cardiac–neural interactions, hypoxic injury, and post-injury metabolic recovery in vitro.
引言
Human induced pluripotent stem cell (hiPSC)-derived organoids have rapidly become important tools for studying human development and disease. By exploiting the intrinsic self-organizing capacity of pluripotent stem cells, these three-dimensional (3D) systems recapitulate key cellular and morphogenetic events that occur during embryogenesis, while providing experimental access that is not feasible in human tissues1,2. In particular, cardiac organoids have gained considerable attention as models of heart development, disease, drug discovery, and tissue maturation, offering several advantages over traditional two-dimensional (2D) cultures and animal models3,4,5,6.
Although substantial progress has been made in cardiac organoid technologies, many existing models lack cellular complexity. The developing heart does not form in isolation; rather, it emerges through continuous interactions with neighboring neural, vascular, and mesenchymal tissues that support morphogenesis, maturation, and function3,4,7. Reproducing these multicellular interactions in vitro is therefore an important step toward creating more physiologically relevant models of human development and disease.
One strategy of particular interest is to steer differentiation toward early multipotent progenitor states that can give rise to both neural and myocardial lineages8,9. By harnessing this shared differentiation capacity, a single self-organizing structure can be directed to generate co-existing neural and mesoderm-derived populations, including cardiac and other cardiovascular derivatives. Inducing such co-differentiation in vitro has, consequently, emerged as an attractive strategy for generating organoids that integrate neural and mesodermal tissues within the same structure8,9.
Recent advances in stem cell engineering have demonstrated that organoids can model increasingly complex aspects of cardiomyogenesis, including tissue patterning, chamber-like organization, vascular development, and multicellular interactions3,4,5,6,7. However, reliable and efficient protocols for generating integrated cardiac and neural tissues in a scalable, experimentally accessible format remain relatively scarce. Most current cardiac organoid protocols depend on specialized culture systems or consumables during organoid formation, such as embedding in basement-membrane matrix3, ultra-low-attachment or anti-adherence-treated plasticware4,5,10, or agitated (orbital shaker or bioreactor) suspension culture6, which add cost and hands-on steps and can limit adoption by laboratories with only basic human pluripotent stem cell (hPSC) culture infrastructure. Systems that avoid these requirements would be particularly useful for investigating how different cell populations interact during development, how these interactions contribute to tissue homeostasis in physiologic and pathologic conditions, and how they influence responses to injury.
Beyond their developmental relevance, cardiac organoids are increasingly being used to model human disease. Among these applications, ischemia–reperfusion injury represents an area of growing interest due to its central role in myocardial infarction and the progression to heart failure11. Despite decades of research, the cellular mechanisms governing tissue damage and recovery following ischemic injury remain incompletely understood. Progress has been hindered, in part, by the limited physiological relevance of conventional cell culture models and by species-specific differences that complicate the interpretation of animal studies. Human multicellular organoids provide an alternative approach, enabling the study of developmental, injury, and repair processes in a controlled 3D environment that more closely recapitulates human tissue architecture.
In this article, we describe a robust and reproducible protocol for generating neuromyocardial organoids (NMOs) from 3D-suspension hiPSC cultures. The method enables efficient and reproducible formation of spontaneously beating organoids containing cardiac, neural, endothelial, and smooth muscle cell lineages. Importantly, the entire workflow uses chemically defined, animal-free media together with standard tissue-culture plasticware, and requires neither ultra-low-attachment plates, anti-adherence coatings, nor extracellular-matrix scaffolds, making it cost-effective to adopt in any laboratory with basic hPSC culture experience.
In addition, we establish a hypoxia/reoxygenation (H/R) injury protocol that combines longitudinal live-cell imaging with real-time monitoring of oxygen consumption rate (OCR) to evaluate metabolic recovery following injury (Figure 1). The protocol is best suited to laboratories that wish to model early human cardiac–neural co-development, or to perform medium-throughput injury, metabolic, and compound-response assays on multicellular cardiac tissue in a 96-well format; it is not intended for studies that require adult-like myocardial maturation, vascular perfusion, or immune components. Together, these approaches provide a versatile platform for studying human multi-lineage tissue development, multicellular cardiac–neural interactions, and cardiac injury and recovery in vitro.
方案
The research described in this protocol was approved by the Research Ethics and Deontology Committee of the Aristotle University of Thessaloniki (EHDE AUTh) under protocol number 16352/2024. The representative results were generated using the SC101A human induced pluripotent stem cell (hiPSC) line, an established, de-identified line obtained commercially (see Table of Materials) and previously used for directed cardiomyocyte differentiation12. No new donor material was collected for the present protocol. Work with established hiPSC cultures was performed in accordance with institutional guidelines and applicable national and European regulations governing the use of human pluripotent stem cells. Perform all processes in a laminar hood, under sterile conditions.
1. 3D human iPSCs
NOTE: Handle and store all media and supplements according to the manufacturer's instructions (see Table of Materials).
- Culture of 3D hiPSCs
- Before starting a differentiation, confirm the identity and pluripotent state of the line: verify identity by short tandem repeat (STR) profiling against the reference profile supplied by the provider, confirm a normal karyotype (G-banding or equivalent) at least every 10 passages, test for mycoplasma monthly, and confirm expression of the pluripotency markers OCT4, NANOG, and stage-specific embryonic antigen-4 (SSEA-4, >90% positive cells by immunocytochemistry or flow cytometry). Use hiPSC-spheroids only from cultures that show compact, round spheroids with smooth borders and no visible spontaneous differentiation.
- Prepare single-use aliquots of supplements to avoid repeated freeze–thaw cycles, and record the lot number of every reagent used in each differentiation so that batch-to-batch comparisons can be made.
- For a 6-well culture containing 2 mL of medium, remove 1 mL of spent medium and add 1 mL of fresh 3D maintenance medium. Repeat the medium change daily until the passaging day.
- On the third day after seeding, measure the hiPSC-spheroid diameter from brightfield images using image analysis software (see Table of Materials). If the mean spheroid diameter is 280–300 µm, proceed to step 1.2.
NOTE: Passage hiPSC-spheroids before they reach 400 µm in diameter, so that stemness is retained and spontaneous differentiation is avoided.
- Passaging of 3D hiPSCs
- Transfer the hiPSC-spheroids from the 6-well plate to a 15 mL conical tube using a P1000 pipette prewetted in Dulbecco's phosphate-buffered saline (dPBS).
NOTE: To avoid mechanical stress to the spheroids, do not use a pipette smaller than P1000. - Wait until the spheroids sink to the bottom of the tube, or centrifuge at 200 × g for 1 min. Carefully discard the supernatant and add 500 µL of cell detachment solution.
- Immediately incubate in a 37 °C water bath for approximately 5 min. Flick the tube every 2 min and return it to the water bath.
- When no more clumps are visible, immediately inactivate the cell detachment solution by adding 2 mL of 3D maintenance medium. Pipette gently to completely dissociate any remaining clumps.
- Centrifuge at 200 × g for 3 min. Discard the supernatant, resuspend the hiPSC pellet in 2 mL of 3D maintenance medium supplemented with 2 µM Thiazovivin, and determine the cell concentration using a hemocytometer.
- Seed 2 × 10⁵ hiPSCs/mL in a new well of a standard tissue-culture-treated 6-well plate, in a final volume of 2 mL of 3D maintenance medium. Add 2 µM Thiazovivin and 2 µL of 3D suspension supplement (1,000×) to achieve a final concentration of 1×.
NOTE: In this protocol, neither ultra-low-attachment plates nor precoating with an anti-adherence solution is needed. - Incubate the hiPSCs in a 37 °C/5% CO2 incubator on a CO2-resistant orbital shaker (19 mm orbit; see Table of Materials) set at 65 rpm.
NOTE: The number of cells plated and the speed of the orbital shaker may vary slightly between cell lines. If needed, titrate the cell number and/or the orbital shaker speed to obtain multiple, size-consistent spheroids with a mean diameter of 280–300 µm 72 h after plating. Shaker speed depends on the orbit diameter; if a shaker with a different orbit is used, re-titrate the speed starting from 65 rpm.
- Transfer the hiPSC-spheroids from the 6-well plate to a 15 mL conical tube using a P1000 pipette prewetted in Dulbecco's phosphate-buffered saline (dPBS).
- Differentiation of 3D hiPSCs into neuromyocardial organoids
- Dissociate 3D hiPSC-spheroids into single cells following steps 1.2.1 to 1.2.5.
- For a full 96-well plate of hiPSC-NMO differentiation, transfer 3 × 10⁵ cells into a new 15 mL conical tube. Add 3 mL of dPBS to dilute the 3D maintenance medium and centrifuge at 200 × g for 3 min.
- Discard all the supernatant and resuspend the cell pellet in 10 mL of differentiation medium I supplemented with 2 µM Thiazovivin and 1× 3D suspension supplement (from a 1,000× stock), to obtain a final concentration of 3 × 10⁴ hiPSCs/mL.
- Seed 100 µL of the cell suspension (3 × 10³ cells) into each well of a U-bottom, 96-well plate with a non-tissue-culture-treated (suspension) surface and centrifuge the plate at 200 × g for 3 min. Incubate in a 37 °C/5% CO2 incubator (no shaking is required).
NOTE: The seeding day is considered Day 0 of NMO differentiation. - On Day 2, prepare differentiation medium II by diluting the differentiation medium II supplement 1:1 with the differentiation medium II diluent. Remove the medium from each well, wash with dPBS, and add 100 µL of differentiation medium II.
- On Day 3, remove 50 µL of medium from each well and add 50 µL of fresh differentiation medium II supplement.
- On Day 4, remove the medium from each well, wash with dPBS, and add 100 µL of differentiation medium III.
- On Day 7, perform a 100% medium change with differentiation medium III.
- On Day 9, remove the medium from each well, wash with dPBS, and add 100 µL of basal maintenance medium. Change the basal maintenance medium every 3 days thereafter.
NOTE: Because the timing of lineage specification is narrow, perform each medium change within the same time window of the day as the initial cell seeding on Day 0. Spontaneous contraction is expected in individual organoids from day 6 and in >90% of organoids by day 7; organoids that are not beating by day 9 should be regarded as failed differentiations (see Results and Figure 2).
2. Characterization of the cellular composition of NMOs
- Immunocytochemical staining
NOTE: Perform all steps of this section in the 96-well plate, and carry out all incubations at 4 °C on a mini rocker set at 30 rpm (see Table of Materials), protected from light.- Fix differentiating NMOs at the stage of interest in 4% paraformaldehyde (PFA) solution for 1 h at 4 °C.
CAUTION: PFA is toxic and a suspected carcinogen; handle it in a fume hood with appropriate personal protective equipment (PPE).
NOTE: At this point, fixed NMOs can be washed twice with 1× Tris-buffered saline (TBS) and stored in 1× TBS at 4 °C until staining; otherwise, proceed to step 2.1.2. - Wash with 1× TBS supplemented with 0.5% Tween-20 (TBST) for 3 × 20 min.
- Block overnight in 1% bovine serum albumin (BSA) diluted in TBST (blocking solution).
- The next day, add the primary antibody diluted in blocking solution (see Table of Materials for antibodies and dilutions) and incubate overnight.
- The next day, wash 3 × 20 min with TBST and add a fluorophore-conjugated secondary antibody. Incubate for 1 h.
- Wash 3 × 20 min with TBST and either add the next primary antibody (repeating steps 2.1.4–2.1.6) or proceed to step 2.1.7.
- Stain the samples with 2 µg/mL 4′,6-diamidino-2-phenylindole (DAPI) diluted in dPBS for 10 min.
- Wash 2 × 5 min with 1× TBS and proceed to imaging.
- Fix differentiating NMOs at the stage of interest in 4% paraformaldehyde (PFA) solution for 1 h at 4 °C.
- Imaging
- Image the organoids in the 96-well plate on a hybrid upright/inverted light-emitting diode (LED) fluorescence microscope equipped with a monochrome camera for fluorescence and a color camera for brightfield (see Table of Materials), using a 4× (numerical aperture [NA] 0.13) plan fluorite objective for whole-organoid views and a 10× (NA 0.30) or 20× (NA 0.45) objective for lineage markers.
- Use the DAPI (excitation 380/30 nm, emission 450/50 nm), fluorescein isothiocyanate (FITC) (470/40 nm, 525/50 nm), Texas Red (560/40 nm, 630/75 nm), and cyanine 5 (Cy5) (630/40 nm, 700/75 nm) LED filter cubes for DAPI, Alexa Fluor 488-conjugated secondary antibodies, PI (section 3.2), and Alexa Fluor 647-conjugated primary antibodies, respectively.
- Set the LED intensity and exposure time for each channel on a secondary-antibody-only control organoid so that the background is just above zero, and keep these settings identical for all organoids within an experiment.
- Capture either single-slice images or z-stacks (10 µm step, spanning the full organoid thickness) using the z-stack module, and save the images as 16-bit TIFF files.
- Perform immunofluorescence analysis using image analysis software (see Table of Materials). For z-stacks, generate maximum-intensity projections in the microscope software before analysis.
- Image the organoids in the 96-well plate on a hybrid upright/inverted light-emitting diode (LED) fluorescence microscope equipped with a monochrome camera for fluorescence and a color camera for brightfield (see Table of Materials), using a 4× (numerical aperture [NA] 0.13) plan fluorite objective for whole-organoid views and a 10× (NA 0.30) or 20× (NA 0.45) objective for lineage markers.
3. Using NMOs to study recovery following H/R injury
- H/R injury
- Hypoxia: Use spontaneously beating NMOs matured for at least 30 days. Wash the NMOs with dPBS and add 100 µL of basal maintenance medium per well. Incubate the 96-well plate in a 37 °C/5% CO2 incubator fitted with an O2 controller set to 1% O2 (N2-balanced; see Table of Materials) for 18 h. Proceed immediately to reoxygenation (step 3.1.2).
- Reoxygenation: Wash the injured NMOs with dPBS and add 100 µL of basal maintenance medium. Return the 96-well plate to the 37 °C/5% CO2 incubator under atmospheric O2 and refresh the medium daily.
- Normoxic control: In every H/R experiment, include time-matched, non-injured control NMOs from the same differentiation. Subject the control NMOs to exactly the same washes and medium changes as in steps 3.1.1 and 3.1.2 but keep them under atmospheric O2 throughout. Use these organoids as the reference for the cell-death and OCR readouts in sections 3.2–3.4.
NOTE: Injury severity can be tuned by varying hypoxia duration or O2 concentration; longer exposures intensify injury but reduce organoid survival during reoxygenation (see Discussion).
- Evaluation of cell death before and after H/R injury (Hoechst/propidium iodide [PI] live double staining)
- Prepare single-use aliquots of Hoechst 33342 and PI at 1 mg/mL by diluting 40 µL of the 25 mg/mL intermediate stocks (in dimethyl sulfoxide, DMSO) in 960 µL of water for injection (WFI) for cell culture.
CAUTION: PI is a potential mutagen, and DMSO is a skin-penetration enhancer; handle with gloves and avoid skin contact. - Immediately before staining, prepare a 2× working cocktail of Hoechst/PI in basal maintenance medium. For 1 mL of working cocktail, add 5 µL of the Hoechst stock and 5 µL of the PI stock to 990 µL of basal maintenance medium (5 µg/mL each).
- Remove the 96-well plate containing the beating NMOs from the incubator. Discard 50 µL of the 100 µL of medium and add 50 µL of the 2× working cocktail, giving a final concentration of 2.5 µg/mL Hoechst 33342 and 2.5 µg/mL PI.
- Return the plate to the incubator and incubate for 30 min.
- After the incubation, remove all the medium from each well and wash once with dPBS.
- Add 100 µL of fresh basal maintenance medium to each well and proceed immediately to imaging (step 3.2.7).
- Perform live imaging on the fluorescence microscope with the settings of step 2.2.1, using the DAPI channel for Hoechst and the Texas Red/tetramethylrhodamine (TRITC) channel for PI. Acquire a brightfield image of each organoid in the same position to record its outline.
- After imaging, return the 96-well plate containing the organoids to the incubator. Repeat the Hoechst/PI staining on the same organoids at each subsequent time point (e.g., before hypoxia, immediately after reoxygenation, and daily thereafter).
NOTE: Repeated staining at the described concentrations allows monitoring of cell death before and after H/R injury in the same organoids, thereby avoiding inter-organoid variability. Under the conditions used here (2.5 µg/mL, 30 min, repeated at ≥24 h intervals), no increase in PI-positive area, loss of spontaneous beating, or morphological change was detected in non-injured NMOs (see Results); toxicity has not been tested for other dyes, concentrations, or staining frequencies. - Import the TIFF files into image analysis software (see Table of Materials), outline each NMO from the brightfield or Hoechst image, apply the same intensity threshold to the PI channel for all samples, and quantify the PI+ area as a percentage of the total organoid area (or of the Hoechst+ area).
- Prepare single-use aliquots of Hoechst 33342 and PI at 1 mg/mL by diluting 40 µL of the 25 mg/mL intermediate stocks (in dimethyl sulfoxide, DMSO) in 960 µL of water for injection (WFI) for cell culture.
- Real-time OCR monitoring after H/R injury
- Perform H/R injury in NMOs as described in section 3.1, including the normoxic control organoids (step 3.1.3).
- Immediately after reoxygenation (step 3.1.2), place the sensing lid of the real-time OCR monitoring system (see Table of Materials) on the 96-well plate containing the injured and control NMOs, dock the plate in the reader, and place the reader in a 37 °C/5% CO2 incubator.
NOTE: The system measures OCR optically, by moving fiber-optic O2 sensors vertically through the medium column of each well and computing the flux from the O2 gradient; no reagent injection is involved and the measurement is non-destructive. If a 32-sensor lid is used, place the organoids only in the wells read by the sensors (columns 3, 4, 9, and 10 of the 96-well plate) and add 100 µL of water or dPBS to all remaining wells to minimize evaporation. Include at least two sensor-read wells containing medium without organoids as background controls. Keep the medium volume at 100 µL per well, as the sensor calibration assumes the volume entered in the software. - In the OCR monitoring software, create a new experiment: assign each well to a group (cell line, treatment: H/R or normoxic control), enter the medium volume (100 µL) and the plate type, and start the recording. Use the system's default sampling interval (one OCR value per well every few min) and record continuously. Record a pre-hypoxia baseline for 8–24 h (overnight) before step 3.1.1, as recommended by the manufacturer, and use this recording for normalization (step 3.3.5).
- Change the medium every day by replacing the full volume with 100 µL of fresh basal maintenance medium in all wells (injured and control).
NOTE: When changing the medium, keep the sensor lid on a spare 96-well plate containing dPBS in the incubator to minimize temperature-related variability in OCR measurements. Each medium change produces a transient drop in OCR that recovers within approximately 4 h; compare time points at least 4 h after a medium change. - Analysis
- Export the OCR values (fmol/s/mm2) from the software.
- Define the baseline OCR of each well as the mean of the last 3–4 values recorded before hypoxia (the overnight baseline recording of step 3.3.3) and express all subsequent values of that well as a percentage of its own baseline.
- Report the mean ± standard error of the mean (SEM) of individual organoids per group, with the number of organoids and independent differentiations, and compare injured with time-matched normoxic control organoids at the same time points.
NOTE: Exclude a well from analysis only if (i) the sensor reports an error or the trace shows a non-physiological step change attributable to the sensor, (ii) the organoid is lost or displaced from the well during a medium change, or (iii) the baseline OCR is below the detection limit of the system; document every exclusion. Because OCR is measured per well and NMO size is uniform within a differentiation, OCR is not routinely normalized to organoid size; if organoids of different sizes are compared, normalize to the projected organoid area measured from a brightfield image taken at baseline.
- Mitochondrial stress test after H/R injury (parallel-well bioenergetic profiling)
NOTE: Perform all steps described in section 3.3, in both non-injured and H/R-injured NMOs.- On the day of interest, after an overnight (8–24 h) baseline recording, prepare 4× working solutions of the electron transport chain (ETC) modulators in pre-warmed basal maintenance medium: oligomycin (for 1 mL, use 4 µL of a 2 mM stock in DMSO), BAM15 (for 1 mL, use 4 µL of a 2.5 mM stock in DMSO), and rotenone/antimycin A (for 1 mL, use 4 µL of each 2 mM stock in DMSO). Prepare a vehicle solution of 0.8% DMSO in basal maintenance medium, matching the highest DMSO content of the working solutions.
CAUTION: Oligomycin, BAM15, rotenone, and antimycin A are mitochondrial toxins; rotenone is also an environmental hazard. Handle the stock solutions with gloves and eye protection inside a fume hood or biosafety cabinet, and dispose of contaminated medium and plasticware as chemical waste according to institutional regulations. - Remove the 96-well plate from the real-time OCR monitoring system and remove 25 µL of spent medium from each NMO well. Divide the NMOs into 4 equal groups (vehicle, oligomycin, BAM15, rotenone/antimycin A; 2–8 organoids per group, depending on the number of sensor-read wells available) and add 25 µL of either the vehicle solution (control group) or one of the three working solutions prepared in step 3.4.1.
NOTE: The final concentrations are 2 µM oligomycin, 2.5 µM BAM15, 2 µM rotenone plus 2 µM antimycin A, with ≤0.2% DMSO in all groups, and the final volume is 100 µL per well. - Replace the sensor lid and return the plate to the reader in the incubator to monitor OCR in real time.
- In the OCR monitoring software, modify the running experiment so that each well is assigned to the corresponding modulator group.
- Record OCR for 6 h, until a stable post-treatment plateau is reached, and then terminate the experiment. Discard the NMOs, or wash once with dPBS and add 100 µL of fresh basal maintenance medium per well if the organoids are to be kept.
- Analysis
- For each well, normalize the mean of the last 3–4 OCR values recorded during the 6 h modulator exposure to the baseline of the same well (the mean of the last 3–4 OCR values recorded before modulator addition) and express the result as a percentage of the vehicle (control) group.
- Derive the respiratory parameters from the group means as follows: total cellular respiration = control; adenosine triphosphate (ATP)-linked respiration = control − oligomycin; proton leak = oligomycin − rotenone/antimycin A; maximal respiration = BAM15; spare respiratory capacity = BAM15 − control; non-mitochondrial respiration = rotenone/antimycin A. Report the number of organoids per group and the number of independent differentiations, and present data as mean ± SEM.
NOTE: For the real-time OCR monitoring system (see Table of Materials), each ETC modulator is applied to a separate group of wells, and the respiratory parameters are read from the comparison between groups after an overnight baseline, rather than from sequential injections into the same well as in plate-reader-based stress tests. The system reads OCR continuously through a sensing lid and has no injection ports. Ensure that the pretreatment OCR lies within approximately 30–100 fmol/s/mm2 and that the posttreatment medium volume is 70–100 µL, so that the response to each modulator is not diffusion-limited. The modulator concentrations used here lie within the manufacturer's recommended ranges (oligomycin 0.5–2 µM, rotenone/antimycin A 0.5–2 µM, BAM15 0.5–2.5 µM); titrate them when applying the protocol to a new line. Because each parameter is derived from group means rather than from sequential responses from the same well, per-organoid values of the derived parameters and paired comparisons are unavailable.
- Statistical analysis
- Treat each organoid as one observation and each independent differentiation as one biological replicate. Compare two groups with a two-tailed unpaired t-test, and repeated measurements of the same organoids over time with repeated-measures one-way analysis of variance (ANOVA) followed by Fisher's least significant difference test; consider p < 0.05 significant.
- On the day of interest, after an overnight (8–24 h) baseline recording, prepare 4× working solutions of the electron transport chain (ETC) modulators in pre-warmed basal maintenance medium: oligomycin (for 1 mL, use 4 µL of a 2 mM stock in DMSO), BAM15 (for 1 mL, use 4 µL of a 2.5 mM stock in DMSO), and rotenone/antimycin A (for 1 mL, use 4 µL of each 2 mM stock in DMSO). Prepare a vehicle solution of 0.8% DMSO in basal maintenance medium, matching the highest DMSO content of the working solutions.
结果
Successful execution of the protocol results in the consistent, efficient generation of NMOs from 3D-cultured hiPSCs (Figure 1A). During differentiation, the spheroid formed in each well of the 96-well plate remains compact and progressively increases in size while undergoing morphological changes (elongation and polarization), consistent with lineage specification (Figure 1B). Spontaneous contraction is first observed on day 6 and is present in all organoids (100%) by day 7 in the differentiation shown (Figure 1C; n = 56 organoids from 5 independent differentiations of the SC101A hiPSC line), demonstrating highly efficient cardiogenic differentiation. The representative results shown here are derived from the SC101A hiPSC line; systematic quantification of line-to-line and batch-to-batch variability was not performed in this Method Article. Immunofluorescence analysis of day-13 differentiating NMOs confirmed the presence of multiple cell populations within the same organoid, including NKX2-5+ cardiomyocytes, TUJ1+ neural cells, CD31+ endothelial cells, and SM22α+ smooth muscle cells (Figure 1D–F). Additional whole-mount immunostaining of a day-9 spontaneously beating NMO showed sarcomeric α-actinin expression within the beating/cardiogenic domain, providing an additional cardiomyocyte structural marker for this domain (Supplementary Figure S1). The simultaneous emergence of these cell types indicates the successful generation of a multicellular organoid containing both cardiovascular and neural derivatives, organized as two well-defined domains within the same 3D structure (Figure 1B, lower-right panel; Figure 1D, right panel). Day 13 organoids were used for this developmental characterization; the maturation status of NMOs has not been experimentally established, and the term 'mature' is used below only to denote organoids cultured for at least 30 days, the stage used for the injury experiments.
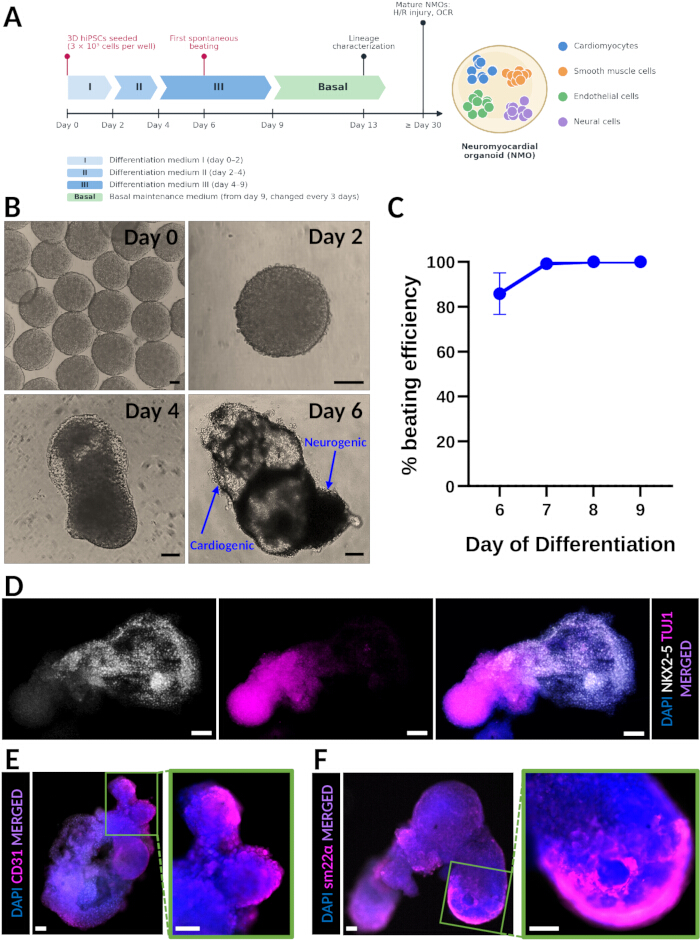
Figure 1. Generation of spontaneously beating NMOs. (A) Schematic of the hiPSC-NMO differentiation protocol (media, medium-change days, first spontaneous beating), the time points used for lineage characterization (day 13) and for injury experiments (≥ day 30), and the lineages generated. (B) Representative brightfield images at the indicated stages of hiPSC-NMO differentiation; the lower-right panel (day 6) shows the cardiogenic and neurogenic domains. (C) Percentage of beating NMOs per day of differentiation, showing 100% beating efficiency by day 7 (n = 56 organoids from 5 independent differentiations of the SC101A line; mean ± SEM). (D) Immunofluorescence analysis of day 13 spontaneously beating hiPSC-NMOs for the cardiomyocyte marker NKX2-5 (left), the neural marker TUJ1 (middle), and the merged image (right), showing the cardiac and neural domains within the same organoid. (E) Endothelial cells (CD31, magenta). (F) Smooth muscle cells (SM22α, magenta). Nuclei are counterstained with DAPI (blue). Scale bars = 100 µm (shown on each image). Abbreviations: hiPSC = human induced pluripotent stem cell; NMO = neuromyocardial organoid; DAPI = 4′,6-diamidino-2-phenylindole; NKX2-5 = NK2 homeobox 5; TUJ1 = class III β-tubulin; CD31 = cluster of differentiation 31; SM22α = smooth muscle protein 22-alpha; SEM = standard error of the mean. Please click here to view a larger version of this figure.
Suboptimal outcomes are recognizable at defined checkpoints (Figure 2). During 3D hiPSC maintenance, spheroids that exceed 400 µm in diameter, or that show irregular borders, cavitation, or dark cores, indicate spontaneous differentiation or necrosis and should not be used for differentiation (Figure 2A). At day 2 of differentiation, wells containing extensive cell death, more than one aggregate, or an aggregate with a ragged outline, result from incomplete single-cell dissociation or inaccurate counting and rarely progress to a single beating organoid (Figure 2B). Organoids that fail to elongate and polarize between days 4 and 7, that remain small, or that shed cells into the medium typically do not beat by day 9 and are considered failed differentiations (Figure 2C); this outcome is most often caused by a deviation in the timing of the medium changes or by seeding an incorrect cell number. During H/R experiments, organoids that detach from the well bottom during washes, or that show PI staining in more than approximately half of their area immediately after reoxygenation, will usually not recover and should be excluded from OCR analysis.
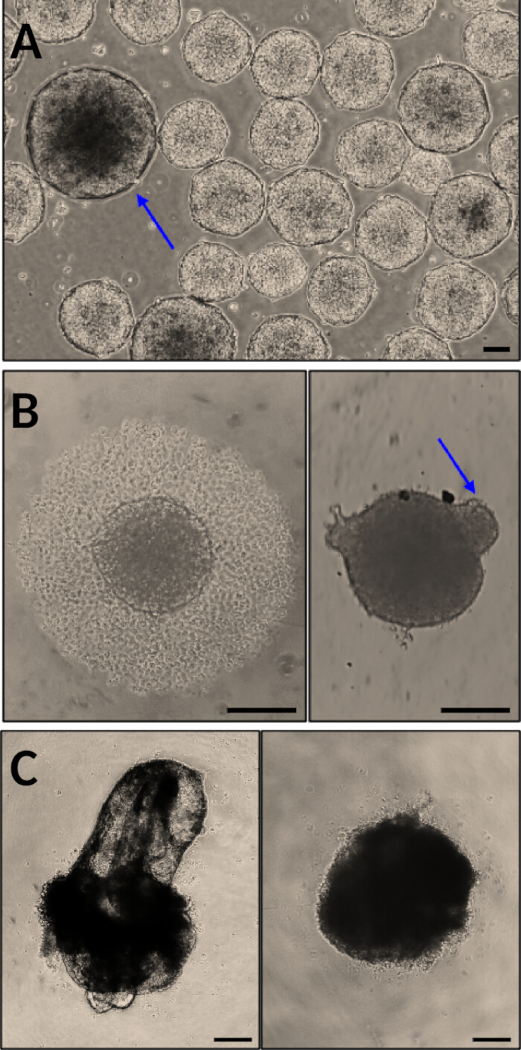
Figure 2. Representative suboptimal outcomes and how to recognize them. (A) hiPSC-spheroids suitable for differentiation compared with oversized (>400 µm) spheroids showing irregular borders and dark cores (blue arrow), which should not be used. (B) Day-2 wells containing a single compact aggregate with extensive cell death (left) or multiple aggregated spheroids after incomplete dissociation (right, blue arrow). (C) A successfully differentiated, beating day-9 NMO (left) compared with a failed, non-beating organoid that did not elongate or polarize (right). Brightfield images. Scale bars = 100 µm. Abbreviations: hiPSC = human induced pluripotent stem cell; NMO = neuromyocardial organoid. Please click here to view a larger version of this figure.
To investigate the applicability of NMOs as a model of human cardiac injury and post-injury recovery, we subjected mature (≥30 day), spontaneously beating organoids to H/R injury (Figure 3A). Exposure to hypoxic conditions (1% O2) for 18 h significantly increased PI incorporation compared with time-matched, non-injured NMOs from the same differentiation, indicating successful induction of cell death by the H/R injury protocol (Figure 3B). Spontaneous contraction of a time-matched normoxic control NMO and of an NMO 24 h after H/R injury is shown in Supplementary Video S1; beating persists after injury, and the video is provided as a qualitative record of contractile activity rather than as a quantitative functional readout. Because the Hoechst/PI double live staining can be repeated on the same organoids, this approach enables longitudinal monitoring of injury progression and recovery while minimizing inter-organoid and batch-to-batch variability; under the conditions described, repeated staining of non-injured NMOs did not detectably increase the PI-positive area or affect spontaneous beating. Quantification of the PI-positive area confirmed a significant increase in cell death in H/R-injured compared with non-injured NMOs (Figure 3C; n = 4 organoids per group from two independent differentiations; mean ± SEM; unpaired two-tailed t-test, p < 0.05).
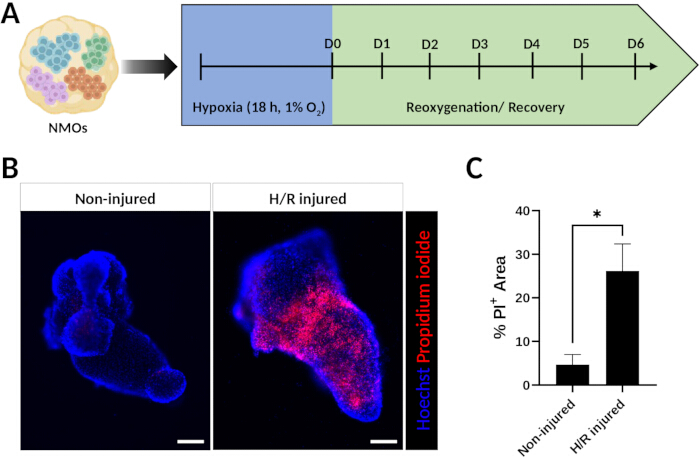
Figure 3. H/R injury and longitudinal monitoring of cell death in NMOs. (A) Schematic of the H/R injury protocol. (B) Representative live-cell fluorescence images of non-injured (left) and H/R-injured (right) hiPSC-NMOs after Hoechst (blue)/PI (red) double staining. (C) Quantification of the PI+ area as a percentage of the organoid area in non-injured and H/R-injured NMOs (n = 4 organoids per group from two independent differentiations; mean ± SEM; unpaired two-tailed t-test; *p < 0.05). Scale bars = 100 µm (shown on each image). Abbreviations: H/R = hypoxia/reoxygenation; NMO = neuromyocardial organoid; O2 = oxygen; D = day; PI = propidium iodide; SEM = standard error of the mean. Please click here to view a larger version of this figure.
We further demonstrate the assessment of the metabolic response of H/R-injured NMOs by real-time OCR monitoring (Figure 4A). Following hypoxic exposure, organoids exhibited a marked reduction in OCR (to 54.5% of baseline), reflecting impaired respiratory activity. During the reoxygenation phase, OCR progressively increased toward baseline, indicating recovery of cellular respiration (Figure 4B,C). To further characterize the respiratory alterations caused by H/R injury, we profiled mitochondrial respiration in time-matched non-injured and H/R-injured NMOs from the same differentiation using the parallel-well mitochondrial stress test with oligomycin, BAM15, and rotenone/antimycin A (Figure 4D,E); the non-injured organoids, maintained under normoxia and subjected to the same medium changes, serve as the normoxic reference for the injured group. H/R-injured NMOs showed an altered respiratory profile relative to non-injured organoids, further confirming the successful induction of injury by the protocol (Figure 4D,E).
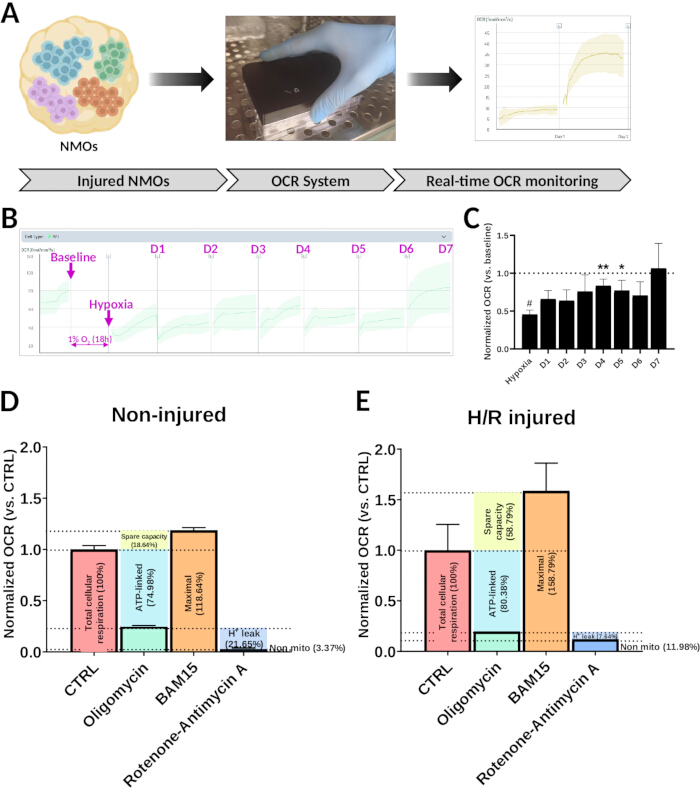
Figure 4. Real-time OCR monitoring of metabolic recovery following H/R injury in NMOs. (A) Schematic of real-time OCR monitoring in H/R-injured hiPSC-NMOs. (B) Representative real-time OCR trace of H/R-injured NMOs, showing the baseline, the fall in OCR after hypoxia, and its progressive recovery during reoxygenation (D1–D7). (C) Quantification of the data shown in (B), expressed as a fraction of each organoid's own pre-hypoxia baseline (n = 8 organoids from one differentiation; mean ± SEM; repeated-measures one-way ANOVA with Fisher's least significant difference test; #p < 0.05 vs. baseline, *p < 0.05 vs. hypoxia, **p < 0.01 vs. hypoxia). (D,E) Parallel-well mitochondrial stress test (control, oligomycin, BAM15, rotenone/antimycin A) in time-matched non-injured (D) and H/R-injured (E) NMOs from the same differentiation, expressed as a fraction of the control group after normalization to each well's own baseline; the derived parameters (total, ATP-linked, maximal, spare, proton leak, non-mitochondrial respiration) are indicated (n = 2 organoids per group from one differentiation; mean ± SEM; descriptive statistics only). OCR reflects the respiration of the whole multicellular organoid and is not specific to cardiomyocytes. Abbreviations: OCR = oxygen consumption rate; H/R = hypoxia/reoxygenation; NMO = neuromyocardial organoid; D = day; CTRL = control; ATP = adenosine triphosphate; H+ = proton; SEM = standard error of the mean; ANOVA = analysis of variance. Please click here to view a larger version of this figure.
Together, these representative results demonstrate that the described methodology reproducibly generates multicellular, spontaneously beating neuromyocardial organoids that can be used to study human multi-lineage differentiation and hypoxia-induced injury, while enabling real-time, non-destructive monitoring of metabolic recovery and mitochondrial respiration following injury.
Supplementary Figure S1. Sarcomeric α-actinin immunostaining of hiPSC-NMOs. Whole-mount immunofluorescence of a day-9 spontaneously beating NMO stained for sarcomeric α-actinin (orange) with DAPI counterstain (blue); 10× objective. Sarcomeric α-actinin staining is localized to the beating/cardiogenic domain of the organoid. Scale bar = 200 µm. Abbreviations: hiPSC = human induced pluripotent stem cell; NMO = neuromyocardial organoid; DAPI = 4′,6-diamidino-2-phenylindole; sarc. = sarcomeric. Please click here to download this file.
Supplementary Video S1. Spontaneous contraction of a normoxic control NMO and of an NMO 24 h after H/R injury. Live fluorescence recordings of spontaneously beating, ≥30-day hiPSC-NMOs: a time-matched normoxic control (left) and an organoid 24 h after reoxygenation (right). The PI channel (red) is shown first, followed by the Hoechst 33342 channel (blue) of the same organoids. 10× objective; recorded and played back in real time (60 frames/s). Abbreviations: NMO = neuromyocardial organoid; H/R = hypoxia/reoxygenation; hiPSC = human induced pluripotent stem cell; PI = propidium iodide. Please click here to download this file.
讨论
This protocol provides a reproducible approach for generating human iPSC-derived NMOs and for subsequently using these organoids to study cell death and metabolic recovery following H/R injury. Several steps are particularly important for achieving consistent differentiation outcomes. First, maintaining hiPSCs as size-controlled 3D spheroids is critical, as aggregate size has been shown to influence lineage specification, nutrient diffusion, and differentiation efficiency in pluripotent stem cell cultures1,2. In our experience, spheroids should be passaged before reaching 400 µm in diameter, while maintaining a mean diameter of 280–300 µm at the start of differentiation. Excessively large spheroids frequently display spontaneous differentiation and increased heterogeneity, whereas smaller aggregates may result in reduced organoid formation efficiency. Likewise, strict adherence to the differentiation timeline is essential because the signaling events governing early lineage specification occur within a narrow developmental window8,9,10. Even minor deviations in the timing of medium changes may significantly affect the balance between neural and mesodermal lineage commitment; the practical readout of such a failure is the absence of spontaneous contraction by day 9 (Figure 2).
Several modifications and troubleshooting approaches can be implemented when adapting the protocol to new hiPSC lines. Although the described conditions were optimized to produce highly uniform organoids, different cell lines may exhibit variations in growth kinetics, aggregation behavior, and differentiation potential. Optimization of the initial seeding density and orbital shaker speed during hiPSC expansion may therefore be necessary to obtain consistently sized spheroids. Similarly, incomplete dissociation during passaging can lead to heterogeneous aggregate formation and variable differentiation outcomes. Gentle but thorough single-cell dissociation is therefore recommended, while avoiding excessive mechanical stress, which can compromise cell viability. During the H/R injury phase, injury severity can be adjusted by varying hypoxia duration or O2 concentration, depending on the experimental objectives. Longer hypoxic exposures may intensify the injury but can also reduce organoid survival and impair metabolic recovery during the reoxygenation phase.
A major advantage of this method is the ability to generate organoids containing multiple developmentally relevant cell populations within a single self-organizing structure. Compared with cardiac organoid protocols that focus on cardiomyocyte generation, the present approach produces organoids containing cardiac, neural, endothelial, and smooth muscle cell populations, thereby more closely resembling the cellular complexity observed during embryonic development3,4,5,6. Directing differentiation through an early common progenitor pool provides a developmental basis for the coordinated generation of both neural and mesodermal derivatives and represents an important distinction from protocols based exclusively on cardiac mesoderm induction8,9,10. Importantly, the use of static suspension culture in standard 96-well plates, without extracellular matrices, ultra-low-attachment plates, or anti-adherence pre-treatment solutions, distinguishes this protocol from heart-forming organoids, which are embedded in basement-membrane matrix3, from cardioids and self-assembling heart organoids, which are formed in ultra-low-attachment plates4,5, and from gastruloid-type cardiac organoids10, and makes it cost-effective and suitable for larger studies and screening applications. In addition, all differentiation steps rely on chemically defined, animal-free media, which support batch-to-batch consistency and regulatory compatibility. Because the differentiation (protocol section 1.3) starts from a single-cell suspension, hPSCs maintained in conventional adherent (2D) culture can also be dissociated and seeded directly at protocol step 1.3.2, in which case the orbital shaker, which is used here only for 3D hPSC maintenance (protocol sections 1.1–1.2), is not required; the 2D maintenance route itself is not detailed in the present protocol.
An additional strength of the protocol is the integration of longitudinal functional and metabolic readouts. Hoechst/PI live staining allows repeated assessment of injury-induced cell death in the same organoids over time, reducing the variability associated with endpoint analyses and batch-to-batch differences. Likewise, continuous OCR monitoring allows non-invasive evaluation of metabolic recovery following injury, and the parallel-well mitochondrial stress test provides the principal respiratory parameters in a format suited to continuous, lid-based recording. Since metabolic remodeling is closely linked to cardiomyocyte survival and tissue repair, real-time OCR measurements can provide information inaccessible with conventional endpoint assays11. It should be emphasized, however, that OCR is a property of the whole multicellular organoid. An increase in OCR during reoxygenation indicates recovery of oxygen consumption and cellular metabolic activity after hypoxic injury, but it cannot be attributed specifically to cardiomyocytes.
Despite these advantages, several limitations should be considered. As with most current organoid systems, NMOs do not fully recapitulate the anatomical organization, biomechanical environment, vascular perfusion, or systemic regulation present in vivo1,7. Variability between hiPSC lines remains an inherent challenge in pluripotent stem cell-based models and may influence differentiation efficiency, cellular composition, and injury responses; the representative results presented here derive from the SC101A hiPSC line, and line-to-line variability should be addressed through titration of cell densities and compound concentrations at the steps indicated above. The cellular characterization presented is limited to representative immunostaining for lineage markers; quantification of cell-type composition and of the maturation status of the cardiomyocytes has not been performed. The H/R injury model reproduces key aspects of ischemia–reperfusion injury but cannot capture the complex inflammatory and immune responses that occur following myocardial infarction in vivo. Consequently, observations generated using this platform should be interpreted as mechanistic insights into human tissue responses rather than as direct representations of clinical pathology.
The methodology described here may be broadly applicable to several areas of biomedical research. The NMO platform can be used to investigate human multi-lineage differentiation, cardiac–neural interactions, and mechanisms governing multicellular tissue organization. In addition, the H/R injury paradigm provides a human-specific model for studying hypoxic injury and post-injury metabolic recovery, supporting applications in disease modeling, drug discovery, cardiotoxicity testing, and regenerative medicine research. Future refinements incorporating additional cell types, cardiomyocyte-specific readouts, and advanced maturation strategies may further enhance the model's physiological relevance and expand its utility for translational cardiovascular research.
披露
K.E.H. is a co-founder, CEO, and shareholder of KosBio P.C. (Thessaloniki, Greece); A.D. is its Director of Research Operations. KosBio develops and commercializes the organoid media, supplements, and differentiation kit used here. Their compositions are trade secrets of KosBio and are not disclosed in this article; the materials are available to qualified academic and non-profit investigators for non-commercial research use under a Material Transfer Agreement, on reasonable request to the corresponding author. The authors declare no other competing interests. Generative artificial intelligence (AI) tools were used to assist with language editing of the manuscript text and with drafting the schematic in Figure 1A; no AI tool was used to generate, analyze, or alter experimental data or images. The authors reviewed and edited all AI-assisted text and take full responsibility for the article's content.
致谢
This work was conducted and funded by KosBio P.C. The authors thank colleagues at KosBio P.C. and Aristotle University of Thessaloniki for helpful discussions and technical support.
材料
| 姓名 | 公司 | 目录编号 | 评论 |
|---|---|---|---|
| Accutase solution | Sigma-Aldrich | A6964 | referred as "cell detachment solution" |
| Albumin, Bovine Serum [BSA], Fraction V | Biomatik | A2134 | |
| Alexa Fluor 488 donkey anti-rabbit IgG (H+L) | Thermo Fisher Scientific | A21206 | 1:500 dilution in 1% BSA TBST 1% |
| Alexa Fluor 568 Donkey Anti-Mouse IgG | Thermo Fisher Scientific | A10037 | 1:500 dilution in 1% BSA TBST 1% |
| Antimycin A | Sigma-Aldrich | A8674 | 2 mM stock in DMSO; 2 µM final (step 3.4.2) |
| BAM15 | Selleck | S0411 | 2.5 mM stock in DMSO; 2.5 µM final (step 3.4.2) |
| beta3-Tubulin XP Rabbit mAb | CST | 5568 | clone D71G9; referred to as TUJ1; use 1:200 |
| BioSpherix Proox 360 Controller | BioSpherix | Proox 360 | O2 controller for the hypoxia step (1% O2, N2-balanced; step 3.1.1); referred to as "O2 controller" |
| CO2 Resistant Orbital Shaker | Thermo Scientific | 88881102 | 19 mm orbit; set at 65 rpm inside the CO2 incubator (step 1.2.7) |
| CO2 Resistant Orbital Shaker Rubber Platform | Thermo Scientific | 88881123 | |
| DAPI Dihydrochloride Salt | Biotium | 40011 | 2 µg/mL in dPBS (step 2.1.7) |
| Dimethyl sulfoxide (DMSO), cell-culture grade | Pan Biotech | P60-36720100 | solvent for Hoechst, PI, thiazovivin and ETC modulator stocks; vehicle control 0.2% final |
| Dulbecco's Phosphate Buffered Saline | Biowest | L0615-1000 | |
| GraphPad Prism | GraphPad Software | n/a | version 8; statistical analysis and plotting (step 3.4.7) |
| Hoechst 33342 trihydrochloride | Targetmol | T4930 | CAS 875756-97-1; 25 mg/mL stock in DMSO |
| Idolyon Neuromyocardial Organoid Differentiation Kit | KosBio P.C. | OrganoMax | components referred to as "differentiation medium I", "differentiation medium II supplement" and "diluent", "differentiation medium III" and "basal maintenance medium"; ready to use; https://kosbio.com/shop |
| Idolyon Suspend-3D 1000X Concentrate | KosBio P.C. | Idolyon Suspend-3D | referred as "3D suspension supplement (1000x)"; Ready for use, https://kosbio.com/shop. |
| ImageJ/Fiji | NIH (open source) | n/a | referred to as "image analysis software" (steps 1.1.4, 2.2.2, 3.2.9) |
| LED filter cubes: DAPI (380/30, 450/50), FITC (470/40, 525/50), Texas Red (560/40, 630/75), Cy5 (630/40, 700/75) | Discover ECHO | CUBE6001, CUBE6002, CUBE6004, CUBE6005 | for the Revolve R4; bands given in step 2.2.1 |
| Mini rocker MR-1 | Kisker Biotech | MR-1 | 30 rpm at 4 °C for all immunocytochemistry incubations (NOTE, section 2.1) |
| NKX2.5 Rabbit mAb (Alexa 647) | CST | 92925 | clone E1Y8H, Alexa Fluor 647 conjugate; use 1:500; imaged with the Cy5 cube |
| Anti-Sarcomeric Alpha Actinin antibody [EA-53] | Abcam | ab9465 | Use 1:1000 |
| Objectives: 4× plan fluorite NA 0.13; 10× plan fluorite NA 0.30; 20× plan fluorite LWD NA 0.45 | Discover ECHO | JMAG0043, JMAG0103, JMAG0203 | for the Revolve R4 (step 2.2.1) |
| Oligomycin | Targetmol | T21494 | 2 mM stock in DMSO; 2 µM final (step 3.4.2) |
| Paraformaldehyde 16% Solution | Electron Microscopy Sciences | 15710 | diluted to 4% in dPBS (step 2.1.1) |
| PluriKB-3D (Standard) | KosBio P.C. | PluriKB-3D | referred as "3D maintenance medium"; Ready for use, https://kosbio.com/shop. |
| Propidium Iodide | Targetmol | T7290 | CAS 25535-16-4; 25 mg/mL stock in DMSO |
| Rb pAb to CD31 | abcam | ab32457 | use 1:100 |
| Rb pAb to SM22 alpha | abcam | ab14106 | use 1:3000 |
| Resipher real-time OCR monitoring system (32-sensor) | Lucid Scientific | NS32 | referred to as "real-time OCR monitoring system"; reader docked in a CO2 incubator (step 3.3.2) |
| Resipher sensing lid | Lucid Scientific | NS32-108A | 32-sensor lid; organoids in columns 3, 4, 9 and 10 (NOTE after step 3.3.2) |
| Resipher software (web application) | Lucid Scientific | n/a | referred to as "OCR monitoring software" (steps 3.3.3, 3.4.4); exports OCR in fmol/s/mm2 |
| Revolve R4 hybrid upright/inverted LED fluorescence microscope | Discover ECHO | RVSF1000 | 5 MP monochrome (fluorescence) and 12 MP color (brightfield) cameras; referred to as "hybrid upright/inverted LED fluorescence microscope" (step 2.2.1) |
| Rotenone | Targetmol | T2970 | 2 mM stock in DMSO; 2 µM final (step 3.4.2) |
| SC101A hiPSC line | System Biosciences | SC101A-1 | hiPSC line used for the representative results (Figure 1C); origin and approvals as in ref. 12 |
| TC Plate 96 Well, Suspension, R | Sarstedt | 83.3925.500 | U-bottom, non-tissue-culture-treated (suspension) surface; referred to as "96-well plate with a non-tissue-culture-treated (suspension) surface" (step 1.3.4) |
| Thiazovivin | Biosynth | FT28209 | dissolved in DMSO; 2 µM final |
| Tips P10 | AHN | 1-002-50-0 | |
| Tips P1000 | AHN | 1-202-50-2 | |
| Tips P200 | AHN | 1-121-50-1 | |
| Tissue culture 6-well plates | TPP | 92106 | |
| Tween-20 | Sigma-Aldrich | P7949 | |
| WFI for Cell Culture | Gibco | A12873-01 | |
| Z-stack software module | Discover ECHO | ESZS8000 | z-stacks and maximum-intensity projections (steps 2.2.1–2.2.2) |
参考文献
- Lancaster MA, Knoblich JA. Organogenesis in a dish: modeling development and disease using organoid technologies. Science. 2014;345(6194):1247125.
- Rossi G, Manfrin A, Lutolf MP. Progress and potential in organoid research. Nat Rev Genet. 2018;19(11):671-87.
- Drakhlis L, et al. Human heart-forming organoids recapitulate early heart and foregut development. Nat Biotechnol. 2021;39(6):737-46.
- Hofbauer P, et al. Cardioids reveal self-organizing principles of human cardiogenesis. Cell. 2021;184(12):3299-317.e22.
- Lewis-Israeli YR, et al. Self-assembling human heart organoids for the modeling of cardiac development and congenital heart disease. Nat Commun. 2021;12(1):5142.
- Sahara M. Recent advances in generation of in vitro cardiac organoids. Int J Mol Sci. 2023;24(7):6244.
- Brand T. Now it’s getting bloody in cardiac organoids. Nat Cell Biol. 2024;26(11):1830-1.
- Henrique D, Abranches E, Verrier L, Storey KG. Neuromesodermal progenitors and the making of the spinal cord. Development. 2015;142(17):2864-75.
- Gouti M, et al. In vitro generation of neuromesodermal progenitors reveals distinct roles for Wnt signalling in the specification of spinal cord and paraxial mesoderm identity. PLoS Biol. 2014;12(8):e1001937.
- Olmsted ZT, Paredes-Espinosa MB, Paluh JL. Generation of human elongating multi-lineage organized cardiac gastruloids. STAR Protoc. 2022;3(4):101898.
- Bissoli I, et al. Modeling heart failure by induced pluripotent stem cell-derived organoids. Biochim Biophys Acta Mol Basis Dis. 2025;1871(6):167861.
- Wanschel AC, et al. Oxygen-independent, hormonal control of HIF-1α regulates the developmental and regenerative growth of cardiomyocytes. bioRxiv DOI https://doi.org/10.1101/2022.01.31.478572. 2022.
重印与许可
本文已发表
视频即将推出