In this retrospective cohort, CGF use was associated with improved clinical and radiographic outcomes, root development parameters, pulp sensibility responses, and masticatory function in immature permanent teeth with traumatic pulp necrosis. These findings should be considered preliminary and hypothesis-generating, and they warrant further evaluation in prospective controlled studies.
研究文章
Concentrated Growth Factor in Pulp Revascularization for Young Permanent Teeth with Traumatic Pulp Necrosis: A Retrospective Controlled Study
* These authors contributed equally
本文内容
摘要
摘要
Concentrated Growth Factor (CGF), a platelet-derived biomaterial, has shown promise in tissue regeneration. This retrospective, non-randomized controlled study evaluated the clinical efficacy of CGF combined with pulp revascularization in immature permanent teeth with traumatic pulp necrosis. A total of 102 teeth treated between April 2022 and March 2024 were allocated to a control group (pulp revascularization alone, n = 51) or a CGF group (pulp revascularization combined with CGF, n = 51) based on the treatment actually received. Follow-up occurred at 3, 6, and 12 months. At 12 months, the CGF group showed higher clinical (100% vs. 88.24%, P = 0.027) and radiographic success rates (98.04% vs. 84.31%, P = 0.031), greater improvements in root development parameters (all P < 0.05), and a higher rate of positive pulp sensibility response (88.24% vs. 68.63%, P = 0.016). The CGF group also showed higher CBCT gray values of newly formed intracanal tissue, greater mineralized tissue deposition, higher bite force and masticatory efficiency, and lower postoperative IL-1β, IL-6, and TNF-α levels (all P < 0.05). Within the limitations of this retrospective study, CGF combined with pulp revascularization was associated with improved clinical and radiographic outcomes, greater root development, and better functional recovery. These preliminary findings require confirmation in prospective studies with larger samples and longer follow-up. Because no histological evaluation was performed, the observed improvements should be interpreted as evidence of repair rather than histologically confirmed regeneration.
引言
Pulp necrosis in young permanent teeth is a common yet complex dental condition. Its primary etiological factors include dental caries, trauma, and cracked teeth, which can lead to irreversible damage to the pulp tissue, subsequently triggering pulp necrosis1. Traditional root canal therapy aims to preserve the affected tooth by eliminating necrotic pulp and obturating the root canal system; Nevertheless, considering that the root formation of young permanent teeth remains incomplete, with the apical foramen remaining unclosed and the root canal walls being thin and fragile, the outcomes of mechanical instrumentation and root canal disinfection are often unsatisfactory, which can easily result in problems such as root canal blockage or perforation2. Therefore, how to effectively promote root canal growth and functional recovery in young permanent teeth stands as one of the pressing challenges that modern endodontics is striving to address.
Currently, the traditional treatment approaches for pulp necrosis in young permanent teeth primarily encompass apexification and apical barrier technique3. Apexification involves the use of calcium hydroxide to induce apical closure, thereby forming a hard tissue barrier to seal the apical foramen4. On the other hand, the apical barrier technique employs biocompatible materials such as mineral trioxide aggregate (MTA) to directly occlude the apical region, creating an artificial barrier followed by root canal obturation5. However, existing research indicates that although the calcium hydroxide-induced root development method demonstrates definite efficacy, it also has notable limitations. This technique necessitates a treatment duration of 6 to 18 months to achieve apical closure, and regular follow-up visits every 3 months are required during the treatment process to evaluate barrier formation. This places high demands on patient compliance6. Moreover, the prolonged exposure to calcium hydroxide may have a detrimental impact on the mechanical properties of dentin, thereby increasing the risk of root fracture7.
Pulp revascularization is a novel regenerative endodontic procedure that has emerged in recent years. The core mechanism involves triggering the development of blood clots inside the root canal, which act as scaffolds for the remaining dental pulp stem cells and consequently facilitate reparative tissue formation and the ongoing maturation of the root canal8. Compared with traditional root canal therapy, pulp revascularization offers advantages such as simple operation, a shorter treatment course, and fewer complications, and it demonstrates favorable potential for clinical application in the treatment of pulp necrosis in young permanent teeth9. The success of pulp revascularization hinges critically on the formation of a high-quality blood clot within the root canal following apical bleeding10. As a natural biological scaffold, the blood clot not only provides three-dimensional structural support for the root canal system but is also rich in various pluripotent stem cells and growth factors, creating an essential microenvironment for the regeneration of the pulp-dentin complex11. Previous studies have suggested that suboptimal blood clot formation within the root canal may impair stem cell behaviors such as migration, proliferation, and differentiation, and may reduce the clinical success rate of pulp revascularization12.
Recently, in light of the constraints associated with traditional blood clot scaffolds, such as inadequate bleeding volume, uncontrollable clotting time, and imprecise spatial localization, tissue engineering strategies have proposed various modified approaches13. Among them, Concentrated Growth Factor (CGF) has garnered significant attention due to its unique biological properties14. CGF is prepared through gradient centrifugation technology and is rich in high concentrations of platelets, leukocytes, and a fibrin network structure, and it additionally encompasses an array of growth factors and cytokines that contribute to tissue regeneration and repair15. Given its favorable biological characteristics, relative ease of acquisition, and straightforward preparation, CGF has been increasingly applied in regenerative therapies within the field of stomatology in recent years, such as periodontal tissue regeneration and peri-implant bone tissue regeneration16,17. Although CGF has exhibited significant potential for tissue regeneration in both clinical and biotechnological contexts, its application in pulp revascularization has been less frequently documented18. The aim of this research is to assess the clinical effectiveness of CGF in pulp revascularization procedures for young permanent teeth affected by traumatic pulp necrosis, and to examine its influence on root development and functional recovery of these teeth.
方案
This study was approved by the Ethics Committee of the Second Affiliated Hospital of Guizhou University of Traditional Chinese Medicine (Approval number: Lw20260327). This was a retrospective study using existing clinical records, routinely collected laboratory data, and routinely collected radiographic and imaging data. The requirement for additional prospective research consent was waived by the Ethics Committee. However, written informed consent for clinical treatment had already been obtained from the parents or legal guardians of all pediatric patients before treatment. In addition, child assent was obtained from children who were mature enough to understand the nature of the treatment, in accordance with ethical principles for pediatric research. For CGF preparation, venous blood collection was performed only in the CGF group as part of the clinically selected treatment, after parental consent and child assent. Serum cytokine measurements were performed on peripheral venous blood collected during routine clinical follow-up; no blood was drawn solely for research purposes. CBCT examinations were performed only when clinically indicated for diagnosis and follow-up of traumatized immature permanent teeth, not solely for research purposes. Bite-force testing and masticatory-efficiency testing were also performed as part of routine clinical functional assessment and were retrieved retrospectively from the clinical records.
This retrospective, non-randomized controlled clinical study included 102 young permanent teeth patients (102 teeth), aged 6–12 years, with traumatic pulp necrosis admitted to our hospital from April 2022 to March 2024. The study was designed and conducted retrospectively; patients were not randomly assigned to treatment groups. Patients were allocated to either the control group or the CGF group based on the actual treatment they received, which was determined jointly by the treating dentist and the patients' parents or legal guardians after full discussion, taking into account factors such as clinical indications, treatment preferences, economic affordability, and willingness to undergo venous blood collection for CGF preparation. Willingness to undergo venous blood collection was therefore one factor that could influence the selection of CGF treatment, but it was not the sole or deterministic allocation criterion. The final group assignment was based on the treatment actually received: pulp revascularization alone in the control group and pulp revascularization combined with CGF in the CGF group. To reduce the influence of measurable differences between groups, strict inclusion and exclusion criteria were applied, baseline characteristics were compared to assess comparability between groups, all clinical procedures were performed by the same experienced dentist, and radiographic evaluations were conducted independently by two blinded oral radiologists. However, because treatment allocation was not randomized and was based on clinical judgment and patient/family preferences, selection bias and residual confounding by unmeasured variables cannot be excluded. The baseline comparison, therefore, demonstrates only that the measured baseline variables were similar between groups and does not establish that selection bias was controlled. The control group received pulp revascularization alone, while the CGF group received pulp revascularization combined with CGF.
The inclusion criteria were as follows: patients aged 6–12 years; diagnosed with pulp necrosis resulting from trauma; having teeth with incomplete root development; free from systemic diseases that could affect the treatment; patients and their parents providing informed consent for the treatment, demonstrating good compliance, and being able to attend scheduled follow-up visits for 12 months. The exclusion criteria included: teeth with complete avulsion or root fracture; patients with allergies to the drugs and reagents used in the treatment; cases with incomplete imaging data or poor-quality imaging films that rendered measurement impossible; patients in poor physical condition with severe organic diseases; those with upper jaw malocclusion; patients with coagulation disorders; individuals with poor oral health conditions, such as acute infections; and patients with oral habits like unilateral chewing. The specific research flowchart is illustrated in Figure 1.
Sample size consideration
A post hoc power analysis was performed using G*Power. For the primary binary outcomes, given the observed 12-month clinical success rates (100% vs. 88.24%) and radiographic success rates (98.04% vs. 84.31%), the achieved sample of 51 teeth per group yielded a power of 0.62 and 0.54, respectively, at a two-sided α of 0.05. Based on these observed effect sizes (12%–15% difference in success rates), an a priori sample size calculation indicated that 62–95 teeth per group would be required to achieve 80% power. Therefore, the present study was underpowered to detect the observed differences with conventional thresholds, and the findings should be interpreted as exploratory. No a priori sample-size calculation was performed because of the retrospective design.
Treatment method
To minimize operational errors, all clinical procedures on the affected teeth were performed by a single dentist.
Preoperative Preparation: Comprehensive preoperative intraoral and radiographic examinations were conducted. The intraoral examination included an assessment of the integrity and color of the tooth crown, percussion pain, tooth mobility, gingival swelling, the presence of sinuses or fistulas. The radiographic examination evaluated whether root fractures were present, whether the periodontal ligament space was normal, and the presence of periapical periodontitis. A preoperative diagnosis was established based on the medical history, and informed consent was obtained.
Initial Visit: The oral mucosa was disinfected with 0.5% povidone-iodine, and local anesthesia of the affected tooth was administered using 2% lidocaine. A rubber dam was placed to isolate the affected tooth, followed by surface disinfection. Pulp chamber access was achieved using a high-speed handpiece. Under a dental operating microscope, the root canal was gently irrigated with a 3% sodium hypochlorite solution (20 mL per canal) delivered with a 30-gauge side-vented irrigation needle positioned approximately 1 mm from the root apex. Irrigation was performed slowly over approximately 5 min to allow adequate disinfection while minimizing the risk of NaOCl extrusion into the periapical tissues. Irrigation continued until the solution in the root canal ran clear, after which the canal was dried with sterile paper points. Calcium hydroxide paste was placed in the root canal, and the pulp chamber was temporarily sealed with glass ionomer cement. The occlusion was adjusted. The patient was instructed to avoid biting on hard objects and was scheduled for a follow-up appointment in 2–4 weeks.
Follow-up Visit: If the affected tooth was asymptomatic, with no pain, swelling, sinuses, or discomfort upon percussion, the next step in the procedure could proceed. If any of these symptoms persisted, the initial visit procedures were repeated until the symptoms resolved. The oral mucosa was again disinfected with 0.5% povidone-iodine, and local anesthesia of the affected tooth was administered using 2% lidocaine. A rubber dam was placed to isolate the tooth, followed by surface disinfection. The temporary sealing material was removed using a high-speed handpiece. Under a dental operating microscope, the root canal was first ultrasonically irrigated with sterile saline to remove the remaining calcium hydroxide medication, followed by gentle irrigation with 17% EDTA (20 mL per canal) delivered with a 30-gauge side-vented needle positioned approximately 1 mm from the root apex over approximately 5 min. The rationale for EDTA irrigation was to remove the smear layer, chelate residual calcium hydroxide, and expose dentinal tubules and matrix-bound growth factors that may support cell migration, attachment, and differentiation during regenerative endodontic procedures. A final rinse with sterile saline was performed to remove residual EDTA, and the canal was dried with sterile paper points. Sodium hypochlorite solution irrigation was intentionally omitted during the second visit because adequate disinfection had already been achieved during the first visit, and because NaOCl is cytotoxic to stem cells of the apical papilla and may disrupt cell attachment to dentin19.
In the control group, a pre-bent 25# K-file was inserted approximately 2 mm beyond the root apex to stimulate periapical tissue hemorrhage. The blood was introduced into the root canal to a level approximately 2 mm below the cemento-enamel junction, and a blood clot was allowed to form for 10–15 min. A 2–3 mm layer of iRoot BP Plus was placed directly over the blood clot as the coronal barrier, followed by a temporary restoration. The rationale for using iRoot BP Plus was its biocompatibility, sealing ability, and favorable interaction with regenerative endodontic procedures.
In the CGF group, after parental or legal guardian consent and child assent, 9 mL of venous blood was collected from the patient as part of the clinically selected CGF treatment using a sterile 10 mL vacuum centrifuge tube without anticoagulant and immediately placed in a centrifuge for 12 min of centrifugation. The centrifugation was performed using the manufacturer's dedicated CGF program, corresponding to a relative centrifugal force of approximately 400 × g at the CGF layer, with fixed acceleration and deceleration settings. All blood samples were centrifuged within 1 min of collection at room temperature (20–25 °C). Post-centrifugation examination revealed a tri-layered structure consisting of pale yellow serum on top, CGF gel centrally, and erythrocyte sediment at the base. The CGF gel was transferred to a sterile bowl, picked up with forceps, and the middle layer was cut out and pressed into a membrane. The CGF gel was then cut into uniform 2 × 2 mm pieces, placed into the root canal using sterile forceps, and pushed to the apical region. The CGF was compressed to a level approximately 2 mm below the cemento-enamel junction using a vertical condenser. After the pulp chamber was thoroughly cleaned, a 2–3 mm layer of glass ionomer cement was placed directly over the CGF as the coronal barrier. No additional bioactive material or separate barrier membrane was placed between the CGF and the GIC; therefore, the GIC was in direct contact with the CGF. The rationale for using GIC was its biocompatibility, adequate sealing ability, and ease of application in pediatric patients. The CGF was intended to act as a biodegradable three-dimensional fibrin scaffold and a sustained-release reservoir of growth factors within the root canal, rather than as a permanent barrier. The GIC served as the coronal seal to protect the regenerative microenvironment and prevent coronal leakage. After GIC setting, the cavity was etched, rinsed, and dried, followed by application of adhesive, light curing, composite resin filling, adjustment of the occlusion, and polishing. To ensure protocol consistency, all CGF preparations were performed by the same experienced operator using the same centrifuge and a fixed centrifugation program throughout the study period. The centrifuge was calibrated annually according to the manufacturer's instructions. No anticoagulant was used, and the time from blood collection to the start of centrifugation was kept as short as possible (within 1 min) to minimize inter-sample variability.
Therapeutic evaluation
Postoperative follow-ups were conducted at 3, 6, and 12 months after regenerative therapy.
Primary outcome measures
Clinical Success Criteria: Per the American Association of Endodontists (AAE) pulp revascularization protocol, treatment success was defined as the resolution of clinical manifestations, including pain, swelling, and sinus formation.
Radiographic success criteria: According to the AAE guidelines, radiographic success was defined as the absence of progressive apical pathosis and the presence of favorable periapical repair. For teeth with a preoperative periapical radiolucency, radiographic success required the disappearance or clear reduction of the periapical radiolucency, together with no evidence of new or progressive apical bone loss, external root resorption, or root fracture. For teeth without a preoperative periapical radiolucency, radiographic success was defined as the absence of newly developed periapical radiolucency, no progression of apical periodontitis, no pathological external root resorption, and no root fracture during follow-up. Thus, all included teeth could be classified as having either radiographic success or failure, and the denominator for the radiographic success rate remained the total number of treated teeth in each group.
Secondary outcome measures
Root development: All measurements were performed using Image J software on standardized radiographs. Measurements were independently conducted by two experienced oral radiologists, with consistent projection angles and exposure parameters used for preoperative and postoperative images. The following parameters related to root development were assessed: Root Length Change Rate (ΔL): ΔL = (Postoperative L-Preoperative L) / Preoperative L × 100%; Root Canal Wall Thickness Change Rate (ΔT): ΔT = (Postoperative T-Preoperative T) / Preoperative T × 100%; Apical Diameter Change Rate (ΔD): ΔD = (Preoperative D-Postoperative D) / Preoperative D × 100%; Root Area Change Rate (ΔR): ΔR = (Postoperative R-Preoperative R) / Preoperative R × 100%; Root Canal Area Change Rate (ΔC): ΔC = (Preoperative C-Postoperative C) / Preoperative C × 100%
Electric pulp sensibility test: Pulp sensibility was assessed using a Digitest II pulp vitality tester. Before testing, the tooth crown was cleaned and dried. A small amount of toothpaste was applied to the tester tip as the conducting medium. For anterior teeth, the electrode was placed on the incisal edge of the crown, which has been shown to yield the lowest response threshold. For posterior teeth, the electrode was placed on the buccal cusp tip or the occlusal surface according to the manufacturer’s instructions and standard clinical practice. The current was increased gradually from zero until the patient reported a sensation or the maximum output was reached. The maximum output of the device was 80. A contralateral homologous tooth or an adjacent non-affected tooth was used as a control when available. Testing was performed by one experienced dentist, who was not blinded because of the retrospective design. Baseline pulp sensibility was negative for all included teeth before treatment. A test result with any perceived response at or below the maximum output of 80 was considered “positive,” whereas no response at 80 was considered “negative”20,21. This test reflects pulpal sensory nerve response and does not provide histological evidence of pulp vitality or regeneration.
CBCT gray values of newly formed intracanal tissue: Cone-beam computed tomography (CBCT) was used to scan the affected teeth. CBCT examinations were performed only when clinically indicated for the diagnosis and follow-up of traumatized immature permanent teeth and were not performed solely for research purposes. All scans were acquired using a NewTom VGi evo (NewTom, Verona, Italy) CBCT unit with the following parameters: tube voltage 80 kV, tube current 10 mA, exposure time 5 s, voxel size 0.2 mm, field of view 5 cm × 5 cm, and scan time 30 s. Images were reconstructed with a slice thickness of 0.2 mm. The gray values of the newly formed tissue within the root canal were measured using NNTViewer software. Three levels (coronal 1/3, middle 1/3, and apical 1/3) of the root canal were selected, with three regions of interest (ROIs) (each measuring 1 mm × 1 mm) at each level. The average gray value was calculated. Because the CBCT scans were not calibrated against a phantom, these values are reported as arbitrary gray values rather than true Hounsfield units (HU). A higher gray value generally indicates denser tissue, but the values should be interpreted as relative rather than absolute.
Radiopaque mineralized tissue deposition rate: During postoperative follow-ups, the length of newly formed radiopaque tissue along the dentin cross-section and the total length of the dentin cross-section were measured using radiographs. Measurements were performed twice consecutively by the same professional, and the average value was taken as the final result. The radiopaque mineralized tissue deposition rate was calculated as: (Length of newly formed radiopaque tissue along the dentin cross-section / Total length of the dentin cross-section) × 100%. A higher rate indicates greater deposition of radiopaque mineralized tissue within the root canal. However, because this parameter is based on radiographic assessment, it cannot distinguish among cementum, dentin-like tissue, bone-like tissue, or nonspecific calcific repair. Therefore, it should be regarded as an indicator of mineralized tissue deposition rather than histological evidence of cementum formation or true regeneration.
Masticatory function was evaluated in both groups using bite force and chewing efficiency as global indicators of oral function. Because these are whole-mouth measures, they cannot be attributed specifically to the treated tooth. Bite force was measured using a dental bite force monitor. Chewing efficiency was determined by the weighing method: peanuts were placed in the oral cavity and chewed for 20 s under normal conditions, then spat out. The mouth was rinsed with distilled water, and coarse residues were filtered out using a sieve (with a pore diameter of 2.0 mm). After drying, the weight was measured, and chewing efficiency was calculated using the formula: Chewing efficiency = (Weight before chewing-Weight after chewing) / Weight before chewing × 100%.
Serum inflammatory markers: Three milliliters of peripheral venous blood were collected from each patient and centrifuged at 400 × g for 15 min to separate the serum for testing. Serum levels of interleukin-1β (IL-1β), interleukin-6 (IL-6), and tumor necrosis factor-α (TNF-α) were quantified using ELISA to evaluate alterations in the inflammatory response. These assays were performed as part of routine clinical monitoring and were retrieved retrospectively from the hospital information system; they were not prospectively performed solely for this study. Baseline serum levels of these markers were not available for all patients because the assays were not routinely performed before treatment in this retrospective cohort.
Statistical analysis
Statistical analysis was conducted using SPSS. Continuous variables were first assessed for normality using the Shapiro-Wilk test. Homogeneity of variance was assessed using Levene’s test. For cross-sectional between-group comparisons at a single time point, normally distributed variables with equal variances were compared using independent-samples t-tests; otherwise, the Mann–Whitney U test was used. Categorical variables were presented as counts (%) and compared using the χ2 test or Fisher’s exact test as appropriate. For longitudinal continuous outcomes measured at 3, 6, and 12 months, repeated-measures analysis of variance (RM-ANOVA) was used, with time as the within-subject factor and group as the between-subject factor. Mauchly’s test was used to assess sphericity; when sphericity was violated, the Greenhouse–Geisser correction was applied. The primary interest was the group × time interaction, which indicates whether the change over time differed between the control and CGF groups. Partial eta-squared (η2) was reported as the effect size for the group effect, time effect, and group × time interaction. Significance was set at P < 0.05. Because this was an exploratory retrospective study with a large number of secondary outcome measures, no adjustment for multiple comparisons was applied to the primary analysis. However, we acknowledge that this increases the risk of Type I error. We have therefore clearly distinguished the primary outcomes (clinical success and radiographic success) from the secondary outcomes, and all secondary outcome analyses should be considered exploratory and hypothesis-generating.
结果
Comparison of baseline data
As shown in Table 1, baseline demographic and clinical characteristics, including age (t = 0.398, P = 0.691), gender (χ2 = 0.172, P = 0.679), Nolla stage (χ2 = 1.124, P = 0.570), tooth position (χ2 = 0.270, P = 0.603), location of the affected tooth (χ2 = 0.168, P = 0.682), and periapical periodontitis incidence (χ2 = 0.392, P = 0.532), did not differ significantly between groups. However, these tests were underpowered, and non-significant P values do not demonstrate equivalence or balance between groups. Therefore, baseline comparability should be interpreted with caution, and residual confounding cannot be excluded.
Number of teeth meeting the clinical success criteria
Table 2 illustrates that, at the 12-month postoperative follow-up, all teeth (51/51) in the CGF group met the predefined clinical success criteria. In contrast, 88.24% (45/51) of the teeth in the control group achieved this benchmark. A statistically significant difference was observed in the number of teeth meeting the clinical success criteria between the two groups (P = 0.027).
Number of teeth meeting the radiographic success criteria
Table 3 demonstrates that, at the 12-month postoperative assessment, 98.04% of the teeth (50/51) in the CGF group achieved the predefined radiographic success criteria. In comparison, 84.31% (43/51) of the teeth in the control group attained this radiographic benchmark. A statistically significant difference was observed in the number of teeth meeting the radiographic success criteria between the two groups (P = 0.031).
Root development status
Postoperative follow-ups were conducted at 3, 6, and 12 months after pulp regenerative therapy. The results revealed that the CGF group exhibited significantly superior outcomes compared to the control group in terms of root length change rate, root canal wall thickness change rate, apical diameter change rate, root area change rate, and root canal area change rate (all P < 0.05) (Table 4).
Positive pulp sensibility response status
Table 5 indicates that, at the 12-month postoperative evaluation, 88.24% of the teeth (45/51) in the CGF group demonstrated positive results in the electric pulp sensibility test. In contrast, 68.63% (35/51) of the teeth in the control group exhibited positive responses to the same test. A statistically significant difference was observed in the positive rates of the electric pulp sensibility test between the two groups (χ2 = 5.796, P = 0.016).
CBCT gray values of newly formed intracanal tissue
12 months after treatment, the CBCT gray values of newly formed tissue in the coronal 1/3, middle 1/3, and apical 1/3 regions of the root canal were all markedly higher in the CGF group compared to the control group (all P < 0.05). These findings suggest that the newly formed tissue within the root canal of teeth in the CGF group had higher gray values, possibly indicating denser tissue. Because these values were not calibrated against a phantom, they should be interpreted as relative gray values rather than true Hounsfield units. Higher gray values may be more conducive to root development and repair, but they do not provide histological evidence of regeneration (Table 6).
Radiopaque mineralized tissue deposition rate
At 3, 6, and 12 months postoperatively, both groups exhibited a significant increase in the radiopaque mineralized tissue deposition rate. Notably, the CGF group demonstrated a substantially higher deposition rate compared to the control group at each time point (all P < 0.05). A higher radiopaque mineralized tissue deposition rate suggests the formation of a greater volume of radiopaque mineralized tissue within the root canal. These tissues may be associated with enhanced structural integrity of the root and continued root development. At 12 months postoperatively, the CGF group maintained a higher deposition rate than the control group, which may indicate potential long-term stability of the treatment approach. However, because no histological evaluation was performed, these radiographic findings cannot determine the histological type of the deposited tissue and cannot distinguish among cementum, dentin-like tissue, bone-like tissue, or nonspecific calcific repair (Table 7).
Masticatory efficiency
At 3, 6, and 12 months postoperatively, both groups demonstrated a significant increase in bite force and masticatory efficiency. Notably, the CGF group exhibited markedly higher values compared to the control group at each time point (all P < 0.05) (Table 8).
Serum inflammatory markers
Baseline serum levels of IL-1β, IL-6, and TNF-α were not measured in this retrospective study. At 3, 6, and 12 months postoperatively, the postoperative levels of IL-1β, IL-6, and TNF-α in the CGF group were significantly lower than those in the control group (all P < 0.05). Because baseline values were unavailable, these between-group differences could not be interpreted as changes from baseline. These findings may suggest a potential immunomodulatory effect of CGF, but they should be regarded as exploratory (Table 9).
Safety assessment
No serious adverse events, including allergic reactions, persistent infections, root fractures, or tooth loss, were recorded in either group during the 12-month follow-up period. Minor complications, including transient postoperative pain and gingival swelling, were observed in 3 teeth (5.88%) in the control group and 2 teeth (3.92%) in the CGF group; all resolved within 1 week without additional intervention. Because adverse events were not prospectively and systematically recorded, these findings should be interpreted with caution and cannot establish the safety of CGF.
DATA AVAILABILITY:
The de-identified raw data supporting this study are provided as Supplementary File 1 associated with this article. The supplementary dataset contains de-identified baseline characteristics and outcome data for all 102 teeth, including demographic information; baseline clinical and radiographic parameters; root development measurements; CBCT gray values; radiopaque tissue deposition rates; masticatory efficiency measurements; and serum inflammatory marker levels at all follow-up time points. All patient identifiers have been removed, and the dataset has been appropriately de-identified. These data permit reproduction of the principal analyses presented in this study.
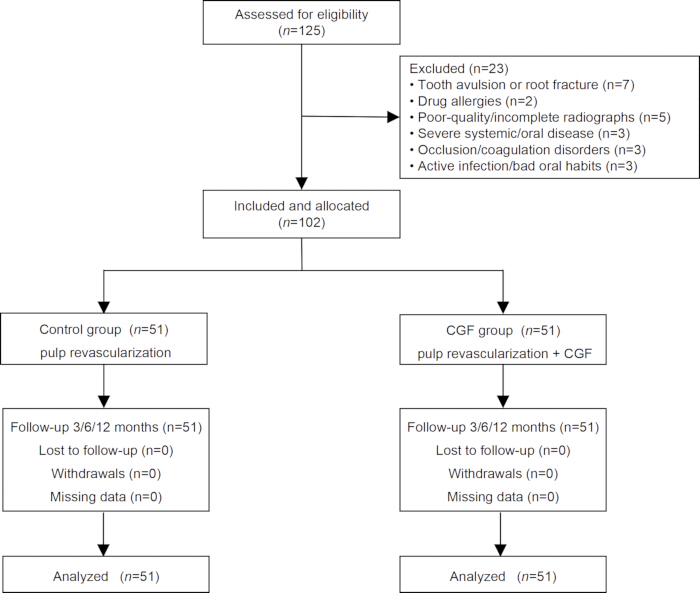
Figure 1: Flow diagram of the study. Flow diagram illustrating patient screening, eligibility assessment, exclusion, group allocation, follow-up, and analysis in this retrospective non-randomized controlled study. Of the 125 patients assessed for eligibility, 23 were excluded for the following reasons: tooth avulsion or root fracture (n = 7), drug allergies (n = 2), poor-quality or incomplete radiographs that precluded measurement (n = 5), severe systemic or oral disease (n = 3), occlusion or coagulation disorders (n = 3), and active infection or poor oral habits (n = 3). A total of 102 patients (102 teeth) were included and allocated according to the treatment actually received to the control group (pulp revascularization alone; n = 51) or the CGF group (pulp revascularization combined with concentrated growth factor; n = 51). Each patient contributed only one treated tooth, and the treated tooth was used as the unit of analysis. All participants completed the 3-, 6-, and 12-month follow-ups, with no losses to follow-up, withdrawals, or missing data, and all 102 teeth were analyzed. Abbreviation: CGF = concentrated growth factor. Please click here to view a larger version of this figure.
| Variable | Control group (n = 51) | CGF group (n = 51) | χ2/t-value | P-value |
| Age (years) | 8.33 ± 2.14 | 8.16 ± 2.33 | 0.398 | 0.691 |
| Gender | ||||
| Female | 19 (37.25) | 17 (33.33) | 0.172 | 0.679 |
| Male | 32 (62.75) | 34 (66.67) | ||
| Nolla stage | ||||
| N7 | 12 (23.53) | 9 (17.65) | 1.124 | 0.570 |
| N8 | 32 (62.75) | 37 (72.55) | ||
| N9 | 7 (13.73) | 5 (9.80) | ||
| Tooth position | ||||
| Anterior | 43 (84.31) | 41 (80.39) | 0.270 | 0.603 |
| Posterior | 8 (15.69) | 10 (19.61) | ||
| Location of the affected tooth | ||||
| maxilla | 31 (60.78) | 33 (64.71) | 0.168 | 0.682 |
| mandible | 20 (39.22) | 18 (35.29) | ||
| Periapical periodontitis | ||||
| Yes | 32 (62.75) | 35 (68.63) | 0.392 | 0.532 |
| No | 19 (37.25) | 16 (31.37) |
Table 1: Comparison of baseline data. Baseline demographic and clinical characteristics of the control group (pulp revascularization alone) and the CGF group (pulp revascularization combined with concentrated growth factor). Data are presented as mean ± standard deviation for age and as counts (percentages) for categorical variables. Between-group comparisons were performed using the independent-samples t-test for age and the χ2 test for categorical variables (gender, Nolla stage, tooth position, location of the affected tooth, and periapical periodontitis incidence). Nolla stage indicates the stage of root development (N7, N8, and N9 denote progressively more advanced stages of root formation). Tooth position refers to whether the treated tooth was an anterior or posterior tooth. Location of the affected tooth refers to the maxilla or mandible. Periapical periodontitis was diagnosed radiographically. All 102 teeth were included (51 per group). P < 0.05 was considered statistically significant. Because these baseline tests were underpowered, non-significant P values should not be interpreted as evidence of equivalence or balance between groups. Abbreviations: CGF = concentrated growth factor; N = Nolla stage; χ2 = chi-square.
| Variable | Control group (n=51) | CGF group (n=51) |
| Success n(%) | 45 (88.24) | 51 (100.00) |
| Failure n(%) | 6 (11.76) | 0 (0.00) |
| χ2-value | - | |
| P-value | 0.027 | |
| RR (95% CI) | 0.882 (0.798 to 0.975) | |
Table 2: Number of teeth meeting the clinical success criteria in both groups at 12 months postoperatively. Comparison of the number and proportion of teeth meeting the predefined clinical success criteria at 12 months postoperatively between the control group (pulp revascularization alone; n = 51) and the CGF group (pulp revascularization combined with concentrated growth factor; n = 51). Data are presented as counts (percentages). Clinical success was defined according to the American Association of Endodontists (AAE) pulp revascularization protocol as the resolution of clinical manifestations, including pain, swelling, and sinus formation. Between-group comparison was performed using the χ2 test, with P < 0.05 considered statistically significant. The treated tooth was the unit of analysis. Abbreviations: CGF = concentrated growth factor; AAE = American Association of Endodontists; χ2 = chi-square.
| Variable | Control group (n = 51) | CGF group (n = 51) |
| Success n(%) | 43 (84.31) | 50 (98.04) |
| Failure n(%) | 8 (15.69) | 1 (1.96) |
| χ2-value | - | |
| P-value | 0.031 | |
| OR (95% CI) | 0.108 (0.013 to 0.894) | |
Table 3: Number of teeth meeting the radiographic success criteria in both groups at 12 months postoperatively. Comparison of the number and proportion of teeth meeting the predefined radiographic success criteria at 12 months postoperatively between the control group (pulp revascularization alone; n = 51) and the CGF group (pulp revascularization combined with concentrated growth factor; n = 51). Data are presented as counts (percentages). Radiographic success was defined according to AAE guidelines as the absence of progressive apical pathosis and the presence of favorable periapical repair; for teeth with a preoperative periapical radiolucency, success required disappearance or clear reduction of the radiolucency without new or progressive apical bone loss, external root resorption, or root fracture, whereas for teeth without a preoperative periapical radiolucency, success was defined as the absence of newly developed periapical radiolucency, progression of apical periodontitis, pathological external root resorption, or root fracture during follow-up. Between-group comparison was performed using the χ2 test, with P < 0.05 considered statistically significant. The odds ratio (OR) with 95% confidence interval (CI) is reported. The treated tooth was the unit of analysis. Abbreviations: CGF = concentrated growth factor; AAE = American Association of Endodontists; OR = odds ratio; CI = confidence interval; χ2 = chi-square.
| Variable | Time point | Control group (n = 51) | CGF group (n = 51) | t-value | P-value | Mean difference (95% CI) |
| Root Length | 3 months | 4.48±1.85 | 8.66±3.21 | -8.062 | <0.001 | -4.190 (-5.221 to -3.159) |
| 6 months | 9.27±2.15 | 14.45±4.57 | -7.314 | <0.001 | -5.170 (-6.573 to -3.768) | |
| 12 months | 15.29±4.66 | 20.69±5.23 | -5.52 | <0.001 | -5.410 (-7.354 to -3.466) | |
| RM-ANOVA | F-value (group) = 126.580, P-value < 0.001, Partial η2 = 0.559 | |||||
| F-value (time) = 226.109, P-value < 0.001, Partial η2 = 0.693 | ||||||
| F-value (group × time) = 0.723, P-value = 0.487, Partial η2 = 0.007 | ||||||
| Root Canal Wall Thickness | 3 months | 2.44±1.21 | 3.98±1.88 | -4.934 | <0.001 | -1.540 (-2.159 to -0.921) |
| 6 months | 9.51±3.22 | 13.77±4.56 | -5.457 | <0.001 | -4.260 (-5.809 to -2.711) | |
| 12 months | 20.55±4.71 | 24.56±5.52 | -3.943 | <0.001 | -4.010 (-6.028 to -1.992) | |
| RM-ANOVA | F-value (group) = 50.493, P-value < 0.001, Partial η2 = 0.336 | |||||
| F-value (time) = 680.504, P-value < 0.001, Partial η2 = 0.872 | ||||||
| F-value (group × time) = 4.087, P-value = 0.018, Partial η2 = 0.039 | ||||||
| Root Tip Diameter | 3 months | 17.65±8.15 | 25.38±7.33 | -5.036 | <0.001 | -7.730 (-10.775 to -4.685) |
| 6 months | 32.69±11.21 | 44.33±13.56 | -4.723 | <0.001 | -11.640 (-16.530 to -6.750) | |
| 12 months | 58.44±17.14 | 68.91±16.46 | -3.148 | 0.002 | -10.475 (-17.076 to -3.874) | |
| RM-ANOVA | F-value (group) = 40.338, P-value < 0.001, Partial η2 = 0.287 | |||||
| F-value (time) = 296.394, P-value < 0.001, Partial η2 = 0.748 | ||||||
| F-value (group × time) = 0.664, P-value = 0.516, Partial η2 = 0.007 | ||||||
| Root Region Area | 3 months | 4.65±2.87 | 10.66±5.22 | -7.213 | <0.001 | -6.010 (-7.663 to -4.357) |
| 6 months | 12.33±4.82 | 26.33±11.56 | -7.987 | <0.001 | -14.010 (-17.490 to -10.530) | |
| 12 months | 26.66±8.24 | 35.55±10.23 | -4.833 | <0.001 | -8.890 (-12.539 to -5.241) | |
| RM-ANOVA | F-value (group) = 105.796, P-value < 0.001, Partial η2 = 0.514 | |||||
| F-value (time) = 243.261, P-value < 0.001, Partial η2 = 0.709 | ||||||
| F-value (group × time) = 7.262, P-value = 0.001, Partial η2 = 0.068 | ||||||
| Root Canal Area | 3 months | 5.56±2.26 | 8.67±4.12 | -4.748 | <0.001 | -3.120 (-4.423 to -1.816) |
| 6 months | 12.38±4.26 | 18.65±9.77 | -4.207 | <0.001 | -6.280 (-9.242 to -3.318) | |
| 12 months | 19.42±7.55 | 25.57±7.23 | -4.201 | <0.001 | -6.150 (-9.054 to -3.246) | |
| RM-ANOVA | F-value (group) = 48.998, P-value < 0.001, Partial η2 = 0.329 | |||||
| F-value (time) = 150.134, P-value < 0.001, Partial η2 = 0.600 | ||||||
| F-value (group × time) = 2.025, P-value = 0.135, Partial η2 = 0.020 | ||||||
Table 4: Change rates of root development parameters in both groups across the three evaluation periods (x̄ ± s, %). Comparison of radiographic root development parameters at 3, 6, and 12 months postoperatively between the control group (pulp revascularization alone; n = 51) and the CGF group (pulp revascularization combined with concentrated growth factor; n = 51). Data are presented as mean ± standard deviation (x̄ ± s) and expressed as percentage change rates (%). All measurements were performed using ImageJ software on standardized radiographs by two experienced oral radiologists, with consistent projection angles and exposure parameters for preoperative and postoperative images. The parameters assessed were: root length change rate (ΔL), root canal wall thickness change rate (ΔT), apical diameter change rate (ΔD), root area change rate (ΔR), and root canal area change rate (ΔC). Change rates were calculated as follows: ΔL = (postoperative L − preoperative L) / preoperative L × 100%; ΔT = (postoperative T − preoperative T) / preoperative T × 100%; ΔD = (preoperative D − postoperative D) / preoperative D × 100%; ΔR = (postoperative R − preoperative R) / preoperative R × 100%; and ΔC = (preoperative C − postoperative C) / preoperative C × 100%. Between-group comparisons at each time point were performed using independent-samples t-tests, with P < 0.05 considered statistically significant; mean differences with 95% confidence intervals (CIs) are reported. For longitudinal outcomes across the three time points, repeated-measures analysis of variance (RM-ANOVA) was used, with time as the within-subject factor and group as the between-subject factor; Mauchly's test was used to assess sphericity, and the Greenhouse-Geisser correction was applied when sphericity was violated. The group × time interaction indicates whether the change over time differed between groups. Partial eta-squared (η2) is reported as the effect size for the group effect, time effect, and group × time interaction. Abbreviations: CGF = concentrated growth factor; RM-ANOVA = repeated-measures analysis of variance; η2 = partial eta-squared; CI = confidence interval; L = root length; T = root canal wall thickness; D = apical diameter; R = root area; C = root canal area.
| Variable | Control group (n = 51) | CGF group (n = 51) |
| Positive n(%) | 35 (68.63) | 45 (88.24) |
| Negative n(%) | 16 (31.37) | 6 (11.76) |
| χ2-value | 5.795 | |
| P-value | 0.016 | |
| OR (95% CI) | 0.292 (0.103 to 0.823) | |
Table 5: Comparison of positive pulp sensibility response between the two groups of teeth at 12 months postoperatively. Comparison of the number and proportion of teeth with a positive electric pulp sensibility test response at 12 months postoperatively between the control group (pulp revascularization alone; n = 51) and the CGF group (pulp revascularization combined with concentrated growth factor; n = 51). Data are presented as counts (percentages). Pulp sensibility was assessed using a Digitest II pulp vitality tester; the tooth crown was cleaned and dried, a small amount of toothpaste was applied to the tester tip as the conducting medium, and the electrode was placed on the incisal edge of the crown. The current was increased gradually from zero until the patient reported a sensation or the maximum output of 80 was reached. A test result with any perceived response at or below the maximum output of 80 was considered "positive," whereas no response at 80 was considered "negative." Baseline pulp sensibility was negative for all included teeth before treatment. Between-group comparison was performed using the χ2 test, with P < 0.05 considered statistically significant. The odds ratio (OR) with 95% confidence interval (CI) is reported. This test reflects pulpal sensory nerve response and does not provide histological evidence of pulp vitality or regeneration. The treated tooth was the unit of analysis. Abbreviations: CGF = concentrated growth factor; OR = odds ratio; CI = confidence interval; χ2 = chi-square.
| Variable | Control group (n = 51) | CGF group (n = 51) | t-value | P-value | Mean difference (95% CI) |
| Coronal 1/3 | 325.44 ± 53.65 | 462.33 ± 45.69 | -13.872 | <0.001 | -136.88 (-156.457 to -117.303) |
| Middle 1/3 | 288.66 ± 41.36 | 389.64 ± 52.11 | -10.84 | <0.001 | -100.98 (-119.462 to -82.498) |
| Apical 1/3 | 250.67 ± 45.76 | 358.44 ± 55.75 | -10.672 | <0.001 | -107.78 (-127.817 to -87.743) |
Table 6: Comparison of CBCT gray values of newly formed intracanal tissue between the two groups of teeth at 12 months postoperatively (x̄ ± s, arbitrary units). Comparison of cone-beam computed tomography (CBCT) gray values of newly formed intracanal tissue at 12 months postoperatively between the control group (pulp revascularization alone; n = 51) and the CGF group (pulp revascularization combined with concentrated growth factor; n = 51). Data are presented as mean ± standard deviation (x̄ ± s) in arbitrary gray value units. CBCT examinations were performed only when clinically indicated for the diagnosis and follow-up of traumatized immature permanent teeth and were not performed solely for research purposes. All scans were acquired using a NewTom VGI evo CBCT unit with the following parameters: tube voltage 80 kV, tube current 10 mA, exposure time 5 s, voxel size 0.2 mm, field of view 5 cm × 5 cm, and scan time 30 s; images were reconstructed with a slice thickness of 0.2 mm. The gray values of the newly formed tissue within the root canal were measured using NNTViewer software at three levels (coronal 1/3, middle 1/3, and apical 1/3) of the root canal, with three regions of interest (ROIs) (each measuring 1 mm × 1 mm) at each level, and the average gray value was calculated. Because the CBCT scans were not calibrated against a phantom, these values are reported as arbitrary gray values rather than true Hounsfield units (HU) and should be interpreted as relative rather than absolute. Between-group comparisons were performed using independent-samples t-tests, with P < 0.05 considered statistically significant; mean differences with 95% confidence intervals (CIs) are reported. Higher gray values generally indicate denser tissue, but do not provide histological evidence of regeneration. Abbreviations: CGF = concentrated growth factor; CBCT = cone-beam computed tomography; ROI = region of interest; HU = Hounsfield units; CI = confidence interval.
| Time point | Control group (n = 51) | CGF group (n = 51) | t-value | P-value | Mean difference (95% CI) |
| 3 months | 36.44 ± 9.65 | 48.33 ± 9.77 | -6.185 | <0.001 | -11.900 (-15.717 to -8.083) |
| 6 months | 61.22 ± 12.65 | 70.45 ± 15.01 | -3.359 | <0.001 | -9.230 (-14.681 to -3.779) |
| 12 months | 75.66 ± 16.32 | 87.65 ± 18.88 | -3.428 | <0.001 | -11.980 (-18.913 to -5.047) |
| RM-ANOVA | F-value (group) = 46.735, P-value < 0.001, Partial η2 = 0.319 | ||||
| F-value (time) = 199.622, P-value < 0.001, Partial η2 = 0.666 | |||||
| F-value (group × time) = 0.313, P-value = 0.731, Partial η2 = 0.003 | |||||
Table 7: Comparison of radiopaque tissue deposition rates between the two groups across the three evaluation periods (x̄ ± s, %). Comparison of the radiopaque mineralized tissue deposition rate at 3, 6, and 12 months postoperatively between the control group (pulp revascularization alone; n = 51) and the CGF group (pulp revascularization combined with concentrated growth factor; n = 51). Data are presented as mean ± standard deviation (x̄ ± s) and expressed as percentages (%). During postoperative follow-ups, the length of newly formed radiopaque tissue along the dentin cross-section and the total length of the dentin cross-section were measured using radiographs; measurements were performed twice consecutively by the same professional, and the average value was taken as the final result. The radiopaque mineralized tissue deposition rate was calculated as: (length of newly formed radiopaque tissue along the dentin cross-section / total length of the dentin cross-section) × 100%. A higher rate indicates greater deposition of radiopaque mineralized tissue within the root canal. Between-group comparisons at each time point were performed using independent-samples t-tests, with P < 0.05 considered statistically significant; mean differences with 95% confidence intervals (CIs) are reported. For longitudinal outcomes across the three time points, repeated-measures analysis of variance (RM-ANOVA) was used, with time as the within-subject factor and group as the between-subject factor; partial eta-squared (η2) is reported as the effect size for the group effect. Because this parameter is based on radiographic assessment, it cannot distinguish among cementum, dentin-like tissue, bone-like tissue, or nonspecific calcific repair and should therefore be regarded as an indicator of mineralized tissue deposition rather than histological evidence of cementum formation or true regeneration. Abbreviations: CGF = concentrated growth factor; RM-ANOVA = repeated-measures analysis of variance; η2 = partial eta-squared; CI = confidence interval.
| Variable | Time point | Control group (n = 51) | CGF group (n = 51) | t-value | P-value | Mean difference (95% CI) |
| Bite force /N | 3 months | 85.66 ± 16.48 | 101.57 ± 19.87 | -4.397 | <0.001 | -15.900 (-23.074 to -8.727) |
| 6 months | 108.55 ± 15.37 | 119.36 ± 18.56 | -3.201 | 0.002 | -10.800 (-17.495 to -4.105) | |
| 12 months | 129.22 ± 18.41 | 148.46 ± 17.78 | -5.367 | <0.001 | -19.230 (-26.339 to -12.122) | |
| RM-ANOVA | F-value (group) = 71.162, P-value < 0.001, Partial η2 = 0.416 | |||||
| F-value (time) = 149.703, P-value < 0.001, Partial η2 = 0.600 | ||||||
| F-value (group × time) = 1.315, P-value = 0.271, Partial η2 = 0.013 | ||||||
| Chewing efficiency /% | 3 months | 60.33 ± 10.32 | 68.55 ± 11.15 | -3.864 | <0.001 | -8.220 (-12.441 to -3.999) |
| 6 months | 68.05 ± 7.64 | 74.33 ± 6.51 | -4.468 | <0.001 | -6.280 (-9.068 to -3.492) | |
| 12 months | 79.02 ± 7.43 | 86.27 ± 6.97 | -5.084 | <0.001 | -7.254 (-10.085 to -4.423) | |
| RM-ANOVA | F-value (group) = 39.295, P-value < 0.001, Partial η2 = 0.282 | |||||
| F-value (time) = 149.789, P-value < 0.001, Partial η2 = 0.600 | ||||||
| F-value (group × time) = 0.416, P-value = 0.660, Partial η2 = 0.004 | ||||||
Table 8: Comparison of masticatory efficiency between the two groups across the three evaluation periods (x̄ ± s). Comparison of masticatory function, assessed by bite force (in Newtons, N) and chewing efficiency (in %), at 3, 6, and 12 months postoperatively between the control group (pulp revascularization alone; n = 51) and the CGF group (pulp revascularization combined with concentrated growth factor; n = 51). Data are presented as mean ± standard deviation (x̄ ± s). Bite force was measured using a dental bite force monitor. Chewing efficiency was determined by the weighing method: peanuts were placed in the oral cavity and chewed for 20 s under normal conditions, then spat out; the mouth was rinsed with distilled water, and coarse residues were filtered out using a sieve (pore diameter 2.0 mm); after drying, the weight was measured, and chewing efficiency was calculated using the formula: chewing efficiency = (weight before chewing − weight after chewing) / weight before chewing × 100%. These are whole-mouth measures and cannot be attributed specifically to the treated tooth. Between-group comparisons at each time point were performed using independent-samples t-tests, with P < 0.05 considered statistically significant; mean differences with 95% confidence intervals (CIs) are reported. For longitudinal outcomes across the three time points, repeated-measures analysis of variance (RM-ANOVA) was used, with time as the within-subject factor and group as the between-subject factor; the group × time interaction indicates whether the change over time differed between groups. Partial eta-squared (η2) is reported as the effect size for the group effect, time effect, and group × time interaction. Abbreviations: CGF = concentrated growth factor; RM-ANOVA = repeated-measures analysis of variance; η2 = partial eta-squared; CI = confidence interval; N = Newtons.
| Variable | Time point | Control group (n = 51) | CGF group (n = 51) | t-value | P-value | Mean difference (95% CI) |
| IL-1β | 3 months | 11.22 ± 1.20 | 9.65 ± 1.45 | 5.996 | <0.001 | 1.580 (1.057 to 2.103) |
| 6 months | 9.45 ± 1.03 | 7.87 ± 1.22 | 7.126 | <0.001 | 1.580 (1.140 to 2.020) | |
| 12 months | 7.82 ± 1.46 | 5.76 ± 1.55 | 6.887 | <0.001 | 2.060 (1.467 to 2.653) | |
| RM-ANOVA | F-value (group) = 105.022, P-value < 0.001, Partial η2 = 0.512 | |||||
| F-value (time) = 218.027, P-value < 0.001, Partial η2 = 0.686 | ||||||
| F-value (group × time) = 1.264, P-value = 0.285, Partial η2 = 0.012 | ||||||
| IL-6 | 3 months | 5.16 ± 1.24 | 4.33 ± 1.08 | 3.606 | <0.001 | 0.830 (0.373 to 1.287) |
| 6 months | 4.12 ± 1.15 | 3.23 ± 1.21 | 3.823 | <0.001 | 0.890 (0.428 to 1.352) | |
| 12 months | 3.23 ± 1.21 | 2.06 ± 0.54 | 6.284 | <0.001 | 1.160 (0.794 to 1.527) | |
| RM-ANOVA | F-value (group) = 85.710, P-value < 0.001, Partial η2 = 0.462 | |||||
| F-value (time) = 81.314, P-value < 0.001, Partial η2 = 0.448 | ||||||
| F-value (group × time) = 0.568, P-value = 0.567, Partial η2 = 0.006 | ||||||
| TNF-α | 3 months | 14.36 ± 2.57 | 11.66 ± 2.15 | 5.754 | <0.001 | 2.700 (1.769 to 3.631) |
| 6 months | 10.26 ± 2.44 | 8.15 ± 1.59 | 5.162 | <0.001 | 2.100 (1.293 to 2.907) | |
| 12 months | 7.65 ± 2.06 | 4.26 ± 1.41 | 9.721 | <0.001 | 3.400 (2.706 to 4.094) | |
| RM-ANOVA | F-value (group) = 117.809, P-value < 0.001, Partial η2 = 0.541 | |||||
| F-value (time) = 313.406, P-value < 0.001, Partial η2 = 0.758 | ||||||
| F-value (group × time) = 2.662, P-value = 0.072, Partial η2 = 0.026 | ||||||
Table 9: Comparison of serum inflammatory markers between the two groups across the three evaluation periods (x̄ ± s, pg/mL). Comparison of serum levels of interleukin-1β (IL-1β), interleukin-6 (IL-6), and tumor necrosis factor-α (TNF-α) at 3, 6, and 12 months postoperatively between the control group (pulp revascularization alone; n = 51) and the CGF group (pulp revascularization combined with concentrated growth factor; n = 51). Data are presented as mean ± standard deviation (x̄ ± s) in picograms per milliliter (pg/mL). Baseline serum levels of IL-1β, IL-6, and TNF-α were not measured in this retrospective study. Three milliliters of peripheral venous blood were collected from each patient and centrifuged at 400 × g for 15 min to separate the serum; serum levels of IL-1β, IL-6, and TNF-α were quantified using enzyme-linked immunosorbent assay (ELISA). Because these markers were measured from peripheral venous blood, they reflect systemic rather than tooth-specific inflammation. Between-group comparisons at each time point were performed using independent-samples t-tests, with P < 0.05 considered statistically significant; mean differences with 95% confidence intervals (CIs) are reported. For longitudinal outcomes across the three time points, repeated-measures analysis of variance (RM-ANOVA) was used, with time as the within-subject factor and group as the between-subject factor; the group × time interaction indicates whether the change over time differed between groups. Partial eta-squared (η2) is reported as the effect size for the group effect, time effect, and group × time interaction. Because baseline values were unavailable, between-group differences could not be interpreted as changes from baseline, and these findings should be regarded as exploratory. Abbreviations: CGF = concentrated growth factor; IL-1β = interleukin-1β; IL-6 = interleukin-6; TNF-α = tumor necrosis factor-α; ELISA = enzyme-linked immunosorbent assay; RM-ANOVA = repeated-measures analysis of variance; η2 = partial eta-squared; CI = confidence interval; pg/mL = picograms per milliliter.
Supplementary File 1: De-identified Raw Data Supporting the Study. Please click here to download this file.
讨论
Children are a high-risk population for dental trauma due to their active participation in vigorous sports or playful activities, which often involve collisions and falls22. Young permanent teeth are particularly vulnerable because their roots are not yet fully developed. Trauma can easily damage the periodontal and pulp tissues, impeding root development and potentially leading to tooth loss, which compromises mastication, speech, and may adversely affect the child's psychological well-being23,24. The primary clinical goal for treating traumatic pulp necrosis in young permanent teeth is to eliminate inflammation, promote normal root development, and restore function25. Traditional apexification has limitations, including prolonged treatment duration, lack of space for root growth due to medication occupying the pulp cavity, and an alkaline environment unfavorable for stem cell proliferation, which collectively restrict root wall thickening and increase the risk of infection and fracture26,27. In contrast, pulp revascularization has been associated with reparative effects on infected or necrotic pulps, including dentin-like tissue deposition, increased root thickness and length, and apical closure28. The most widely used method induces apical bleeding to form a natural blood clot scaffold29. More recently, CGF has been introduced as a platelet derivative with higher growth factor concentrations and a three-dimensional fibrin architecture that may support sustained growth factor release and cellular growth30. However, comparative clinical data between CGF and traditional blood clot scaffolds remain scarce. This retrospective, non-randomized study directly compared these two approaches in 102 patients with traumatic pulp necrosis in young permanent teeth. Because treatment allocation was based on clinical and patient/family preferences rather than randomization, the results should be interpreted with caution.
In this cohort, the combination of pulp revascularization with CGF was associated with a clinical success rate of 100.00% and a radiographic success rate of 98.04% at 12 months postoperatively, compared with 88.24% and 84.31% in the control group, respectively. These success rates are higher than those generally reported in the regenerative endodontic literature. For example, a meta-analysis of 27 RCTs reported a pooled success rate of 95.6% for immature teeth31. The 100% clinical success rate with zero failures in the CGF group is particularly notable and exceeds the upper range of previously reported outcomes. Several factors may account for this discrepancy. First, our study was restricted to patients with complete follow-up and adequate imaging data, and patients who failed to attend follow-up or whose imaging was incomplete were excluded before analysis. This may have introduced selection bias and removed treatment failures from the analysis. Second, the strict inclusion criteria, including the requirement for complete follow-up exceeding 12 months, may have preferentially excluded patients with poor compliance or unfavorable outcomes. Third, the definition of clinical success in our study was based on the resolution of clinical signs and symptoms without histological confirmation of regeneration, which may differ from definitions used in other studies. Fourth, the follow-up period of 12 months may be insufficient to capture late failures or complications. Therefore, the high success rates observed in this study should be interpreted with caution and require confirmation in prospective studies with larger sample sizes, complete follow-up, and longer follow-up durations.
The thickening of the root canal wall and the increase in root length are critical indicators for evaluating the efficacy of regenerative endodontic procedures in young permanent teeth. In this study, compared with pulp revascularization alone, the combination of pulp revascularization with CGF was associated with greater increases in root canal wall thickness and root length in young permanent teeth. This finding may indicate greater deposition of radiopaque mineralized tissue along the root canal wall on radiographs. However, radiographs cannot distinguish among cementum, dentin-like tissue, bone-like tissue, or nonspecific calcific repair. Therefore, this finding should be interpreted as radiographic evidence of mineralized tissue deposition and repair, rather than histological proof of cementum or dentin formation. The dental pulp contains nerves, blood vessels, and undifferentiated dental pulp stem cells (DPSCs), which may contribute to reparative dentin formation and cementum repair under appropriate conditions32,33,34. CGF contains a fibrin matrix and multiple growth factors that have been suggested to support cell migration, proliferation, and mineralized tissue deposition35,36,37. However, these mechanisms were not directly investigated in the present study. Therefore, they should be considered hypothesis-generating rather than confirmed mechanisms. Whether the observed radiographic changes reflect increased root canal wall thickness and root length, and whether they may reinforce root structure or reduce fracture risk, requires further histological and molecular investigation. Apical foramen closure and a positive pulp sensibility response are considered favorable outcomes of regenerative endodontic procedures in young permanent teeth38. In this study, the CGF group showed a higher rate of positive pulp sensibility response and greater radiographic evidence of apical closure and mineralized tissue deposition. These findings may be consistent with greater pulp tissue repair and functional recovery in the CGF group39,40,41, but they do not establish a causal effect of CGF. The mechanisms underlying apical closure and pulp sensibility recovery were not investigated in this cohort, and the specific cellular and molecular pathways remain to be determined in future studies.
Following pulp necrosis, periapical tissues may exhibit inflammatory responses. In this study, baseline serum levels of IL-1β, IL-6, and TNF-α were not measured. At postoperative follow-up visits, the levels of these cytokines were lower in the CGF group than in the control group. However, because baseline values were unavailable, we could not determine whether these differences represented a true reduction from baseline or pre-existing between-group differences. Therefore, these findings should be interpreted cautiously and cannot be considered definitive evidence of an anti-inflammatory effect of CGF. The present study was not designed to establish a causal relationship between CGF and systemic inflammatory marker changes, and this hypothesis requires confirmation in future prospective studies with baseline measurements. Whether CGF has immunomodulatory effects that may influence root repair or periapical structures remains speculative and was not directly investigated in this cohort.
The preparation process of CGF is straightforward, its source is abundant, and it exhibits excellent biocompatibility. These advantages endow CGF with high feasibility and safety in clinical applications. Furthermore, the anti-inflammatory and immunomodulatory effects of CGF confer significant advantages in treating inflammatory conditions such as pulp necrosis. In the present study, the CGF was placed directly beneath the GIC coronal barrier, and no additional bioactive material or barrier membrane was interposed. This direct contact raises the theoretical possibility that the GIC setting reaction could affect cells within the CGF or the release of growth factors. However, this study did not directly measure cell viability, growth-factor release, or local pH at the CGF-GIC interface. Therefore, these considerations remain speculative and require further in vitro and histological investigation. Future in vitro studies and histologic analyses are needed to determine whether direct contact between GIC and CGF influences the biological regenerative process and to identify the optimal coronal barrier material for CGF-based regenerative endodontic procedures. Future research can further optimize the administration methods and dosages of CGF to enhance its therapeutic efficacy and safety. Future studies should also include histological or molecular analyses to confirm whether the observed radiographic changes represent true pulp regeneration or cementum formation.
Despite the relatively promising results, several limitations should be acknowledged. First, this was a retrospective, non-randomized study with a relatively small sample size. Group allocation was based on clinical decisions and patient/family preferences, including willingness to undergo venous blood collection for CGF preparation, which may have introduced confounding by indication. Although strict eligibility criteria were applied, available baseline variables were compared, and all clinical procedures were standardized, these measures cannot eliminate selection bias or residual confounding; the baseline comparison in Table 1 shows only that the measured variables were similar between groups. Second, several potentially important confounders were not systematically recorded in the original clinical records, including the type and severity of trauma, the time interval between trauma and treatment, the initial apical diameter, the extent of periapical pathology, the degree of infection, the quality of the coronal restoration, socioeconomic status, parental education level, oral hygiene behaviors, dietary habits, parental compliance with follow-up, and individual biological variability in regenerative capacity and immune response. Because of the limited sample size (51 teeth per group) and the small number of outcome events, formal multivariable adjustment for these confounders was not feasible. Therefore, although the measured baseline variables appeared balanced, unmeasured or incompletely measured confounders may still have influenced the observed associations. The findings should be interpreted as exploratory and hypothesis-generating rather than causal, and the observed associations between CGF and improved outcomes require confirmation in prospective randomized controlled trials with standardized collection of potential confounders. Third, the follow-up period in this study was 12 months, which may be insufficient to fully evaluate the long-term outcomes of CGF treatment. The continued development of dental roots and pulp regeneration is a prolonged process, and a 12-month follow-up might not adequately capture long-term outcomes. Fourth, this study primarily assessed clinical and radiographic outcomes associated with CGF, with limited exploration of underlying mechanisms. The specific targets and signaling pathways of growth factors within CGF remain to be elucidated. In addition, serum inflammatory markers were measured from peripheral venous blood and therefore reflect systemic rather than tooth-specific inflammation. Although between-group differences were observed, these markers cannot be considered specific to the treated tooth. Future studies should consider combining systemic markers with local sampling (e.g., gingival crevicular fluid or periapical exudate) or advanced imaging to better characterize the local inflammatory microenvironment.
Within the constraints of this retrospective study, which involved a relatively small sample size (51 teeth per group) and a 12-month follow-up period, the addition of CGF to pulp revascularization was associated with improved clinical success rates, root development parameters, positive pulp sensibility response, and masticatory function in young permanent teeth with traumatic pulp necrosis. The postoperative inflammatory marker findings may suggest a potential immunomodulatory role of CGF; however, because baseline inflammatory markers were not measured, this observation should be interpreted as preliminary and exploratory. Given the inherent limitations of the study design, these findings should be interpreted as preliminary and hypothesis-generating. CGF appears to be a promising adjunctive scaffold, but its efficacy and long-term safety require confirmation through well-designed prospective randomized controlled trials with larger sample sizes and extended follow-up durations. Because no histological evaluation was performed, the present findings should be regarded as evidence of clinical and radiographic repair rather than histologically confirmed pulp regeneration, cementum formation, or dentin formation. In particular, the radiographic parameter described as radiopaque mineralized tissue deposition cannot distinguish among cementum, dentin-like tissue, bone-like tissue, or nonspecific calcific repair. Future mechanistic studies with histological or molecular analyses are needed to elucidate the pathways involved in CGF-associated pulp repair.
披露
The authors declare no financial conflicts of interest. No generative AI or AI-assisted tools were used in the writing, data analysis, or preparation of this manuscript.
致谢
This study received no external funding.
材料
| 姓名 | 公司 | 目录编号 | 评论 |
|---|---|---|---|
| 0.5% povidone-iodine | Atlantis Consumer Healthcare, Inc. | NDC: 67618-182 | Used for oral mucosa disinfection before treatment |
| 2% lidocaine | Healthfirst | 1013640 | Local anesthesia of the affected tooth |
| 3% sodium hypochlorite solution | Vista Dental Products (Inter-Med LLC) | REF 502315 | Root canal irrigation at the initial visit; 20 mL per canal |
| 17% EDTA | Pulpdent Corporation | D701EDTA4802 | Used for root canal irrigation at the follow-up visit; 20 mL per canal |
| 25# K-file | Dentsply Maillefer | A0125 | Pre-bent and inserted approximately 2 mm beyond the root apex to stimulate periapical tissue hemorrhage in the control group |
| 30-gauge side-vented irrigation needle | Ultradent Products, Inc. | 3025 | Used for delivery of irrigants approximately 1 mm from the root apex |
| Adhesive | 3M ESPE | 41257 | Applied after etching, rinsing, and drying |
| Calcium hydroxide paste | DiaDent Group International | A1001-405 | Intracanal medicament placed at the initial visit |
| Centrifuge | Medifuge MF200, Silfradent, Sofia, Italy | MF 200 / MF 200 100 | Used for CGF preparation; 12 minutes of centrifugation using the manufacturer's dedicated CGF program. Class IIa medical device; accommodates up to 8 test tubes; three predefined non-editable programs (CGF-PRP1-PRP2); built-in UVC decontamination cycle (5 min at 1,000 revs); noise ≤57 dBA; weight 9.4 kg; dimensions WxDxH: 32×23×24 cm. |
| Composite resin | 3M ESPE | 7019A1B | Used for final filling after GIC setting |
| Dental bite force monitor | Nagano Keiki Co., Ltd., Japan | GM-10 | Used for bite force measurement |
| Dental operating microscope | Sumitomo Riko Co., Ltd., Japan | Oramo-bf | Used during root canal irrigation and regenerative procedures |
| Digestit II pulp vitality tester | Parkell, Inc., Edgewood, NY, USA | D640 | Used for electric pulp sensibility testing; maximum output 80 |
| ELISA kits | BioLegend | 430504 / 430515 / 430516 | Used for quantification of serum IL-1β, IL-6, and TNF-α |
| Etching agent | Henry Schein Inc. | 5701999TFA | Used for cavity etching after GIC setting |
| G*Power 3.1 | Heinrich Heine University Düsseldorf | Version 3.1.9.7 | Used for post hoc power analysis |
| Glass ionomer cement (GIC) | GC Fuji IX, GC Corporation, Tokyo, Japan | 0130F129-0010C | Coronal barrier placed directly over CGF in the CGF group; 2–3 mm layer. 1-1 PKG contains 10g powder + 6g liquid + 2×2g COCOA BUTTER; Mini Pack contains 5g powder + 2g liquid + 1×2g COCOA BUTTER. Powder-to-liquid ratio 3.6:1. Composition: 95% fluoroalumino-silicate glass, 5% polyacrylic acid (powder); 40% polyacrylic acid, 5–10% polybasic carboxylic acid, 50% water (liquid). |
| High-speed handpiece | Lares Research | 13124-222 | Used for pulp chamber access and removal of temporary sealing material |
| Image J software | National Institutes of Health | SCR_003070 | Used for radiographic measurements of root development parameters |
| iRoot BP Plus | Innovative Bioceramix, Vancouver, BC, Canada | 1807BPPS | Premixed bioceramic putty; coronal barrier placed directly over the blood clot in the control group; 2–3 mm layer. Composition: calcium silicates, zirconium oxide, tantalum pentoxide, calcium phosphate monobasic. Setting time: 2 h. Available in jar or syringe. |
| Light curing unit | 3M ESPE | 76975 | Used for light curing of adhesive |
| NewTom VGI evo CBCT unit | NewTom, Verona, Italy | P70700011 | Used for CBCT scans; tube voltage 80 kV, tube current 10 mA, exposure time 5 s, voxel size 0.2 mm, FOV 5 cm × 5 cm, scan time 30 s |
| NNTViewer software | NewTom, Verona, Italy | 5.5 | Used for measurement of CBCT gray values of newly formed intracanal tissue |
| Rubber dam | ULTRADENT PRODUCTS, INC. | 1824 | Used to isolate the affected tooth |
| SPSS | IBM, Armonk, NY, USA | 25 | Used for statistical analysis |
| Sterile 10-mL vacuum centrifuge tube without anticoagulant | BD Vacutainer, Becton Dickinson, Franklin Lakes, NJ, USA | 366703 | Used for venous blood collection for CGF preparation |
参考文献
- Patra A, et al. Cone-beam computed tomography evaluation timings of closure of open apex by using deciduous tooth pulp autotransplantation for the regenerative endodontic treatment of permanent teeth with pulp necrosis. Contemp Clin Dent. 2024;15(4):279–84.
- Dixit A, et al. Comparative evaluation of antimicrobial efficacy of various intracanal medicament in young permanent teeth: An in vivo study. J Indian Soc Pedod Prev Dent. 2024;42(3):203–10.
- Asgary S. Long-term success of regenerative endodontic treatment in managing traumatized teeth: A case report with seven-year follow-up. Cureus. 2024;16(3):e57012.
- Chauhan S, Chauhan R, Bhasin P, Sharaf BG. Present status and future directions: Apexification. World J Methodol. 2025;15(1):96923.
- Nagaraj NJ, et al. Fracture susceptibility in non-vital apex teeth following various modified apexification procedure – an in vitro study. J Pharm Bioallied Sci. 2024;16(Suppl 4):S3966–S3969.
- Chaiyosang P, Mahatnirunkul T, Leelapornpisid W. The effects of calcium hydroxide-loaded poly(lactic-co-glycolic acid) biodegradable nanoparticles in the ex vivo external inflammatory root resorption model. J Contemp Dent Pract. 2023;24(6):351–56.
- Kahler B, Swain MV. The calcium hydroxide controversy: Does calcium hydroxide weaken teeth? Dent Traumatol. 2025;41 Suppl 1:53–63.
- Acharya S, Sahoo D, Singh B, Gurunathan D. Revascularization revisited with modified triple antibiotic paste and NeoPutty MTA®. J Pharm Bioallied Sci. 2024;16(Suppl 2):S1871–S1874.
- Wei Y, et al. Neural regeneration in regenerative endodontic treatment: An overview and current trends. Int J Mol Sci. 2022;23(24):15492.
- Plakwicz P, et al. Pulp revascularization after autotransplantation of the mandibular canines with partially resected roots: Report of 5 cases with follow-ups between 26 and 80 months. J Endod. 2023;49(5):478–86.
- Domingues MM, Carvalho FA, Santos NC. Nanomechanics of blood clot and thrombus formation. Annu Rev Biophys. 2022;51:201–21.
- Alghofaily M, Torabinejad M, Nosrat A. Regenerative endodontic treatment using periapical blood or circulating blood as scaffold: A volumetric analysis. J Endod. 2022;48(5):625–31.
- Pecci-Lloret MP, et al. Scaffolds for pulp revitalisation: A systematic review of randomized clinical trials. Ann Anat. 2022;243:151936.
- Elayah SA, et al. Effect of concentrated growth factor (CGF) on postoperative sequel of completely impacted lower third molar extraction: A randomized controlled clinical study. BMC Oral Health. 2022;22(1):368.
- Yin X, et al. Effect of concentrated growth factor on distraction osteogenesis of dental implant distractors. J Oral Maxillofac Surg. 2022;80(5):889–96.
- Shrivastava R, et al. Effect of advanced platelet-rich fibrin and concentrated growth factor on tissues around implants in the maxillary anterior region. J Pharm Bioallied Sci. 2024;16(Suppl 3):S2191–S2193.
- Men B, Yang H, Zhang J. Preoperative CBCT guided bone regeneration combined with concentrated growth factor applied in the implantation of maxillary teeth with insufficient bone mass. Cell Mol Biol (Noisy-le-grand). 2022;68(12):68–73.
- Kavitha M, et al. Comparative evaluation of platelet-rich fibrin and concentrated growth factor as scaffolds in regenerative endodontic procedure: A randomized controlled clinical trial. J Contemp Dent Pract. 2022;23(12):1211–17.
- Usta SN, Avcı E, Oktay AN, Keskin C. Combination of chitosan nanoparticles, EDTA, and irrigation activation enhances TGF-β1 release from dentin: A laboratory study. J Endod. 2025;51(8):1081–87.
- Arslan H, et al. Regenerative endodontic procedures in necrotic mature teeth with periapical radiolucencies: A preliminary randomized clinical study. J Endod. 2019;45(7):863–72.
- Elheeny AAH, et al. A 12-month randomized controlled trial to assess the efficacy of revitalization of retreated mature incisors with periapical radiolucency in adolescents. Sci Rep. 2024;14(1):16366.
- Cho J, Sachs A, Cunningham LL Jr. Dental trauma and alveolar fractures. Facial Plast Surg Clin North Am. 2022;30(1):117–24.
- Saikiran KV, et al. Prevalence of dental trauma and their relationship to risk factors among 8-15-year-old school children. Int J Dent. 2022;2022:3343827.
- Burns LE, et al. Clinician decision-making for the endodontic treatment of immature permanent teeth: A national survey of pediatric dentists and endodontists. Int J Paediatr Dent. 2025;35(5):936–44.
- Cehreli ZC, Unverdi GE, Ballikaya E. Deciduous tooth pulp autotransplantation for the regenerative endodontic treatment of permanent teeth with pulp necrosis: A case series. J Endod. 2022;48(5):669–74.
- Hsieh SH, Chen WC, Huang TH. Revascularization and apexification of contralateral mandibular second premolars of the same patient: A case report. J Dent Sci. 2022;17(1):626–27.
- Keinan D, Asbi T, Shalish M, Slutzky-Goldberg I. An assessment of the effects of orthodontic treatment after apexification of traumatized immature permanent teeth: A retrospective study. J Endod. 2022;48(1):96–101.
- Caleza-Jiménez C, et al. Radiographic differences observed following apexification vs revascularization in necrotic immature molars and incisors: A follow-up study of 18 teeth. Eur Arch Paediatr Dent. 2022;23(3):381–89.
- Loroño G, et al. Regenerative endodontic procedure in an immature permanent incisor with internal root resorption: A case report. J Dent (Shiraz). 2022;23(2):155–60.
- Araújo L, et al. Do alternative scaffolds used in regenerative endodontics promote better root development than that achieved with blood clots? Braz Dent J. 2022;33(2):22–32.
- Li J, et al. Treatment outcome of regenerative endodontic procedures for necrotic immature and mature permanent teeth: A systematic review and meta-analysis based on randomised controlled trials. Oral Health Prev Dent. 2023;21:141–52.
- Li F, et al. Anti-inflammatory effect of dental pulp stem cells. Front Immunol. 2023;14:1284868.
- Honda M, Ohshima H. Biological characteristics of dental pulp stem cells and their potential use in regenerative medicine. J Oral Biosci. 2022;64(1):26–36.
- Stefańska K, et al. Dental pulp stem cells – a basic research and future application in regenerative medicine. Biomed Pharmacother. 2024;178:116990.
- Thalakiriyawa DS, Dissanayaka WL. Advances in regenerative dentistry approaches: An update. Int Dent J. 2024;74(1):25–34.
- Liu P, et al. Application of dental pulp stem cells in oral maxillofacial tissue engineering. Int J Med Sci. 2022;19(2):310–20.
- Luo X, et al. Odontoblasts release exosomes to regulate the odontoblastic differentiation of dental pulp stem cells. Stem Cell Res Ther. 2023;14(1):176.
- Liu K, et al. An innovative cell-based transplantation therapy for an immature permanent tooth in an adult: A case report. BMC Oral Health. 2024;24(1):646.
- Naji MA, Marzook HAEM, El Qashty RMN, Abdel-Rahman FH. Comparison between effect of bisphosphonates, concentrated growth factors or combination on rabbits' tibial bone defects healing: An experimental study. J Contemp Dent Pract. 2022;23(6):572–81.
- Yang F, et al. Comparative effects of concentrated growth factors on the biological characteristics of periodontal ligament cells and stem cells from apical papilla. J Endod. 2022;48(8):1029–37.
- Biswas KP, et al. Restoring vitality: The science and practice of pulp revascularization in endodontics. J Pharm Bioallied Sci. 2024;16(Suppl 3):S1941–S1943.