This study investigates the association between dietary vitamin B12 intake and diabetic kidney disease using NHANES data and transcriptomic analyses. Higher vitamin B12 intake was associated with lower odds of diabetic kidney disease, and P2RY14 was identified as a hypothesis-generating candidate.
研究文章
Vitamin B12 Intake and Diabetic Kidney Disease: A NHANES-Based Cross-Sectional Study with Transcriptomic Identification of P2RY14
本文内容
摘要
摘要
Diabetic kidney disease (DKD) is a major diabetic complication, and the association between vitamin B12 intake and DKD remains unclear. This cross-sectional study included 8,218 participants from the National Health and Nutrition Examination Survey (NHANES) 2011–2018. Multivariable logistic regression showed that participants in the highest vitamin B12 intake quartile had lower odds of DKD than those in the lowest quartile (Odds ratio (OR): 0.70; 95% confidence interval (CI): 0.50–0.97). Restricted cubic spline analysis indicated a significant nonlinear association between vitamin B12 intake and DKD. Transcriptomic analysis identified 493 differentially expressed genes (DEGs), of which 20 overlapped with cobalamin-related genes. P2RY14 was significantly upregulated in DKD and showed preliminary discriminatory ability across GSE30528, GSE30529, and GSE142025. Functional enrichment analyses suggested associations between P2RY14 and extracellular matrix–receptor interaction, focal adhesion, and kidney development. Exploratory molecular docking predicted a potential binding mode between MC-1 and P2RY14, with a Vina score of −6.0 kcal/mol. Overall, these findings support an association between vitamin B12 intake and DKD and identify P2RY14 as a hypothesis-generating candidate for further investigation.
引言
Diabetes mellitus (DM) is a metabolic disorder characterized by chronic hyperglycemia, arising from absolute or relative deficiencies in insulin secretion and/or insulin activity. It affects approximately 537 million people worldwide1. Over the past three decades, the global prevalence of DM has increased nearly fourfold, with approximately one in eleven adults being diagnosed, of whom 90% are affected by type 2 diabetes mellitus (T2DM)2. T2DM often leads to numerous microvascular and macrovascular complications, including cardiovascular disease, stroke, nephropathy, neuropathy, and retinopathy3. These complications significantly contribute to the increasing disability rates, diminished quality of life, and reduced life expectancy4,5. Of particular concern is diabetic kidney disease (DKD), a common microvascular complication of diabetes, which develops in approximately 20% of patients with DM6. DKD is characterized by persistent albuminuria and a progressive decline in glomerular filtration rate (GFR). If left unchecked, DKD may eventually lead to end-stage kidney disease (ESKD), where renal function becomes severely compromised, necessitating dialysis or kidney transplantation for survival7,8. Moreover, patients with DKD are at a heightened risk of developing cardiovascular disease, even in its early stages, and this comorbidity is associated with an increased risk of mortality, placing a substantial burden on healthcare systems9,10,11. Thus, it is crucial to thoroughly investigate the factors contributing to DKD progression. A deeper understanding of these factors is essential for devising effective therapeutic strategies to prevent both the onset and progression of DKD in clinical practice.
The B-class vitamins, a group of water-soluble vitamins, play a crucial role in cellular metabolism and homeostasis, maintaining physiological balance, antioxidant defense, and red blood cell synthesis12. The primary source of vitamin B is dietary intake. Due to their water-soluble nature, these vitamins are typically difficult to store in the human body12. Excess vitamin B is readily excreted in the urine; however, individual absorption, utilization, and metabolism may vary significantly13. Vitamin B deficiency can markedly impair cellular function and the immune system, leading to inflammation associated with hyperhomocysteinemia14. Factors such as vitamin B deficiency may contribute to the progression of chronic kidney disease (CKD) by influencing inflammatory and oxidative stress processes associated with renal function impairment and renal tissue pathology15. Among the B vitamins, vitamin B12, also known as cobalamin, is an essential water-soluble vitamin that plays a significant role in metabolism, particularly in DNA synthesis, methylation, and mitochondrial metabolism15. In patients with CKD and end-stage renal disease, various metabolic alterations-including acidosis, systemic inflammation, and hormonal imbalances-along with comorbidities and polypharmacy, can lead to malnutrition, subsequently resulting in vitamin B12 deficiency16. Numerous studies have established a correlation between low serum vitamin B12 concentrations and conditions such as elevated body mass index (BMI), insulin resistance, T2DM, dyslipidemia, and cardiovascular disease17. Conversely, potential toxicity associated with excessive vitamin B12 may exacerbate conditions in CKD patients18. Furthermore, a recent study indicated that higher concentrations of vitamin B12 are associated with increased all-cause mortality among patients undergoing hemodialysis19. However, the relationship between vitamin B12 intake and the occurrence of DKD has not been comprehensively investigated. Moreover, the molecular features that potentially link vitamin B12-related biological processes to DKD remain insufficiently characterized. Integrating population-based epidemiological evidence with transcriptomic data may therefore provide a complementary strategy for identifying candidate molecular features relevant to the observed association and for prioritizing targets for subsequent experimental investigation.
Given the current lack of understanding, we conducted a cross-sectional study using data from the NHANES database to investigate the association between vitamin B12 intake and DKD, controlling for a wide range of potential confounders. In parallel, transcriptomic datasets of DKD were analyzed to identify differentially expressed genes, which were subsequently intersected with vitamin B12-related genes to screen candidate molecules potentially relevant to DKD. This integrated approach may provide further insights into the association between vitamin B12 and DKD.
方案
The present study was a secondary analysis of publicly available and de-identified NHANES data and involved no new participant recruitment, intervention, or collection of personally identifiable information. Therefore, no additional informed consent was required for the present analysis.
Study population and participant selection
National Health and Nutrition Examination Survey (NHANES) uses a complex, multistage probability sampling design to collect nationally representative health and nutritional data from the U.S. population.
Data from 39,156 participants across four NHANES cycles (2011–2012, 2013–2014, 2015–2016, and 2017–2018) were initially considered. Participants were excluded if they met any of the following criteria: (1) age < 18 years; (2) missing dietary vitamin B12 intake data; (3) incomplete information required for diabetes assessment, including self-reported diabetes history, glycated hemoglobin (HbA1c), or fasting plasma glucose (FPG); or (4) incomplete information required for kidney disease assessment, including urinary albumin-to-creatinine ratio (ACR) or estimated glomerular filtration rate (eGFR) (Figure 1). After these exclusions, 8,218 participants with complete data required for the present analysis were included.
Definition of DM, CKD, and DKD
According to the criteria set by the American Diabetes Association and prior studies, DM was diagnosed based on the following: (1) a prior medical diagnosis, (2) FPG levels of ≥ 7.0 mmol/L, (3) HbA1c levels of ≥ 6.5%, or (4) self-reported insulin or anti-diabetic drug usage. CKD was identified20,21 in participants with an ACR ≥ 30 mg/g or an eGFR (eGFR = 175 × (serum creatinine in mg/dL)-1.154 × (age in years)-0.203 x (0.742 if female) x (1.21 if black)) < 60 mL/min/1.73 m2. DKD was defined as the presence of both DM and CKD20. Participants who met both the DM and CKD criteria were classified into the DKD group, whereas those who did not simultaneously meet both criteria were classified into the Non-DKD group. The Non-DKD group, therefore, included participants with DM but without CKD, participants with CKD but without DM, and participants with neither DM nor CKD.
Covariates
This study considered covariates that could influence the association between vitamin B12 and DKD. The demographic variables included age, sex, race/ethnicity, educational attainment, poverty-to-income ratio (PIR), marital status, alcohol consumption, smoking behavior, BMI, physical activity (PA), and the presence of hypertension and hyperlipidemia. Participants aged 18 years and older were included in this analysis and stratified into two age groups: young-to-middle-aged adults (18– < 60 years) and older adults (≥ 60 years). Sex was sorted out as male or female. Ethnic classifications included Mexican American, Other Hispanic, Non-Hispanic White, Non-Hispanic Black, and Other/Multi-Racial. Educational attainment was divided into three levels: less than high school, high school graduate, and college or higher. The PIR was classified into three categories: < 1.5, 1.5–3.49, and ≥ 3.521. Marital status was denoted as married/living with a partner, never married, or widowed/divorced. Smoking status was classified into three groups: current smokers (daily and intermittent smokers), former smokers (those who had smoked > 100 cigarettes in their lifetime but no longer smoke), and never smokers (those who had smoked < 100 cigarettes during their lifetime). Drinking status was classified into three categories: Heavy drinking (women: > 3 drinks per day; men: > 4 drinks per day), moderate drinking (women: 2 drinks per day; men: 3 drinks per day), light drinking (women: < 2 drinks per day; men: < 3 drinks per day)22. BMI was assigned as: < 25 kg/m2, 25–29.9 kg/m2, and ≥ 30 kg/m2. PA levels were categorized as low (< 600 MET-min/week), moderate (600 to < 3000 MET-min/week), and high (≥ 3000 MET-min/week). Hyperlipidemia was confirmed with the following criteria (meet one of the following): (1) total cholesterol (TC) levels ≥ 200 mg/dL; (2) total triglycerides (TG) levels ≥ 150 mg/dL; (3) men: high-density lipoprotein (HDL) levels < 40 mg/dL; women: HDL levels < 50 mg/dL; (4) low density lipoprotein (LDL) levels ≥ 130 mg/dL; or (5) use of antihyperlipidemic medication.
In addition, biochemical indicators and dietary intakes were also taken into account, including urinary albumin-creatinine ratio (ACR), serum uric acid (μmol/L), eGFR (mL/min/1.73m2), serum creatinine (Scr), blood urea nitrogen (BUN), serum TC, TG, serum alanine aminotransferase (ALT), serum aspartate aminotransferase (AST), dietary intakes such as energy intake (kcal), protein (g), carbohydrate (g), total fat (g), sodium (mg), potassium (mg), etc.
Independent variable
Dietary vitamin B12 intake was used as the primary exposure variable. Nutrient intake data were obtained from the NHANES Total Nutrient Intake files, which summarize daily nutrient intake from foods and beverages. Vitamin B12 intake from dietary supplements was not included. Only participants with valid dietary recall data for both days were included, and the mean vitamin B12 intake across the two recall days was calculated and expressed as μg/day. The resulting dietary vitamin B12 intake was categorized into quartiles (Q1–Q4) for the primary multivariable analyses.
Data sources and gene set collection
The DKD expression datasets GSE30528 and GSE30529 were obtained from the Gene Expression Omnibus (GEO) database. Both datasets were generated on the GPL571 platform. GSE30528 comprised 9 DKD glomerular samples and 13 normal control glomerular samples, whereas GSE30529 comprised 10 DKD tubular samples and 12 normal control tubular samples. For both microarray datasets, RMA-normalized, log2-transformed expression data were obtained directly from GEO. Probe identifiers were mapped to gene symbols according to the GPL571 platform annotation file. When multiple probes mapped to the same gene, their mean expression value was used to represent gene-level expression.
GSE142025, an RNA-seq dataset, was additionally included for candidate-gene validation. TPM expression data were obtained from GEO and log2-transformed before subsequent analysis. Gene annotation was performed using the hg19 reference genome annotation. Because each dataset was analyzed independently and expression matrices from different datasets were not directly combined, no cross-dataset batch-effect correction was applied.
A total of 716 cobalamin (vitamin B12)-related genes were retrieved from the GeneCards database on March 13, 2026, using the keyword “COBALAMIN.” No relevance-score cutoff or additional filtering criterion was applied, and all 716 retrieved genes were retained as the vitamin B12-related gene set.
Differential expression and functional enrichment analysis
Differential expression analysis between DKD and normal samples was performed using the 'limma' R package (version 3.56.2)23, with differentially expressed genes (DEGs) identified based on |log2FC| > 1 and a false discovery rate (FDR) < 0.05. To identify candidate genes related to vitamin B12 metabolism, the ggvenn R package (version 0.1.19) was used to perform an intersection analysis between the identified DEGs and the vitamin B12-related gene set obtained from the GeneCards database. The overlapping genes were visualized using a Venn diagram and retained as candidate genes for subsequent analyses. Functional enrichment analysis of the DEGs was then conducted using the 'clusterProfiler' R package (version 4.8.3)24, covering Gene Ontology (GO) terms (biological process, molecular function, and cellular component) and Kyoto Encyclopedia of Genes and Genomes (KEGG) pathways. Enrichment terms with an adjusted p-value < 0.05 were considered statistically significant.
Gene set enrichment analysis (GSEA)
In the GSE30528 dataset, samples were divided into P2RY14-high and P2RY14-low groups according to the median P2RY14 expression level. Differential expression analysis was then performed between the two groups, and all genes were ranked in descending order according to the resulting logFC values. GSEA was subsequently performed using the clusterProfiler R package (version 4.8.3)24. GO and KEGG gene sets were obtained using the msigdbr package from the MSigDB database (version v2025.1.Hs). Enriched gene sets with an adjusted p-value < 0.05 were considered statistically significant.
Protein–protein interaction (PPI) networks
Protein functional associations and PPI networks were analyzed using the STRING database (version 11.0) (https://string-db.org/)25, with Homo sapiens selected as the organism and a minimum interaction confidence score of 0.4. The resulting PPI network was visualized using Cytoscape26. In addition, the same 20 overlapping candidate genes were submitted to the GeneMANIA online platform to further characterize their functional associations. GeneMANIA integrated multiple types of evidence, including gene co-expression, physical interactions, genetic interactions, shared protein domains, and pathway information, with Homo sapiens selected as the organism and the remaining parameters set to default.
Drug–target screening
To identify potential compounds associated with P2RY14, drug–target information was retrieved from the GeneCards database, yielding five candidate compounds. These candidates were subsequently cross-referenced with the DGIdb database. MC-1 (DrugBank ID: DB05315; PubChem CID: 1051) was identified in both databases and was therefore selected for subsequent exploratory molecular docking analysis.
Molecular docking analysis
To explore the potential binding mode between MC-1 and P2RY14, molecular docking was performed using the CB-Dock2 online platform, which integrates cavity detection with the AutoDock Vina docking engine. The three-dimensional structure of MC-1 (PubChem CID: 1051) was obtained from PubChem, and the predicted three-dimensional model of P2RY14 was obtained from the AlphaFold Protein Structure Database (AF-Q15391-F1-model_v4). The average pLDDT score of the P2RY14 model was 87.12, while the local pLDDT score of the predicted binding-pocket region was > 90, indicating high confidence in the local predicted structure. A cavity-guided blind docking strategy was employed. Candidate binding cavities were searched across the entire P2RY14 structure, and the five cavities with the largest predicted volumes were evaluated. Hydrogen atoms were added during receptor and ligand preparation to approximate protonation states under physiological conditions (approximately pH 7.4). The receptor was treated as rigid, whereas the ligand was treated as flexible with rotatable bonds allowed. Eight independent docking runs were performed. The pose with the lowest Vina score was selected as the representative predicted binding mode. The resulting receptor–ligand complex was visualized and analyzed using Discovery Studio (version 4.5).
Statistical analysis
Given the complex, multistage, stratified probability sampling design of NHANES, all NHANES-based analyses incorporated appropriate survey weights, strata, and primary sampling units (PSUs). Because vitamin B12 intake was calculated from two dietary recall days, the two-day dietary sample weight (WTDR2D) was used. For the four combined NHANES cycles (2011–2018), the 8-year dietary sample weight was calculated as WTDR2D/4, with SDMVSTRA and SDMVPSU incorporated to account for stratification and clustering. Continuous variables were expressed as mean ± standard deviation (SD), and categorical variables as counts and percentages. Between-group differences were assessed using weighted t-tests and weighted chi-square tests. Multivariable logistic regression was used to evaluate the association between vitamin B12 intake and DKD. Model 1 was unadjusted; Model 2 was adjusted for age, sex, race/ethnicity, marital status, and educational attainment; and Model 3 was adjusted for all covariates, including total energy intake and other dietary covariates. All regression analyses incorporated WTDR2D/4, SDMVSTRA, and SDMVPSU. Vitamin B12 intake quartiles (Q1–Q4) were used as the primary exposure, with continuous vitamin B12 intake additionally analyzed as a supplementary exposure. Subgroup analyses were conducted according to age, sex, BMI, eGFR, ACR, hypertension, and hyperlipidemia. Restricted cubic spline (RCS) analysis was performed using the fully adjusted Model 3 to assess potential nonlinearity. Four knots were placed at the 5th, 35th, 65th, and 95th percentiles of vitamin B12 intake, with 3.24 μg/day used as the reference value for graphical presentation. This reference value was derived from the subsequent exploratory breakpoint analysis and was not interpreted as a clinically recommended intake level. RCS analyses also incorporated WTDR2D/4, SDMVSTRA, and SDMVPSU, and nonlinearity was assessed using a Wald test. When significant nonlinearity was detected, potential breakpoints were identified using a recursive search procedure combined with the minimum Akaike information criterion (AIC), followed by a three-segment piecewise regression analysis. Sensitivity analyses were performed using alternative RCS specifications with three and five knots27. ROC curve analysis was performed to preliminarily assess the discriminatory ability of P2RY14, with 95% confidence intervals reported for the AUCs. A p-value < 0.05 was considered statistically significant. All statistical analyses were conducted using R software (version 4.4.1).
结果
Baseline characteristics
A total of 8,218 participants from NHANES 2011–2018 were included, of whom 623 were classified as having DKD and 7,595 as Non-DKD. Significant differences between the DKD and Non-DKD groups were observed in age, sex, race/ethnicity, marital status, educational attainment, PIR, BMI, blood pressure, hypertension, alcohol consumption, smoking status, vitamin B12 intake, and dietary intake (all p < 0.05). Significant differences were also observed in ACR, eGFR, Scr, BUN, TC, and TG (Table 1).
Significant differences across vitamin B12 intake quartiles were observed in educational attainment, hypertension, DKD status, and energy intake. In contrast, no significant differences were observed across quartiles in age, marital status, BMI, blood pressure, alcohol consumption, eGFR, ACR, serum uric acid, Scr, or TG (Table 2).
Association between vitamin B12 and DKD
Vitamin B12 intake was categorized into quartiles (Q1–Q4), and the results of the multivariable logistic regression analyses are presented in Table 3. In the fully adjusted Model 3, participants in the highest quartile of vitamin B12 intake (Q4) had significantly lower odds of DKD than those in the lowest quartile (Q1) (OR = 0.70, 95% CI: 0.50–0.97, p = 0.034), whereas no significant associations were observed for Q2 (OR = 1.14, 95% CI: 0.85–1.53, p = 0.386) or Q3 (OR = 0.94, 95% CI: 0.69–1.28, p = 0.684). Moreover, the linear trend in the fully adjusted model did not reach statistical significance (p for trend = 0.086), although the overall direction of the association was inverse. These findings suggest that higher vitamin B12 intake, particularly at the highest quartile, was associated with lower odds of DKD, but the results do not support a stable linear dose–response relationship between vitamin B12 intake and DKD.
Subgroup analyses of the association between vitamin B12 and DKD
Subgroup analyses were performed to examine whether the association between vitamin B12 intake and DKD was consistent across different participant characteristics. In Model 1, participants in the highest vitamin B12 intake quartile (Q4) had significantly lower odds of DKD than those in Q1 in both the male and female subgroups (p < 0.05; Table 4). The associations across ACR subgroups were more heterogeneous. Among participants with ACR < 30 mg/g, significant associations were observed for some intermediate vitamin B12 intake quartiles, whereas the pattern was attenuated after stratification by higher ACR levels. No significant associations were observed across the eGFR subgroups.
Nonlinear relationship between vitamin B12 and DKD
The fully adjusted RCS analysis showed a significant nonlinear association between vitamin B12 intake and DKD (Figure 2, p for non-linearity = 0.037). The RCS model used four knots located at the 5th, 35th, 65th, and 95th percentiles of the vitamin B12 intake distribution, with 3.24 μg/day used as the reference value. Subsequent breakpoint analysis identified two data-driven breakpoints at 3.24 μg/day (95% CI: 2.86–3.62) and 8.36 μg/day (95% CI: 7.52–9.20), dividing vitamin B12 intake into three ranges. For vitamin B12 intake < 3.24 μg/day, no significant association with DKD was observed (OR = 1.07, p = 0.575). Within the range of 3.24–8.36 μg/day, vitamin B12 intake was inversely associated with DKD (OR = 0.87, p = 0.025). For intake > 8.36 μg/day, no significant association was observed (OR = 1.00, p = 0.995) (Table 5). These findings were consistent with a nonlinear pattern, with a significant inverse association observed only within the intermediate intake range. To assess the robustness of these findings, sensitivity analyses were performed using alternative RCS specifications with three and five knots. Similar overall association patterns were observed, with statistically significant overall associations across Models 1–3 under both knot specifications, while the five-knot models further supported a nonlinear relationship (Supplementary Figure 1).
Identification of candidate vitamin B12-related genes in DKD
In the GSE30528 dataset, we identified 493 DEGs between DKD and normal samples, comprising 126 upregulated and 367 downregulated genes (|log₂FC| > 1, FDR < 0.05; Figure 3A,B, Supplementary Table 1). KEGG pathway analysis revealed significant enrichment of these DEGs in extracellular matrix (ECM)-receptor interaction, focal adhesion, integrin signaling, and regulation of actin cytoskeleton pathways (Figure 3C, Supplementary Table 2). GO enrichment analysis further indicated that DEGs were predominantly associated with collagen-containing ECM, glomerulus development, focal adhesion, and nephron development (Figure 3D, Supplementary Table 2).
The intersection analysis of the DEGs and the vitamin B12-related gene set identified 20 overlapping candidate genes (Figure 3E). These genes were subsequently used to construct a PPI network using the STRING database, with interactions filtered to a minimum confidence score of 0.4. The resulting network consisted of 11 nodes and 20 edges, representing proteins and their interactions, respectively (Figure 3F). The relationships among the 20 candidate genes were further visualized using GeneMANIA (Figure 3G).
Exploratory characterization of P2RY14 as a candidate vitamin B12-related gene in DKD
Based on the observed association between vitamin B12 intake and DKD status, we next sought to identify key vitamin B12-related genes implicated in DKD pathogenesis using transcriptomic analysis. Among the 20 overlapping candidate genes, we further compared their expression patterns across different DKD datasets. In the GSE30528 and GSE30529 datasets, P2RY14 expression was significantly upregulated in DKD samples compared with normal controls (Figure 4A,B). P2RY14 encodes a G protein-coupled receptor and has been reported to be involved in immune-cell chemotaxis, cytoskeletal rearrangement, inflammatory responses, and oxidative stress28,29. However, its role in DKD has not yet been directly investigated. Considering its consistent upregulation across independent DKD datasets and its potential biological relevance, P2RY14 was prioritized for subsequent validation and functional analyses. ROC curve analysis was subsequently performed to preliminarily evaluate the discriminatory ability of P2RY14. In the discovery dataset GSE30528, the AUC was 0.923 (95% CI: 0.807–1.000), while in the preliminary external validation dataset GSE30529, the AUC was 0.883 (95% CI: 0.744–1.000). In the additional validation dataset GSE142025, the AUC was 0.663 (95% CI: 0.478–0.847), indicating limited discriminatory ability (Figure 4C–E). Taken together, these findings provide preliminary evidence for the potential discriminatory value of P2RY14, although its diagnostic performance requires further validation in larger independent cohorts.
To explore biological functions and pathways associated with P2RY14 expression in DKD, GSE30528 samples were divided into P2RY14-high and P2RY14-low groups according to the median expression level of P2RY14. Differential-expression analysis was performed between the two groups. GO and KEGG enrichment analyses were then conducted to characterize the biological functions and pathways associated with P2RY14 expression. GO enrichment analysis revealed that P2RY14 was associated with collagen-containing ECM, glomerulus development, ECM structural constituent, and kidney development (Figure 4F, Supplementary Table 3). KEGG analysis further implicated P2RY14 in ECM–receptor interaction, focal adhesion, and complement and coagulation cascades (Figure 4G, Supplementary Table 3).
In addition, GSEA showed that the NF-κB signaling pathway and TNF signaling pathway were significantly enriched in the P2RY14-high group, suggesting that high P2RY14 expression may be associated with inflammatory signaling in DKD (Figure 4H, Supplementary Table 3).
Exploratory molecular docking of MC-1 with P2RY14
Five candidate compounds associated with P2RY14 were identified through GeneCards and DGIdb screening, and MC-1 was selected for exploratory molecular docking analysis (Figure 5A). Using MC-1 as the ligand and P2RY14 as the receptor, the docking analysis predicted a potential binding pose of MC-1 within a candidate pocket of P2RY14, with a Vina score of −6.0 kcal/mol. The predicted pose involved interactions with Tyr, Lys, Asn, Asp, and Glu residues and the formation of seven hydrogen bonds (Figure 5B–D).
Data Availability Statement
The data used in this study are publicly available. NHANES data from the 2011–2018 survey cycles are available from the National Center for Health Statistics. Transcriptomic datasets GSE30528, GSE142025, and GSE30529 are publicly available in the Gene Expression Omnibus (GEO) database. The processed differential expression, functional enrichment, and GSEA results generated in this study are provided in the Supplementary Files.
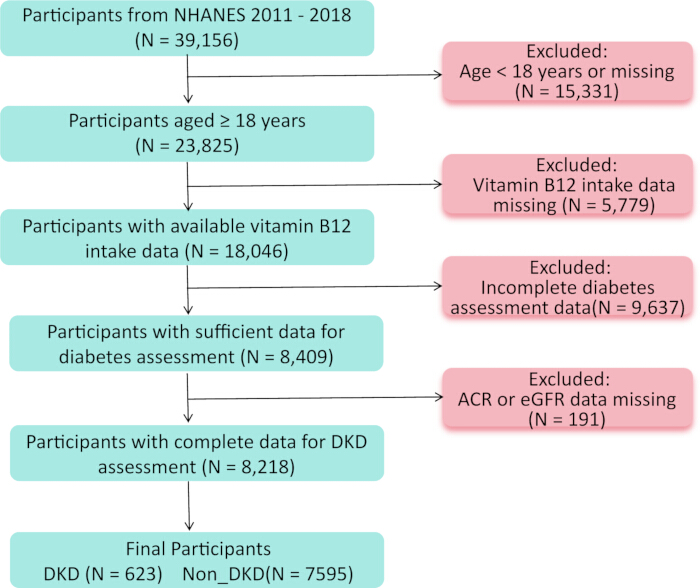
Figure 1: Flowchart of participant selection for the NHANES analysis. The flowchart shows the sequential exclusion criteria applied to participants from the 2011–2018 NHANES cycles and the final study population included in the analysis. Please click here to view a larger version of this figure.
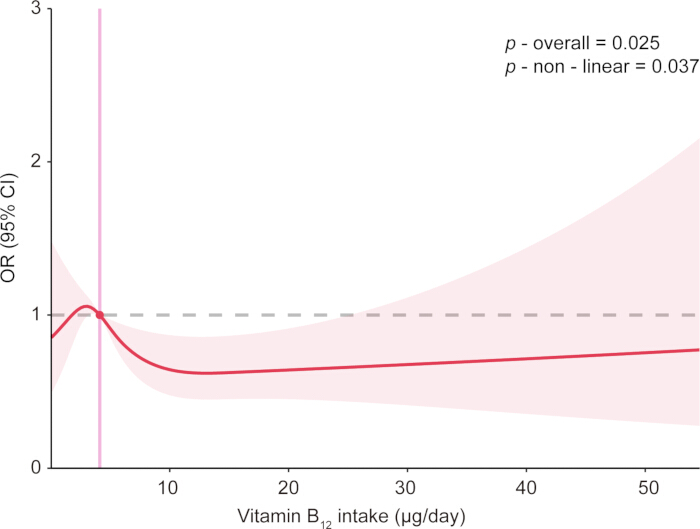
Figure 2: Nonlinear association between vitamin B12 intake and DKD using a restricted cubic spline model. The solid line represents the estimated odds ratio for DKD across dietary vitamin B12 intake, and the shaded area represents the 95% confidence interval. The model was adjusted using the covariates included in Model 3. Please click here to view a larger version of this figure.
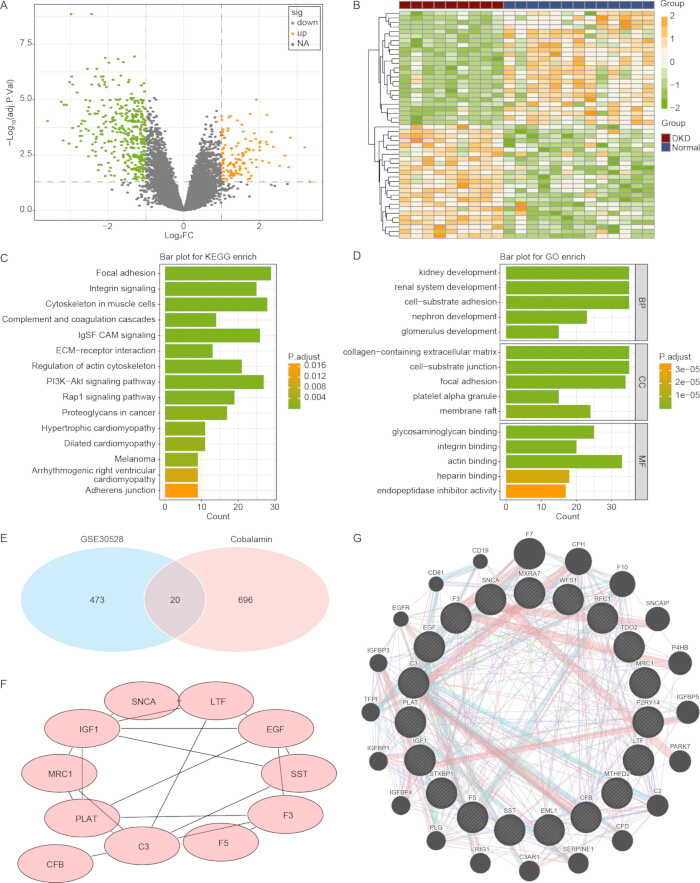
Figure 3: Identification of candidate vitamin B12-related genes in DKD. (A,B) Volcano plot and heatmap showing the expression profiles of DEGs between diabetic kidney disease (DKD) and normal samples in the GSE30528 dataset. (C,D) Top 15 enriched KEGG pathways and GO terms of DEGs. (E) Cross-analysis between DEGs and vitamin B12-related genes. (F) Protein-protein interaction (PPI) network. (G) GeneMANIA network of the 20 vitamin B12‑related genes. Please click here to view a larger version of this figure.
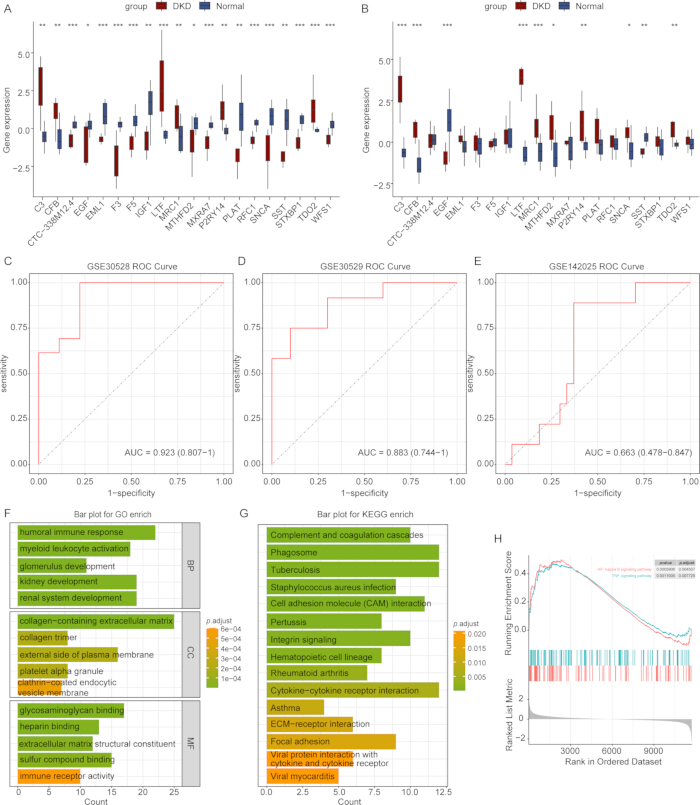
Figure 4: Exploratory characterization of P2RY14 as a candidate vitamin B12-related gene in DKD. (A,B) Box plots showing the expression levels of the overlapping candidate genes in DKD samples and normal controls in the GSE30528 and GSE30529 datasets, respectively. (C–E) Receiver operating characteristic (ROC) curve analyses of P2RY14 in the GSE30528, GSE30529, and GSE142025 datasets, respectively. (F) Gene Ontology (GO) enrichment analysis. (G) Kyoto Encyclopedia of Genes and Genomes (KEGG) pathway enrichment analysis. (H) GSEA of the P2RY14-high and P2RY14-low groups showing enrichment of the NF-κB and TNF signaling pathways in GSE30528. Please click here to view a larger version of this figure.
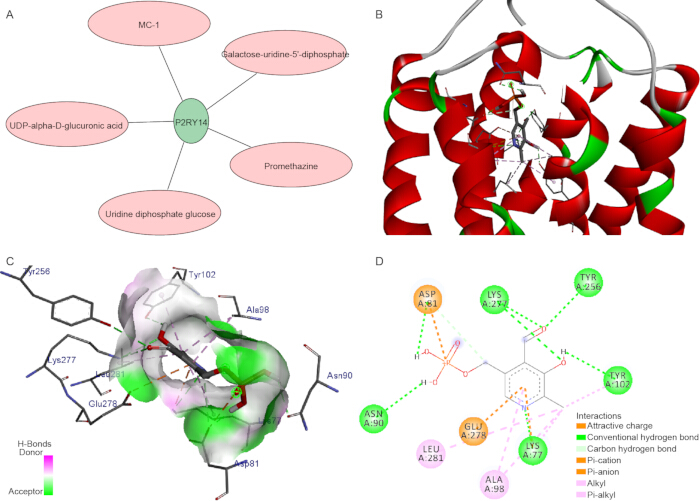
Figure 5: Drug–target screening and exploratory molecular docking analysis of P2RY14. (A) Drug-target interaction network of P2RY14-associated drugs. (B–D) Molecular docking of MC-1 with the P2RY14 protein. Please click here to view a larger version of this figure.
Table 1: Basic characteristics of the study population. Demographic, clinical, biochemical, and dietary characteristics of participants according to DKD status are presented. Continuous and categorical variables are summarized using survey-weighted analysis. Please click here to download this Table.
Table 2: Basic characteristics of participants according to vitamin B12 intake quartiles. Demographic, clinical, biochemical, and dietary characteristics of the study population are presented across quartiles of dietary vitamin B12 intake. Please click here to download this Table.
Table 3: Association between vitamin B12 intake and DKD status among U.S. adults. Odds ratios (ORs) and 95% confidence intervals (CIs) for the association between dietary vitamin B12 intake and DKD status are presented across progressively adjusted logistic regression models, with the lowest vitamin B12 intake quartile (Q1) as the reference group. Please click here to download this Table.
Table 4: Association between vitamin B12 intake and DKD status in subgroup analyses. Odds ratios (ORs) and 95% confidence intervals (CIs) for DKD are presented across vitamin B12 intake quartiles, stratified by age, sex, BMI, eGFR, ACR, hypertension, and hyperlipidemia subgroups, and adjusted for the specified models. Please click here to download this Table.
Table 5: Three-segment piecewise regression analysis of the association between vitamin B12 intake and DKD. Associations between dietary vitamin B12 intake and DKD are presented for the three intake ranges defined by the two data-driven breakpoints at 3.24 and 8.36 μg/day. Please click here to download this Table.
Supplementary Figure 1: Sensitivity analyses of the association between dietary vitamin B12 intake and DKD using restricted cubic spline models. (A–C) Models with three knots. (D–F) Models with five knots. The solid line represents the estimated OR, the shaded area represents the 95% CI, and the dashed line indicates OR = 1. p values for the overall association and nonlinearity are shown in each panel.Please click here to download this file.
Supplementary Table 1: Differentially expressed genes between diabetic kidney disease (DKD) and normal samples in the GSE30528 dataset. Differential expression results for genes identified with |log₂FC| > 1 and FDR < 0.05 are presented alongside the cobalamin-related gene set used for candidate gene screening.Please click here to download this file.
Supplementary Table 2: Functional enrichment analysis of differentially expressed genes in DKD. Gene Ontology (GO) and Kyoto Encyclopedia of Genes and Genomes (KEGG) enrichment results for the differentially expressed genes identified in the GSE30528 dataset are presented.Please click here to download this file.
Supplementary Table 3: Functional enrichment and gene set enrichment analysis results associated with P2RY14 in the GSE30528 dataset. GO, KEGG, and GSEA results used to characterize P2RY14-associated biological functions and pathways are presented.Please click here to download this file.
讨论
In this nationally representative cross-sectional analysis of 8,218 U.S. adults, higher vitamin B12 intake was associated with lower odds of DKD, although the association did not follow a simple linear dose–response pattern. Participants with higher vitamin B12 intake also tended to have higher educational attainment, lower prevalence of hypertension and DKD, and greater energy intake. These differences suggest that vitamin B12 intake may be accompanied by broader demographic, health, and dietary characteristics, which should be considered when interpreting the observed association. Overall, our findings support an association between vitamin B12 intake and DKD status.
Quartile-based analysis showed that participants in Q4 had significantly lower odds of DKD than those in Q1, whereas no significant associations were observed for Q2 or Q3. The linear trend across quartiles was also not statistically significant (p for trend = 0.086), suggesting that the association may not follow a simple linear dose–response pattern. Consistent with this finding, RCS analysis demonstrated a significant nonlinear association (p for nonlinearity = 0.037). Subsequent breakpoint analysis identified two data-driven breakpoints at 3.24 and 8.36 μg/day. A significant inverse association was observed only within the intermediate range of 3.24–8.36 μg/day, whereas no significant associations were observed below or above this range. Importantly, these breakpoints were derived from the present dataset and should be regarded as exploratory statistical values rather than clinically established thresholds. Accordingly, the 3.24–8.36 μg/day interval should not be interpreted as an optimal or recommended intake range without external validation. Overall, these findings support a potentially nonlinear association between vitamin B12 intake and DKD rather than a stable linear dose–response relationship.
Vitamins are essential micronutrients involved in multiple metabolic processes and have been associated with cardiometabolic health30,31. Previous studies have also suggested that several vitamins may be relevant to diabetes and its complications. For example, vitamin B6 status has been inversely associated with diabetes and diabetic complications31, while altered vitamin D levels have been reported in DKD and diabetic nephropathy32,33. These findings highlight the potential importance of micronutrient status in diabetes-related metabolic and renal abnormalities and provide a rationale for further examining the relationship between vitamin B12 intake and DKD.
Epidemiological studies have reported inconsistent findings regarding the relationship between vitamin B12 status or intake and diabetes-related outcomes. A recent NHANES analysis reported a positive association between diabetes duration and serum vitamin B12 levels34. In contrast, a study conducted in Uganda found that advancing kidney disease in patients with T2DM was accompanied by lower vitamin B12 intake and higher homocysteine concentrations35. Wu et al. further reported that combined supplementation with folic acid and vitamin B12 in patients with diabetes and diabetic nephropathy reduced serum homocysteine and malondialdehyde levels, increased nitric oxide and superoxide dismutase activity, and decreased urinary microalbumin excretion36. Other studies have also reported a relatively high prevalence of vitamin B12 deficiency among patients with T2DM37,38,39,40,41. Consistent with the possibility that vitamin B12 status may be relevant to diabetic complications, our study found that higher dietary vitamin B12 intake was associated with lower odds of DKD.
The observed inverse association between vitamin B12 intake and DKD may be biologically plausible, given vitamin B12's roles in homocysteine metabolism, oxidative stress regulation, inflammatory responses, and cellular energy metabolism42,43. Vitamin B12 deficiency has also been associated with metabolic abnormalities, and an imbalance characterized by excessive folate intake combined with vitamin B12 deficiency may contribute to impaired glucose metabolism and T2DM44,45. These observations highlight the importance of maintaining adequate and balanced micronutrient intake in metabolic health. Consistent with this background, our study found that higher dietary vitamin B12 intake was associated with lower odds of DKD. Further studies are warranted to clarify the dose–response relationship between vitamin B12 intake and kidney health in individuals with diabetes, validate the intake ranges observed in the present study in independent populations, and determine whether vitamin B12 supplementation is clinically relevant in this population.
Transcriptomic analysis further identified P2RY14 as a candidate gene associated with DKD. P2RY14 showed relatively high AUC values in GSE30528 and GSE30529, whereas its discriminatory ability was more modest in GSE142025. Given the limited sample sizes, these findings should be regarded as preliminary and require validation in larger independent cohorts. In addition, functional enrichment analyses suggested that P2RY14 may be associated with ECM organization, focal adhesion, and kidney development, supporting further investigation of its potential role in DKD.
More broadly, the integration of population-based nutritional epidemiology with transcriptomic analysis provides a complementary framework for linking dietary exposures with disease-related molecular features. Such an approach may facilitate hypothesis generation in nutritional epidemiology and DKD research and help prioritize candidate molecular targets for subsequent experimental validation. However, these findings remain exploratory and do not establish clinical, diagnostic, or therapeutic utility.
A major limitation of the present study is the heterogeneous composition of the Non-DKD group, which included participants with different DM and CKD statuses rather than being restricted to individuals with DM without CKD. Residual differences in diabetes status, kidney function, and general health may therefore have influenced the observed associations. In addition, the cross-sectional design precludes inference regarding temporal or causal relationships. Accordingly, the epidemiological findings should be interpreted as population-level associations with DKD status, and future prospective studies focusing on individuals with diabetes are warranted. Moreover, dietary vitamin B12 intake was estimated from two 24-h dietary recalls, which may be affected by day-to-day dietary variation and recall error and may therefore not fully reflect habitual long-term vitamin B12 intake. This may have introduced some degree of exposure measurement error. Several limitations of the transcriptomic and molecular docking analyses should also be acknowledged. NHANES and GEO data were derived from independent populations, and direct regulation of P2RY14 by vitamin B12 was not experimentally evaluated. The overlap between DKD-related DEGs and cobalamin-related genes was used for exploratory candidate screening, and its enrichment beyond random expectation was not formally tested. Thus, P2RY14 should be regarded as a hypothesis-generating candidate, the biological relevance of which requires further validation. In addition, the predicted interaction between MC-1 and P2RY14 was based on molecular docking alone and should be considered exploratory. Future studies incorporating vitamin B12 intervention, P2RY14 functional analyses, and direct binding or receptor functional assays, such as surface plasmon resonance or microscale thermophoresis, are needed to further evaluate these predicted relationships.
Conclusion
In conclusion, our study supports an association between vitamin B12 intake and DKD status, with higher vitamin B12 intake associated with lower odds of DKD and a potentially nonlinear relationship. Transcriptomic analysis further identified P2RY14 as a hypothesis-generating candidate associated with DKD, while exploratory molecular docking predicted a potential binding mode between P2RY14 and MC-1. These findings provide a basis for further investigation into the relationship between vitamin B12 intake and DKD, as well as the potential biological relevance of P2RY14.
披露
The authors have no conflicts of interest to declare.
Author Contributions:
A.Z. wrote the main manuscript text. G.Z. and J.D. prepared figures and tables. J.L. reviewed and edited the manuscript. All authors reviewed the manuscript.
材料
| 姓名 | 公司 | 目录编号 | 评论 |
|---|---|---|---|
| Affymetrix Human Genome U133A 2.0 Array | Affymetrix; indexed by NCBI GEO | https://www.ncbi.nlm.nih.gov/geo/query/acc.cgi?acc=GPL571 | GPL571 (HG-U133A_2) |
| AlphaFold | Google DeepMind / EMBL-EBI | https://alphafold.ebi.ac.uk/ | / |
| AutoDock | Olson Laboratory, The Scripps Research Institute | https://autodock.scripps.edu/ | Version 4.2.6 (AutoDock 4.2.6) |
| autoReg | R package | Version 0.3.3 (autoReg) | |
| CB-dock2 | / | http://183.56.231.194:8001/cb-dock2/index.php | CB-dock2 |
| clusterProfiler | Bioconductor; Yu et al. | Version 4.8.3 (PMID: 22455463) | |
| Cytoscape | Cytoscape Consortium | https://cytoscape.org/ | Version 3.7.2 (PMID: 14597658) |
| DGldb | / | https://dgib.org/ | DGldb |
| GeneMANIA | GeneMANIA team | http://genemania.org/ | GeneMANIA |
| Gene Expression Omnibus (GEO) | National Center for Biotechnology Information (NCBI), U.S. National Library of Medicine | https://www.ncbi.nlm.nih.gov/geo/ | GEO |
| GSE30528 | NCBI GEO | https://www.ncbi.nlm.nih.gov/geo/query/acc.cgi?acc=GSE30528 | Public GEO series (GSE30528; BioProject PRJNA154757) |
| GSE30529 | NCBI GEO | https://www.ncbi.nlm.nih.gov/geo/query/acc.cgi?acc=GSE30529 | Public GEO series (GSE30529) |
| GeneCards – The Human Gene Database | Weizmann Institute of Science / LifeMap Sciences | https://www.genecards.org/ | GeneCards |
| GSEA / MSigDB | / | https://www.gsea-msigdb.org/gsea/index.jsp | v2025.1.Hs (GSEA / MSigDB) |
| Gene Ontology (GO) | Gene Ontology Consortium | https://geneontology.org/ | GO |
| Kyoto Encyclopedia of Genes and Genomes (KEGG) | Kanehisa Laboratories | https://www.kegg.jp/ | KEGG |
| limma | Bioconductor; Ritchie et al. | Version 3.56.2 (PMID: 25605792) | |
| National Health and Nutrition Examination Survey (NHANES) | National Center for Health Statistics (NCHS), Centers for Disease Control and Prevention (CDC) | http://www.cdc.gov/nchs/nhanes/index.htm | 2011–2018 (four cycles 2011–2012; 2013–2014; 2015–2016; 2017–2018) |
| nhanesA | R package | Version 1.0 (nhanesA) | |
| pROC | R package | Version 1.18.5 (pROC) | |
| PubChem | NCBI, U.S. National Library of Medicine | https://pubchem.ncbi.nlm.nih.gov/ | PubChem |
| rms | R package | Version 8.1-0 (rms) | |
| R software | R Foundation for Statistical Computing | https://www.r-project.org/ | Version 4.4.1 |
| segmented | R package | Version 2.1-4 (segmented) | |
| STRING | STRING Consortium | https://string-db.org/ | Version 11.0 (PMID: 30476243) |
| survey | R package | Version 4.4-8 (survey; svydesign(); svyglm()) | |
| tableone | R package | tableone; svyCreateTableOne() |
参考文献
- Forst T, et al. New strategies to improve clinical outcomes for diabetic kidney disease. BMC Med. 2022;20(1):337.
- Zheng Y, Ley SH, Hu FB. Global aetiology and epidemiology of type 2 diabetes mellitus and its complications. Nat Rev Endocrinol. 2018;14(2):88-98.
- Zhang Y, Sun X, Icli B, Feinberg MW. Emerging Roles for MicroRNAs in Diabetic Microvascular Disease: Novel Targets for Therapy. Endocr Rev. 2017;38(2):145-68.
- Lyssenko V, Vaag A. Genetics of diabetes-associated microvascular complications. Diabetologia. 2023;66(9):1601-13.
- Valencia WM, Florez H. How to prevent the microvascular complications of type 2 diabetes beyond glucose control. BMJ. 2017;356:i6505.
- Hung PH, Hsu YC, Chen TH, Lin CL. Recent Advances in Diabetic Kidney Diseases: From Kidney Injury to Kidney Fibrosis. Int J Mol Sci. 2021;22(21).
- McGrath K, Edi R. Diabetic Kidney Disease: Diagnosis, Treatment, and Prevention. Am Fam Physician. 2019;99(12):751-9.
- Lin YC, Chang YH, Yang SY, Wu KD, Chu TS. Update of pathophysiology and management of diabetic kidney disease. J Formos Med Assoc. 2018;117(8):662-75.
- Sabanayagam C, et al. Association of Diabetic Retinopathy and Diabetic Kidney Disease With All-Cause and Cardiovascular Mortality in a Multiethnic Asian Population. JAMA Netw Open. 2019;2(3):e191540.
- Saran R, et al. US Renal Data System 2018 Annual Data Report: Epidemiology of Kidney Disease in the United States. Am J Kidney Dis. 2019;73(3 Suppl 1):A7-A8.
- Miller RG, et al. Contemporary Estimate of Total Mortality and Cardiovascular Disease Risk in Young Adults With Type 1 Diabetes: The Pittsburgh Epidemiology of Diabetes Complications Study. Diabetes Care. 2016;39(12):2296-303.
- Lyon P, Strippoli V, Fang B, Cimmino L. B Vitamins and One-Carbon Metabolism: Implications in Human Health and Disease. Nutrients. 2020;12(9).
- Chazot C, Steiber AL, Kopple JD. Chapter 26 - Vitamin metabolism and requirements in chronic kidney disease and kidney failure. In: Kopple JD, Massry SG, Kalantar-Zadeh K, Fouque D, editors. Nutritional Management of Renal Disease (Fourth Edition): Academic Press; 2022. p. 413-65.
- Shakoor H, et al. Be well: A potential role for vitamin B in COVID-19. Maturitas. 2021;144:108-11.
- Green R, et al. Vitamin B(12) deficiency. Nat Rev Dis Primers. 2017;3:17040.
- Capelli I, et al. Folic Acid and Vitamin B12 Administration in CKD, Why Not Nutrients. 2019;11(2).
- Bamonti-Catena F, et al. Folate measurements in patients on regular hemodialysis treatment. Am J Kidney Dis. 1999;33(3):492-7.
- Andres E, Serraj K, Zhu J, Vermorken AJ. The pathophysiology of elevated vitamin B12 in clinical practice. QJM. 2013;106(6):505-15.
- Soohoo M, et al. Association of serum vitamin B12 and folate with mortality in incident hemodialysis patients. Nephrol Dial Transplant. 2017;32(6):1024-32.
- Zhang H, Liu N, Dang H. Association of the Controlling Nutritional Status (CONUT) score with all-cause and cause-specific mortality in patients with diabetic kidney disease: evidence from the NHANES 2009-2018. BMJ Open. 2024;14(4):e079992.
- Rahman HH, Niemann D, Munson-McGee SH. Association of albumin to creatinine ratio with urinary arsenic and metal exposure: evidence from NHANES 2015-2016. Int Urol Nephrol. 2022;54(6):1343-53.
- Phillips JA. Dietary Guidelines for Americans, 2020-2025. Workplace Health Saf. 2021;69(8):395.
- Ritchie ME, et al. limma powers differential expression analyses for RNA-sequencing and microarray studies. Nucleic Acids Res. 2015;43(7):e47.
- Yu G, Wang LG, Han Y, He QY. clusterProfiler: an R package for comparing biological themes among gene clusters. Omics : a journal of integrative biology. 2012;16(5):284-7.
- Szklarczyk D, et al. STRING v11: protein-protein association networks with increased coverage, supporting functional discovery in genome-wide experimental datasets. Nucleic Acids Res. 2019;47(D1):D607-D13.
- Shannon P, et al. Cytoscape: a software environment for integrated models of biomolecular interaction networks. Genome research. 2003;13(11):2498-504.
- Zhao L, et al. Non-linear association between composite dietary antioxidant index and depression. Front Public Health. 2022;10:988727.
- da Silva Ebone R, Doleski PH, Jantsch MH, da Silveira RP, Leal DBR. P2Y14 receptor activation and neutrophil signaling: linking inflammation to systemic pathophysiology. Purinergic Signal. 2026;22(1):5.
- Lazarowski ER, Harden TK. UDP-Sugars as Extracellular Signaling Molecules: Cellular and Physiologic Consequences of P2Y14 Receptor Activation. Mol Pharmacol. 2015;88(1):151-60.
- Survase S, Bajaj I, Singhal R. Biotechnological Production of Vitamins. Food Technology and Biotechnology. 2006;44.
- Mascolo E, Verni F. Vitamin B6 and Diabetes: Relationship and Molecular Mechanisms. Int J Mol Sci. 2020;21(10).
- Delrue C, Speeckaert R, Delanghe JR, Speeckaert MM. The Role of Vitamin D in Diabetic Nephropathy: A Translational Approach. Int J Mol Sci. 2022;23(2).
- Wang H, et al. In vitro and in vivo inhibition of mTOR by 1,25-dihydroxyvitamin D(3) to improve early diabetic nephropathy via the DDIT4/TSC2/mTOR pathway. Endocrine. 2016;54(2):348-59.
- Raizada N, Jyotsna VP, Sreenivas V, Tandon N. Serum Vitamin B12 Levels in Type 2 Diabetes Patients on Metformin Compared to those Never on Metformin: A Cross-sectional Study. Indian J Endocrinol Metab. 2017;21(3):424-8.
- Kibirige D, Mwebaze R. Vitamin B12 deficiency among patients with diabetes mellitus: is routine screening and supplementation justified J Diabetes Metab Disord. 2013;12(1):17.
- Wu HHL, Wang AY. Vitamin B12 and chronic kidney disease. Vitam Horm. 2022;119:325-53.
- Kumthekar AA, Gidwani HV, Kumthekar AB. Metformin associated B12 deficiency. J Assoc Physicians India. 2012;60:58-60.
- Nervo M, et al. Vitamin B12 in metformin-treated diabetic patients: a cross-sectional study in Brazil. Rev Assoc Med Bras (1992). 2011;57(1):46-9.
- Bell DS. Metformin-induced vitamin B12 deficiency presenting as a peripheral neuropathy. South Med J. 2010;103(3):265-7.
- Pflipsen MC, et al. The prevalence of vitamin B(12) deficiency in patients with type 2 diabetes: a cross-sectional study. J Am Board Fam Med. 2009;22(5):528-34.
- Liu KW, Dai LK, Jean W. Metformin-related vitamin B12 deficiency. Age Ageing. 2006;35(2):200-1.
- Halczuk K, Kazmierczak-Baranska J, Karwowski BT, Karmanska A, Cieslak M. Vitamin B12-Multifaceted In Vivo Functions and In Vitro Applications. Nutrients. 2023;15(12).
- Mohan A, Kumar R, Kumar V, Yadav M. Homocysteine, Vitamin B12 and Folate Level: Possible Risk Factors in the Progression of Chronic Heart and Kidney Disorders. Curr Cardiol Rev. 2023;19(4):e090223213539.
- Krishnaveni GV, Veena SR, Karat SC, Yajnik CS, Fall CH. Association between maternal folate concentrations during pregnancy and insulin resistance in Indian children. Diabetologia. 2014;57(1):110-21.
- Yajnik CS, et al. Vitamin B12 and folate concentrations during pregnancy and insulin resistance in the offspring: the Pune Maternal Nutrition Study. Diabetologia. 2008;51(1):29-38.