This article describes a murine model of acute retinal ischemia induced by unilateral internal carotid artery ligation. This model elicits retinal vascular and neuronal injury via apoptosis, inflammation, oxidative stress, and other cellular pathways, enabling mechanistic investigation of retinopathy associated with ophthalmic‑artery hemodynamic disturbances.
方法文章
Internal Carotid Artery Ligation: A Murine Model for Acute Retinal Ischemic Injury
* These authors contributed equally
本文内容
摘要
摘要
Accumulating evidence indicates that retinal ischemia constitutes a pivotal pathological trigger of visual impairment. The cerebral arterial circle (circle of Willis), formed by the vertebral and internal carotid arteries, provides cerebral blood perfusion. As a direct branch originating from the internal carotid artery (ICA), the ophthalmic artery supplies blood to the ocular globe. Based on the anatomical features of the ocular vasculature, a retinal ischemic injury model was successfully generated in C57BL/6 mice via selective left ICA ligation. Morphological and vascular analyses demonstrated marked lesions largely confined to the intermediate retinal vascular plexus. Histological and immunohistochemical staining revealed that the counts of bipolar cells and retinal ganglion cells in the superficial and intermediate retinal layers were markedly reduced. At the molecular level, this retinal ischemia model effectively activates a complex cascade of intracellular signaling pathways that govern apoptosis, inflammatory response, oxidative stress, angiogenesis, and neuronal injury regulation. The retinal ischemic injury model established by ICA ligation offers advantages, including high safety and ease of operation for targeted lesion modeling. In addition, this acute retinal ischemic injury model circumvents systemic circulatory disorders induced by the widely used common carotid artery (CCA) ligation method. This model facilitates a comprehensive exploration of the pathological mechanisms behind retinal ischemic disorders induced by hemodynamic abnormalities of the ophthalmic artery.
引言
Retinopathy is a group of diseases characterized by damage to the structure and function of the retina1,2. The retina, the core structure of the eye, is responsible for detecting light and transmitting visual signals. Pathological changes in the retina can cause severe visual impairment and, in severe cases, may result in permanent vision loss. Many factors contribute to retinopathy, such as diabetes3, hypertension4, atherosclerosis5, ischemia6, aging7and genetic factors8. The choroidal vascular network lies external to the retinal pigment epithelium and supplies oxygen and nutrients to the developing retina via diffusion9. However, the hyaloid vasculature, which lies internal to the retina, undergoes remarkable remodeling and gives rise to the superficial vascular plexus, while new vessels grow vertically into the retinal layer to form the intermediate and deep vascular plexuses. The superficial vascular plexus, intermediate vascular plexus, and deep vascular plexus are structurally interconnected and functionally coordinated, collectively forming the retinal vascular system. The retinal vascular system contributes to the oxygen and nutrient supply of the inner retina. The development of the retina, maintenance of the retinal structure, and proper retinal function are highly dependent on the supply of oxygenated blood. Vascular diseases characterized by arterial hemodynamic abnormalities are major causes of retinopathy.
The ophthalmic artery is responsible for supplying oxygen and nutrients to the choroidal vascular network and the retinal vascular system. It directly originates from the ICA, which is a major subdivision of the common carotid artery10. Some ischemic retinal injury models focusing on impairing the CCA have been established11,12. These models adequately recapitulate the clinical phenotype of retinal injury and have been widely used to investigate pathophysiological mechanisms. Complete ligation of the CCA not only disturbs systemic blood circulation but, more importantly, also affects multiple organs supplied by the external carotid artery. Safer and more targeted experimental animal models are urgently needed.
In this study, C57BL/6 mice were used to establish an acute ischemic retinal injury model by occluding the ICA. This retinal ischemia model displayed marked structural damage to intermediate retinal blood vessels, alongside severe lesions of bipolar cells and retinal ganglion cells. The underlying mechanisms encompassed apoptotic, inflammatory, hypoxic and oxidative stress, angiogenic, and neuronal injury regulatory signaling pathways.
方案
Animal ethics statement
All animal procedures described in this manuscript were approved by the Experimental Animal Ethics Committee of Chengdu University of Traditional Chinese Medicine. The Laboratory Animal Use License number is SYXK (Chuan) 2024-0049, and the protocol approval number is 2025115. Details of all materials and equipment used in this protocol are provided in the Table of Materials.
1. Animal preparation
- Use C57BL/6 mice aged 8–10 weeks and weighing 20–25 g.
- House the mice at 24 ± 1 °C under a 12 h light–dark cycle, with free access to food and water.
- Randomly assign the mice to the sham or ligation group (n = 6 per group).
2. Surgical instrument preparation
- Sterilize the surgical instruments by autoclaving.
- Spray the surgical instruments with 70% ethanol before the surgical procedure.
3. ICA permanent ligation procedures (Supplementary Figure 1)
- Anesthetize the mice by intraperitoneal injection of pentobarbital sodium (60 mg/kg). Keep the mice in a transparent cage until they enter an anesthetized state.
- Secure the mice in a supine position and depilate the neck region using animal depilatory cream.
- Assess the surgical plane of anesthesia based on loss of the righting reflex and absence of the hind-limb pedal-withdrawal reflex following gentle toe-pinch stimulation.
- Make a sagittal incision at the thyroid cartilage of the neck after disinfecting the skin of the cervical surgical field with povidone-iodine. Carefully isolate the left CCA from the respective vagus nerve and accompanying veins under a microscope.
NOTE: Most of the CCA is covered by the sternocleidomastoid muscle. The distal end of the CCA bifurcates into the external carotid artery (ECA) and ICA. The ECA is relatively superficial, running parallel anteriorly, with its anterior portion obscured by the sternohyoid muscle; the ICA descends almost vertically and lies deeper in position (Figure 1A,B). - Carefully isolate the ICA and permanently occlude it with a 6-0 silk suture. For the sham group, perform the same procedure but omit ligation of the left ICA.
- Suture the cervical wound and disinfect it with povidone-iodine.
- Apply 0.1% purified sodium hyaluronate eye drop solution for ocular protection.
- Administer meloxicam at 3 mg/kg subcutaneously in the interscapular region upon completion of surgery for postoperative analgesia. Prior to use, dilute meloxicam injectable solution (5 mg/mL) with sterile 0.9% saline to a working concentration of 1 mg/mL. Repeat the dose every 24 h for 2 consecutive days.
- Monitor the mice until the return of the righting reflex. Transfer the animals to a warm recovery cage once sternal recumbency is regained.
- At the experimental endpoint, euthanize the mice by gradual-fill carbon dioxide inhalation. Maintain carbon dioxide exposure for at least 2 min after cessation of spontaneous respiration. Confirm irreversible death using two independent criteria: loss of the tail-pinch withdrawal reflex and permanent cessation of spontaneous breathing. Perform thoracotomy as a secondary physical confirmatory step before tissue harvesting to ensure irreversible circulatory arrest and complete death.
- Rinse the intact eyeballs briefly in pre-cooled 1× phosphate-buffered saline (PBS). Perform the globe-penetration technique using a 30–32 G needle at the sclera, 1–1.5 mm posterior to the limbus, under a dissecting microscope.
- Fix the punctured eyeballs with formalin-acetic-saline (FAS) fixative at 4 °C for 10 h. Use at least a 20-fold volume of fixative relative to the tissue sample.
4. Animal model evaluation methods
- Open‑field testing
- Habituate the mice to the testing room for a minimum of 1 h before testing.
- Gently place each mouse in the center of an open-field arena (40 cm x 40 cm x 35 cm) and allow free exploration for 10 min. Record behavioral activity using an overhead camera for 10 min.
- Analyze the video files using tracking software. Partition the arena floor into central, side, and corner zones. Quantify the total travel distance and time spent in each zone.
- Laser speckle imaging system
- Anesthetize the mice and secure them in the supine or prone position to fully expose the eyeballs or common carotid arteries.
- Acquire local blood-flow alterations using a laser speckle imaging system.
- Analyze dynamic temporal changes in blood perfusion within the regions of interest (ROIs) using the corresponding analysis software.
- Hematoxylin and eosin (H&E) staining
- Harvest the left eyeballs on days 3 and 7 after ICA ligation. Perform the globe-penetration technique and fix the eyeballs with FAS fixative at 4 °C for 10 h.
- Embed the fixed eyeballs in paraffin and collect 5 µm-thick sections.
- Perform H&E staining according to the previously published method13.
- Quantify the relative retinal thickness, outer nuclear layer thickness, inner nuclear layer thickness, and ganglion cell number using image-analysis software.
- Isolectin B4 (IB4) staining
- Harvest the left eyeballs on days 3 and 7 after ICA ligation. Perform the globe-penetration technique and fix the eyeballs with 4% paraformaldehyde for 3 h at room temperature.
- Dissect the retinas under a microscope. Permeabilize the retinas using cold methanol for 30 min at 4 °C.
- Incubate the retinas with blocking solution containing 0.2% bovine serum albumin (BSA), 5% goat serum, and 0.5% Triton X-100 in PBS for 2–3 h.
- Incubate the retinas with isolectin B4 (IB4) overnight at 4 °C14.
- Capture images using confocal microscopy. Quantify the relative vessel area of the superficial, intermediate, and deep retinal vascular layers using image-analysis software.
- Immunohistochemistry (IHC) and immunofluorescence (IF) staining
- Immunohistochemistry staining
- Deparaffinize the retinal sections using xylene. Perform antigen retrieval using an antigen-unmasking solution.
- Incubate the sections with CD31 or NeuN primary antibody, followed by a biotinylated secondary antibody.
- Incubate the sections with ABC reagent and visualize the immunoreactive signals using DAB substrate solution15.
- Quantify the number of retinal vessels based on CD31-positive signals by manual counting.
- Immunofluorescence staining
- Deparaffinize the retinal sections and permeabilize them with 0.3% Triton X-100.
- Block the sections and incubate them with NeuN primary antibody, followed by an Alexa 488-conjugated secondary antibody.
- Stain the nuclei with 4′,6-diamidino-2-phenylindole (DAPI). Capture images using confocal microscopy.
- Quantify the number of ganglion cells based on NeuN- and DAPI-positive signals.
- Immunohistochemistry staining
- RT‑qPCR analysis
- Extract total RNA from the left retina on day 3 after injury using an RNA extraction reagent.
- Assess the quantity and quality of the RNA using a spectrophotometer.
- Use 800 ng of RNA as the template for reverse transcription to obtain cDNA. Use the primer sequences listed in Table 1.
- Perform duplicate RT-qPCR reactions for each sample using a real-time PCR system.
- Use HPRT as the internal control and analyze the relative gene transcription levels using the 2−ΔΔCt method.
5. Statistical analysis
- Perform statistical analyses using statistical analysis software. Assess the normality of the data distribution using the Shapiro–Wilk test.
- For normally distributed data, use an unpaired Student’s t-test for two-group comparisons. For non-normally distributed data, use the Mann–Whitney U test.
- Present the data as mean ± standard error of the mean (SEM). Define statistical significance as p < 0.05.
结果
Generation of an acute ischemic retinal injury model by ICA ligation
The CCA divides into two terminal branches: the ICA and the external carotid artery (ECA). An important branch of the ICA is the ophthalmic artery (OA). The central retinal artery, short posterior ciliary artery, and long posterior ciliary artery, which originate from the ophthalmic artery, are responsible for ocular blood supply (Figure 1A,B). Based on the anatomic characteristics of ocular blood vessels, this acute ischemic retinal injury model was generated by unilateral ICA ligation. Due to the special location of the sternocleidomastoid muscle and sternohyoid muscle, isolation and ICA ligation are somewhat challenging. When the mouse is secured in a supine position, the limbs and head are immobilized, and the neck is maintained in a straight position. Animals were anesthetized. A sagittal incision was made. The ICA was isolated and ligated. The cervical wound was sutured. Meloxicam was administered for postoperative analgesia. Purified sodium hyaluronate eye‑drop solution was applied for ocular protection (Figure 1C). ICA ligation did not cause lethality in animals. Animals maintained normal food and water intake after surgery. No ptosis was observed at 2, 8, and 28 h after surgery (Figure 2A). Laser speckle imaging revealed no abnormalities in the eyeball or adjacent structures (Supplementary Figure 2). Open‑field testing demonstrated that total travel distance was significantly reduced in both the ligated and sham groups relative to the normal group at 10 h post‑surgery, whereas no statistically significant difference was found between the ligated and sham groups. In addition, time spent in the center, side, and corner zones did not differ significantly across the three groups (Figure 2B–D).
Ligation of the ICA impairs the structure of the retina
H&E staining was performed to evaluate morphological changes in retinal structure after ligation of the ICA. Retinal tissue was harvested on days 3 and 7 after ICA ligation. Mild edema of the crystalline lens was observed on day 3 after ICA ligation. In severe cases, the crystalline lens and retina came into contact. Mild separation between the retina and choroid was also observed in some animals (Figure 3A). Quantitative analysis of the different retinal layers showed no significant differences in relative total retinal thickness, relative outer nuclear layer thickness, or relative inner nuclear layer thickness on day 3 after ICA ligation (Figure 3B–D). However, the ganglion cell number was significantly decreased, and retinal ganglion cell axons appeared loosely arranged. Some retinal vessels within the inner nuclear layer (INL) were occluded by blood cells (Figure 3E). Morphological changes in retinal structure were also evaluated on day 7 after ICA ligation. Crystalline lens edema was markedly reduced. Adhesion between the crystalline lens and retina was also significantly reduced. However, mild separation between the retina and choroid was still observed on day 7 after ICA ligation (Figure 4A). The thicknesses of the different retinal layers were analyzed, and no significant difference in relative total retinal thickness was observed (Figure 4B). However, both relative outer nuclear layer thickness and inner nuclear layer thickness were mildly decreased (Figure 4C,D). No statistically significant difference was observed in ganglion cell number, while the arrangement of retinal ganglion cell axons showed improvement (Figure 4E). The choroidal structure was evaluated. The choroid is highly vascular and primarily supplies the outer retina. Owing to abundant pigment cells within the choroid, only a dark‑colored layer can be visualized by H&E staining and IHC, whereas barely any signal can be detected via IF (Supplementary Figure 3A–C).
Ligation of the ICA impairs the retinal vascular network
The ophthalmic artery is responsible for supplying oxygen and nutrients to the choroidal vascular network and retinal vascular system. Retinal vascular network impairment after ICA ligation was first evaluated. The retinas were dissected under a microscope after fixation. Isolectin B4 (IB4) staining was performed to visualize the retinal vascular system. Vessels in the superficial retinal layer possess relatively large calibers, intact structures, and sparse branching, which makes them less susceptible to pathological ischemic stress. Very few twisted or deformed vessels in the superficial retina were observed on day 3 after ICA ligation. Deep retinal vessels are abundant, uniform in caliber, regularly arranged, and interconnected to form a vascular plexus. No markedly abnormal changes in deep retinal vessels were detected, except for very few deformed and disrupted structures observed on day 3 after ICA ligation. Intermediate retinal vessels exhibit sparse distribution, simple morphology, and few branches. However, some vessels displayed incomplete morphology, and the total vessel number was significantly reduced (Figure 5A). Quantitative analysis of vessel area showed no significant differences in the relative areas of the superficial and deep retinal vessels, whereas the area of intermediate retinal vessels was markedly decreased on day 3 after ICA ligation (Figure 5B–D). Immunohistochemical staining for the endothelial marker CD31 was also performed and showed that the number of retinal vessels was significantly decreased (Figure 5E,F). Retinal vascular network impairment was further evaluated on day 7 after ICA ligation. Both superficial and deep retinal vessels maintained intact structures, uniform distribution, and regular arrangement. The number of intermediate retinal vessels recovered, and vascular morphological distortion was markedly alleviated on day 7 after ICA ligation (Figure 6A). Quantitative statistical analysis revealed no significant difference in the relative area of superficial and deep retinal vessels (Figure 6B–D). The relative area of intermediate retinal vessels significantly increased compared with that on day 3 after ligation. However, it remained lower than that in the sham group.
Ligation of the ICA impairs retinal neurons
Retinal neurons mainly consist of photoreceptor cells, bipolar cells, and ganglion cells. Photoreceptor cells in the retina are primarily responsible for detecting light stimuli, while bipolar cells and ganglion cells transmit excitation to the optic nerve. To assess retinal neuronal injury induced by ICA ligation, immunohistochemical staining for NeuN, a mature neuronal marker, was performed16. High levels of NeuN expression were detected in retinal ganglion cells. A proportion of bipolar cells also exhibited NeuN immunoreactivity. Hardly any NeuN-positive signals were observed in photoreceptor cells. Expression levels of NeuN decreased dramatically in both bipolar cells and ganglion cells on day 3 after ICA ligation (Figure 7A). The numbers of mature bipolar cells and ganglion cells were significantly decreased (Figure 7B,C). Immunofluorescence assays verified that NeuN is expressed in bipolar cells and ganglion cells. The total number of NeuN-positive bipolar and ganglion cells was reduced (Figure 7D,E).
ICA ligation activates multiple intracellular signaling pathways
To clarify the potential molecular mechanisms responsible for retinal ischemic injury after ICA ligation, retinal tissue was isolated, total RNA was extracted, and RT‑qPCR was performed. Apoptosis signaling pathway: key molecules of the apoptotic signaling pathway were evaluated. The expression of pro-apoptotic genes, including Bax, cytochrome c (Cycs), c-Fos, caspase-3, and caspase-9, showed no significant changes, while the levels of anti-apoptotic proteins Bcl-2, Plectin (PLEC), and BRAP were dramatically reduced on day 3 after ICA ligation (Figure 8A). Inflammatory response signaling pathway: key molecules involved in inflammatory response signaling pathways were detected. The transcription levels of pro-inflammatory genes, including interleukin-1β (IL-1β), Toll-like receptor 3 (Tlr3), Irak3, and Tnc, were evaluated. The transcription level of Irak3 was dramatically increased, while IL-1β significantly decreased. The transcript levels of anti-inflammatory genes, including Rcan1 and Nfia, showed no obvious differences (Figure 8B). Hypoxia and oxidative stress signaling pathway: the transcript levels of genes related to hypoxia and oxidative stress, including HIF-1α, HO1, Nrf2, and Glut1, exhibited no significant differences (Figure 8C). Angiogenesis signaling pathway: the transcript levels of genes related to the angiogenesis signaling pathway, including VEGF α, ANGPT2, Tie2, AKT1, Pdlim5, Bmpr1b, and Rreb1, were evaluated. The transcript levels of pro-angiogenesis genes, such as ANGPT2, Tie2, AKT1, and Rreb1 were significantly increased (Figure 8D). Neuronal functional regulatory signaling pathways: transcript levels of neuronal homeostatic‑related genes, including Sema3e and Rbfox2, were markedly reduced. The transcript abundance of the Notch signaling ligand Jagged1 was also decreased (Figure 8E).
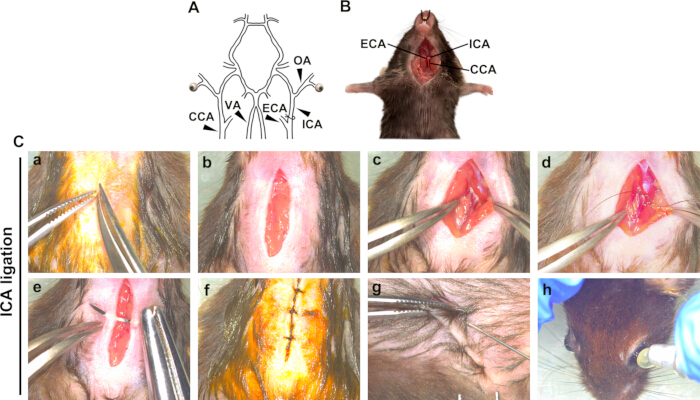
Figure 1: Establishment of a murine retinal ischemic injury model by ICA ligation. (A) Schematic representation of the carotid and ophthalmic arterial anatomy and the site of ICA ligation. (B) Representative image showing the exposed CCA, ECA, and ICA. (C) Representative images of the surgical procedure for ICA ligation and postoperative care. Abbreviations: CCA = common carotid artery; ECA = external carotid artery; ICA = internal carotid artery; OA = ophthalmic artery; VA = vertebral artery. Please click here to view a larger version of this figure.
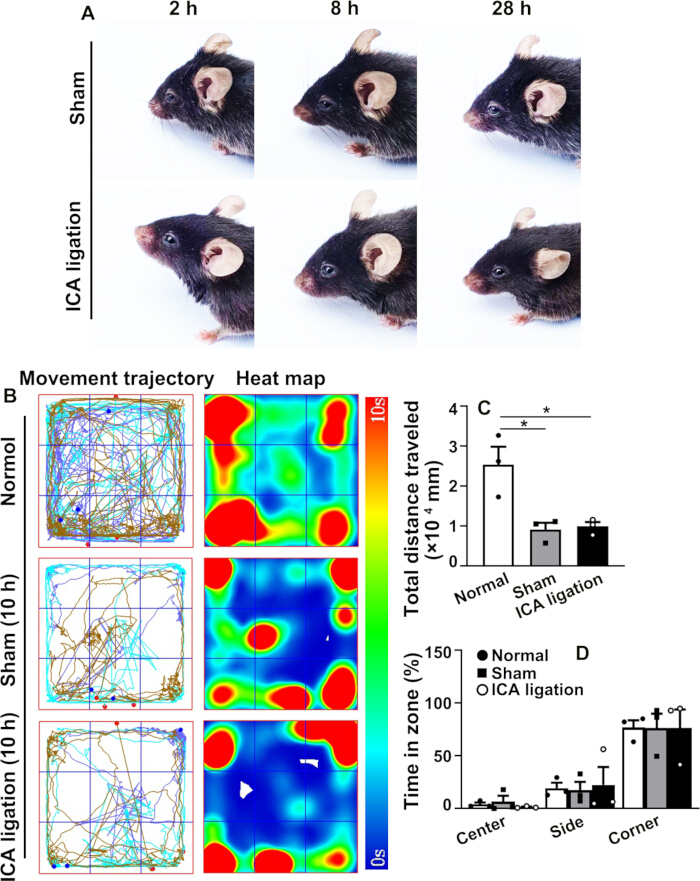
Figure 2: Behavioral observations following ICA ligation. (A) Representative images showing eyelid appearance at 2 h, 8 h, and 28 h after ICA ligation. (B) Representative movement trajectories and heat maps obtained during the open-field test at 10 h after surgery. (C) Quantification of the total distance traveled during the open-field test. (D) Quantification of the time spent in the center, side, and corner zones, expressed as a percentage of the total observation time (%). Abbreviation: ICA = internal carotid artery. Data are presented as mean ± SEM (n = 3). Statistical analysis was performed using an unpaired t-test. p < 0.05. Please click here to view a larger version of this figure.
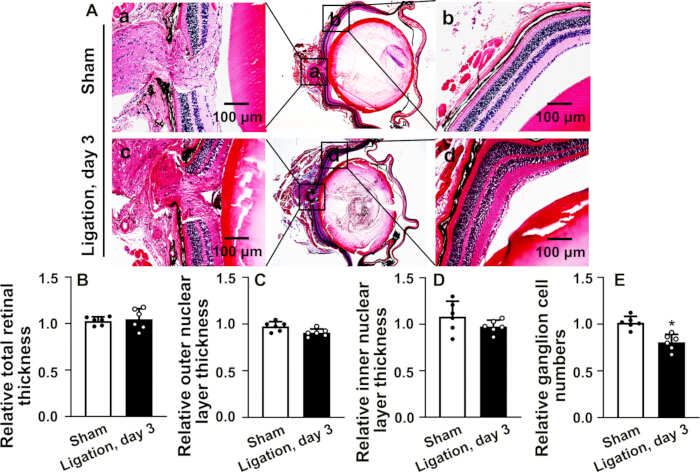
Figure 3: Morphological and histopathological evaluation of the retina on day 3 after ICA ligation. (A) Representative H&E-stained retinal sections showing morphological and histopathological changes on day 3 after ICA ligation, including mild crystalline lens edema, contact between the crystalline lens and retina in severe cases, and mild separation between the retina and choroid. Scale bars = 100 µm. Quantification of (B) total retinal thickness, (C) outer nuclear layer thickness, (D) inner nuclear layer thickness, and (E) ganglion cell number. Data are presented as mean ± SEM (n = 6). Statistical analysis was performed using an unpaired t-test. p < 0.05. Please click here to view a larger version of this figure.
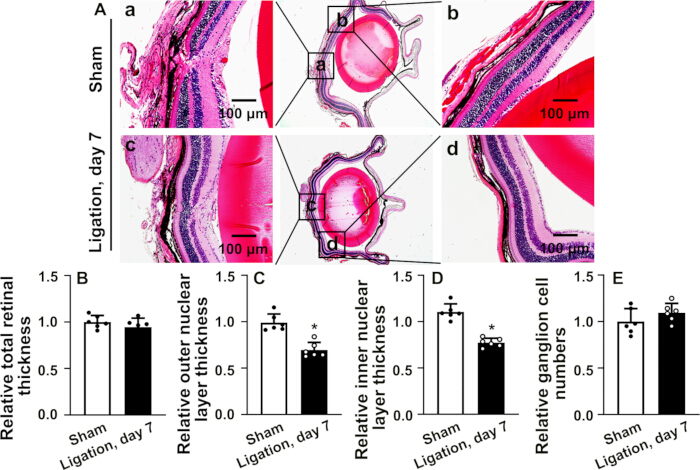
Figure 4: Morphological and histopathological evaluation of the retina on day 7 after ICA ligation. (A) Representative H&E-stained retinal sections showing morphological and histopathological changes on day 7 after ICA ligation, including reduced crystalline lens edema and adhesion between the crystalline lens and retina and persistent mild separation between the retina and choroid. Scale bars = 100 µm. Quantification of (B) total retinal thickness, (C) outer nuclear layer thickness, (D) inner nuclear layer thickness, and (E) ganglion cell number. Data are presented as mean ± SEM (n = 6). Statistical analysis was performed using an unpaired t-test. p < 0.05. Please click here to view a larger version of this figure.
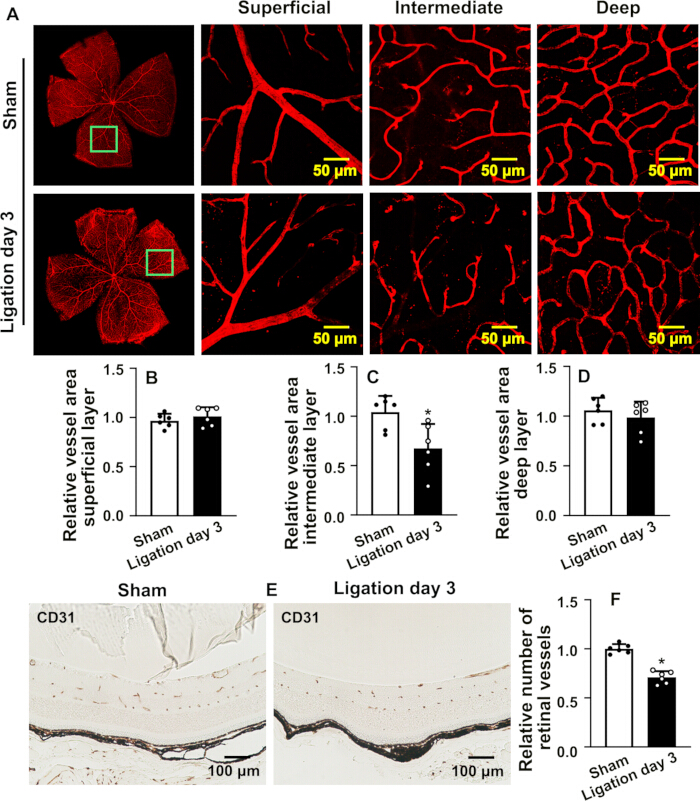
Figure 5: Assessment of the retinal vascular network on day 3 after ICA ligation. (A) Representative confocal images of the overall retinal vascular network and the superficial, intermediate, and deep vascular plexuses following isolectin B4 staining on day 3 after ICA ligation. Scale bars = 50 µm. Quantification of the relative vascular area of the (B) superficial, (C) intermediate, and (D) deep vascular plexuses. (E) Representative images of CD31 immunohistochemical staining of retinal vessels. Scale bars = 100 µm. (F) Quantification of the relative number of retinal vessels. Data are presented as mean ± SEM (n = 6). Statistical analysis was performed using an unpaired t-test. p < 0.05. Please click here to view a larger version of this figure.
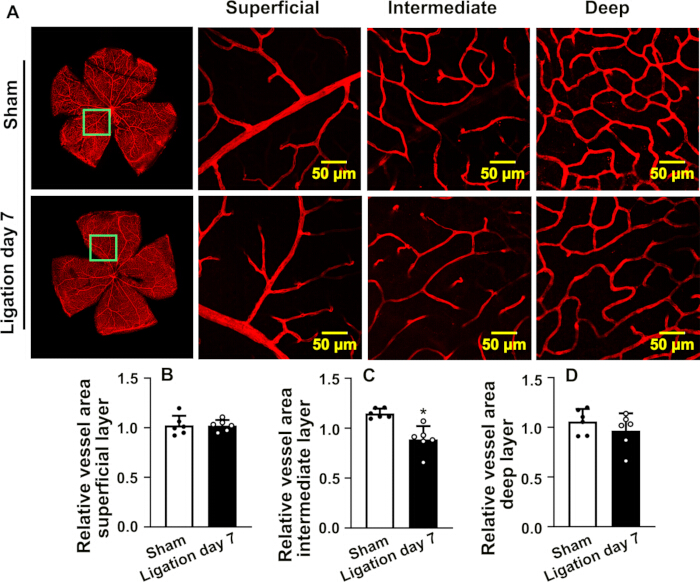
Figure 6: Assessment of the retinal vascular network on day 7 after ICA ligation. (A) Representative confocal images of the overall retinal vascular network and the superficial, intermediate, and deep vascular plexuses following isolectin B4 staining on day 7 after ICA ligation. Scale bars = 50 µm. Quantification of the relative vascular area of the (B) superficial, (C) intermediate, and (D) deep vascular plexuses. Data are presented as mean ± SEM (n = 6). Statistical analysis was performed using an unpaired t-test. p < 0.05. Please click here to view a larger version of this figure.
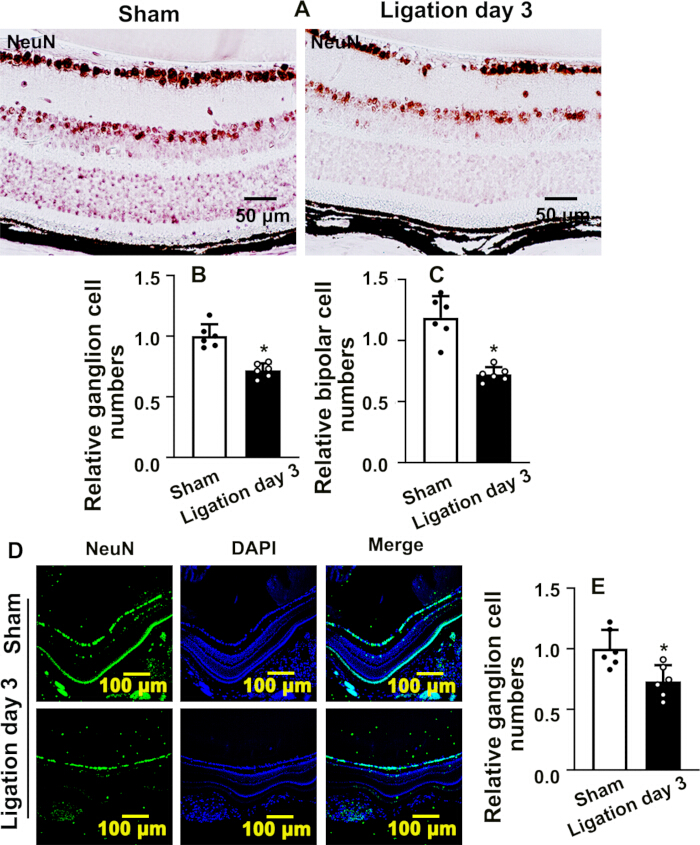
Figure 7: Assessment of retinal neuronal damage on day 3 after ICA ligation. (A) Representative images of NeuN immunohistochemical staining in retinal ganglion and bipolar cells on day 3 after ICA ligation. Scale bars = 50 µm. Quantification of the relative (B) ganglion cell number and (C) bipolar cell number. (D) Representative images of NeuN immunofluorescence staining in retinal ganglion and bipolar cells on day 3 after ICA ligation. Scale bars = 100 µm. (E) Quantification of the relative ganglion cell number. Data are presented as mean ± SEM (n = 6). Statistical analysis was performed using an unpaired t-test. p < 0.05. Please click here to view a larger version of this figure.
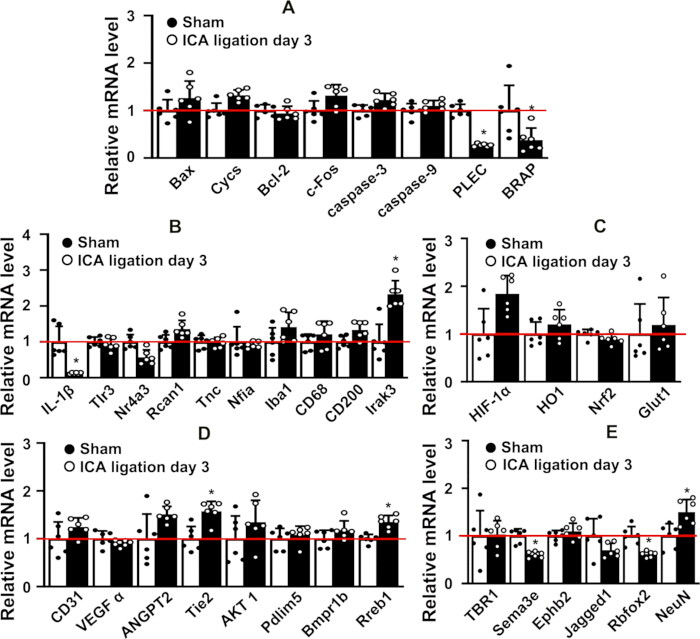
Figure 8: Expression of genes associated with retinal injury on day 3 after ICA ligation. RT-qPCR analysis of genes associated with (A) apoptosis, (B) inflammatory responses, (C) hypoxia and oxidative stress, (D) angiogenesis, and (E) neuronal injury regulation on day 3 after ICA ligation. The red horizontal line indicates the normalized reference expression level of 1. Data are presented as mean ± SEM (n = 6). Statistical analysis was performed using an unpaired t-test. p < 0.05. Please click here to view a larger version of this figure.
Supplementary Figure 1: Permanent ICA ligation procedure. Representative images showing anesthesia, sagittal cervical incision, isolation and ICA ligation, wound closure, administration of meloxicam for postoperative analgesia, and application of purified sodium hyaluronate eye drops for ocular protection. Abbreviation: ICA = internal carotid artery. Please click here to download this file.
Supplementary Figure 2: Laser speckle imaging system assessment following ICA ligation. Representative laser speckle imaging system images of the eyeball and adjacent structures following ICA ligation. Abbreviations: ICA = internal carotid artery; LSI = laser speckle imaging. Please click here to download this file.
Supplementary Figure 3: Structural characteristics of the choroid. (A) Representative H&E-stained section showing the dark-colored choroidal layer containing abundant pigment cells. (B) Representative CD31 immunohistochemical staining showing blood vessel distribution within the eyeball. (C) Representative CD31 immunofluorescence staining showing blood vessel distribution within the eyeball. Abbreviations: H&E = hematoxylin and eosin; IHC = immunohistochemistry; IF = immunofluorescence. Please click here to download this file.
Supplementary Figure 4: Structural characteristics of the retina. (A) Representative image of the isolated retina, showing its milky-white appearance and relatively thick and mechanically fragile structure. (B–D) Representative histological images comparing the structural characteristics of the retina with those of the common carotid artery and abdominal aorta. Abbreviations: AA = abdominal aorta; CCA = common carotid artery. Please click here to download this file.
| Gene Name | Oligo Name | Oligo Sequence (5 to 3) | Species | Base pair | |
| Bax | M-Bax F | TGCAGAGGATGATTGCTGAC | Mouse | 20 | |
| Bax | M-Bax R | GATCAGCTCGGGCACTTTAG | Mouse | 20 | |
| Cycs | M-Cycs S | TGCTATGTTGCCCTAGACTTCG | Mouse | 22 | |
| Cycs | M-Cycs A | GTTGGCATAGAGGTCTTTACGG | Mouse | 22 | |
| BCl2 | M-BCl2 F | GGTGGTGGAGGAACTCTTCA | Mouse | 20 | |
| BCl2 | M-BCl2 R | ATGCCGGTTCAGGTACTCAG | Mouse | 20 | |
| c-fos | M-c-fos F | CGGGTTTCAACGCCGACTA | Mouse | 19 | |
| c-fos | M-c-fos R | TTGGCACTAGAGACGGACAGA | Mouse | 21 | |
| Caspase3 | M-Caspase 3 F | GAGCTTGGAACGGTACGCTA | Mouse | 20 | |
| Caspase3 | M-Caspase 3 R | GCGAGATGACATTCCAGTGC | Mouse | 20 | |
| Caspase9 | M-Caspase 9 F | GCTGTGTCAAGTTTGCCTACCC | Mouse | 22 | |
| Caspase9 | M-Caspase 9 R | CCAGAATGCCATCCAAGGTCTC | Mouse | 22 | |
| Plec | M-Plec F | GCTGATGTGGCTGAATGAGAAAG | Mouse | 23 | |
| Plec | M-Plec R | ATCAGGGCCGAGTAACTTTCTTT | Mouse | 23 | |
| Brap | M-Brap F | ACGGCAGAGGAGATTAACAACAT | Mouse | 23 | |
| Brap | M-Brap R | TTCAGCTGGGTACACTTCCTTTC | Mouse | 23 | |
| IL-1β | M-IL-1β F | GACAACTGCACTACAGGCTCC | Mouse | 21 | |
| IL-1β | M-IL-1β R | AGGCCACAGGTATTTTGTCG | Mouse | 20 | |
| Tlr3 | M-Tlr3 F | CGAACCTGACAGAACTCGATCTA | Mouse | 23 | |
| Tlr3 | M-Tlr3 R | CCCGTTCCCAACTTTGTAGATGA | Mouse | 23 | |
| Irak3 | M-Irak3 F | AAGCCATCCAATACTTGCACAAC | Mouse | 23 | |
| Irak3 | M-Irak3 R | TGGTAGAACTCTGCTGCTCTAGA | Mouse | 23 | |
| Nr4a3 | M-Nr4a3 F | TGGCTCGACTCCATTAAAGACTT | Mouse | 23 | |
| Nr4a3 | M-Nr4a3 R | CCATGTCGCTCTGTGATCATACT | Mouse | 23 | |
| Rcan1 | M-Rcan1 F | AATCCCGACAAACAGTTCCTCAT | Mouse | 23 | |
| Rcan1 | M-Rcan1 R | TCTCTTCCTCTTCCTCCTCATTCT | Mouse | 24 | |
| Tnc | M-Tnc F | GTCTAAGGCCCGGAACTGAATAT | Mouse | 23 | |
| Tnc | M-Tnc R | AAGTCCTTGGGTGCATCAATTTA | Mouse | 23 | |
| Nfia | M-Nfia F | ACTTGGTGGATGGATGAGTTTCA | Mouse | 23 | |
| Nfia | M-Nfia R | GGTACTCGGGTCGGATATCTTTC | Mouse | 23 | |
| Hif-1α | M-Hif-1α F | GCGGCGAGAACGAGAAGAAA | Mouse | 20 | |
| Hif-1α | M-Hif-1α R | GGGGAAGTGGCAACTGATGA | Mouse | 20 | |
| HO1 | M-HO1 F | CAAGCCGAGAATGCTGAGTTCATG | Mouse | 24 | |
| HO1 | M-HO1 R | GCAAGGGATGATTTCCTGCCAG | Mouse | 22 | |
| Nrf2 | M-Nrf2 F | AAAATCATTAACCTCCCTGTTGAT | Mouse | 24 | |
| Nrf2 | M-Nrf2 R | CGGCGACTTTATTCTTACCTCTC | Mouse | 23 | |
| Glut1 | M-Glut1 F | GCAGTTCGGCTATAACACTGG | Mouse | 21 | |
| Glut1 | M-Glut1 R | GCGGTGGTTCCATGTTTGATTG | Mouse | 22 | |
| CD31 | M-CD31 F | TTCAGCGAGATCCTGAGGGTC | Mouse | 21 | |
| CD31 | M-CD31 R | CGCTTGGGTGTCATTCACGAC | Mouse | 21 | |
| VEGFα | M-VEGFα F | CTGTAACGATGAAGCCCTGGAG | Mouse | 22 | |
| VEGFα | M-VEGFα R | TGGTGAGGTTTGATCCGCAT | Mouse | 20 | |
| ANGPT2 | M-ANGPT2 F | CTACTCGCTCAAGGCCACAA | Mouse | 20 | |
| ANGPT2 | M-ANGPT2 R | GTGCAGGCTTAAGTGATGCG | Mouse | 20 | |
| Tie2 | M-Tie2 F | TCGGAGGGGGAAAGATGCTA | Mouse | 20 | |
| Tie2 | M-Tie2 R | ACTGCACAGCTGGTTCTTCT | Mouse | 20 | |
| AKT1 | M-AKT1 F | AGATTGTGTCGCCCGGAC | Mouse | 18 | |
| AKT1 | M-AKT1 R | AGCCCGAAGTCCGTTATCTT | Mouse | 20 | |
| Pdlim5 | M-Pdlim5 F | CAATGCACGTTCTTCAGGTACAG | Mouse | 23 | |
| Pdlim5 | M-Pdlim5 R | GTGCTCCCTTCTCCTCTACAAAG | Mouse | 23 | |
| Bmpr1b | M-Bmpr1b F | TGGGTACTGCTTCACGATGATAG | Mouse | 23 | |
| Bmpr1b | M-Bmpr1b R | CATTCCTTTCTGTGCAGCATTCA | Mouse | 23 | |
| Rreb1 | M-Rreb1 F | AGGCAAAGTTGCTGAGTTGC | Mouse | 20 | |
| Rreb1 | M-Rreb1 R | ACAACCTGGGTTTCTCGTGG | Mouse | 20 | |
| TBR1 | M-TBR1 F | CAAGGGAGCATCAAACAACA | Mouse | 20 | |
| TBR1 | M-TBR1 R | GTCCTCTGTGCCATCCTCAT | Mouse | 20 | |
| Sema3e | M-Sema3e F | GACTGAAGAGAGGCTGGCTTATG | Mouse | 23 | |
| Sema3e | M-Sema3e R | GTCATCCGTCTTCACCTCTTCTT | Mouse | 23 | |
| EphB2 | M-EphB2 F | CTACCCCTCATCGTTGGCTC | Mouse | 20 | |
| EphB2 | M-EphB2 R | CTCAAACCCCCGTCTGTTACAT | Mouse | 22 | |
| Jagged1 | M-Jagged1 F | CCTCTGCTGAGCTCTGTCTT | Mouse | 20 | |
| Jagged1 | M-Jagged1 R | ATTGTTGGTGGTGTTGTCCT | Mouse | 20 | |
| Rbfox2 | M-Rbfox2 F | CAATTCACCCAGCAACCAGAATG | Mouse | 23 | |
| Rbfox2 | M-Rbfox2 R | CTCGGAAGCGGAAGGGAATATTA | Mouse | 23 | |
| NeuN | M-NeuN F | CCACCACTCTCTTGTCCGTT | Mouse | 20 | |
| NeuN | M-NeuN R | ATCAGCAGCGGCATAGACTC | Mouse | 20 | |
| CD68 | M-CD68-F | TGGCGGTGGAATACAATGTG | Mouse | 20 | |
| CD68 | M-CD68-R | TGAATGTCCACTGTGCTGCC | Mouse | 20 | |
| Iba1 | M-Iba1-F | GGATTTGCAGGGAGGAAAAG | Mouse | 20 | |
| Iba1 | M-Iba1-R | TGGGATCATCGAGGAATTG | Mouse | 19 | |
Table 1: Primer sequences used for RT-qPCR analysis. Forward and reverse primer sequences used to evaluate the relative expression of genes associated with apoptosis, inflammatory responses, hypoxia and oxidative stress, angiogenesis, and neuronal injury following ICA ligation. Abbreviation: RT-qPCR = reverse transcription quantitative polymerase chain reaction.
讨论
In this study, a mouse model of retinal ischemic injury was successfully established by unilateral ICA ligation in C57BL/6 mice. The core advantage of this approach lies in its remarkably low postoperative mortality, which greatly reduces surgical risks and improves experimental reproducibility. Multiple independent replicates confirmed that permanent unilateral ICA ligation does not result in systemic mortality. Conventional models relying on complete CCA ligation frequently disrupt systemic hemodynamics, resulting in relatively high mortality rates and confounding off-target ischemic injury to other organs. By directly targeting the ICA — the immediate upstream source of the ophthalmic artery — this approach induced precise, localized retinal ischemia without causing severe systemic circulatory disturbance. This model faithfully recapitulates clinical ischemic retinopathies driven by ophthalmic hemodynamic disorders.
The staged pathological progression exhibited in this model demonstrates robust reproducibility and sound scientific validity. At the acute injury phase (post-ligation day 3), morphological and vascular assessments revealed prominent lesions predominantly restricted to the intermediate retinal vascular plexus, accompanied by reduced endothelial density and distorted cellular morphology. In contrast, the superficial retinal vascular plexus maintained nearly intact structural integrity. Such distinct vulnerability arises from inherent structural heterogeneity and disparate metabolic demands across the retinal vasculature. Concurrently, histological and immunohistochemical staining demonstrated transient architectural disarray, loosened extracellular matrix, and marked ganglion cell loss within the inner retina. Notably, these structural and vascular defects exhibited robust spontaneous recovery at post-ligation day 7, highlighting potent endogenous compensatory angiogenesis and intrinsic tissue repair mechanisms.
At the molecular level, this retinal ischemic model effectively triggers a complex cascade of intracellular signaling pathways, such as the apoptosis signaling pathway, inflammatory response signaling pathway, hypoxia and oxidative stress signaling pathway, angiogenesis signaling pathway, and neuronal injury modulatory signaling pathways. The retina exhibits marked structural differences from other tissues. The isolated retina appears milky‑white, relatively thick, and mechanically fragile, prone to tearing (Supplementary Figure 4A). Compared with the CCA and abdominal aorta, retinal tissues consist of abundant cells with relatively small individual cell volumes (Supplementary Figure 4B–D). The transcript levels of most genes detected here were extremely low, and others were undetectable. Given the unique structural composition of retinal tissue, it would be inappropriate to judge the expression changes of Sema3e, Rbfox2, Jagged1, ANGPT2, and Tie2 based solely on RT‑qPCR data. Despite its prominent advantages, this model has intrinsic limitations. The retinal ischemia induced by this surgical approach is transient by nature and primarily recapitulates acute retinal lesions, making it suboptimal for modeling the chronic, sustained ischemia seen in advanced clinical retinopathies. Future investigations may circumvent these limitations by integrating this highly selective ICA ligation protocol with systemic disease models (e.g., diabetic mice) to generate a stable chronic ischemic retinal injury model.
披露
The authors declare no conflicts of interest.
致谢
This study was supported by grants in aid for scientific research (600242241005, 42022004) from Chengdu University of Traditional Chinese Medicine.
材料
| 姓名 | 公司 | 目录编号 | 评论 |
|---|---|---|---|
| Adobe Photoshop 2021 | Adobe Inc. | V 22.3.0 | Used for image layout and standardized processing. |
| Bio-Rad CFX Maestro 1.1 | Bio-Rad Laboratories | V 4.1.2433.1219 | This is a comprehensive software for gene expression analysis. |
| CFX96 Real-Time PCR System (C1000 Touch Thermal Cycler) | Bio-Rad | CFX96 | Real-time quantitative PCR instrument for mRNA expression analysis |
| cellSens FV (FLUOVIEW) | Evident Corporation, Japan | V 3.1.1.67 | Confocal laser scanning microscope control software. |
| DS-11+ Spectrophotometer | DeNovix | DS-11+ | Microvolume spectrophotometer, used for nucleic acid concentration and purity measurement |
| Dumont #5 Fine Forceps | Fine Science Tools (FST) | 11251-20 | Size 5 ultra-fine micro forceps,used for ICA isolation. |
| Dumont #7 Micro Forceps | Roboz Surgical Instrument Co. | RS-5027 | Ideal for working around vessels and delicate nerves. |
| Dumont #N7 Auto-closing Forceps | Fine Science Tools (FST) | 11480-11 | Used to secure local tissues or clamp sutures during surgery. |
| Digital microscope camera | M-shot | MSX2-H | Acquire images using an upright biological microscope. |
| Fiji-Image J | National Institutes of Health (NIN) | ImageJ version 1.54f; Java 1.8.0_322 | For data analysis. |
| GraphPad Prism | GraphPad Software, LLC (USA) | Prism 10, Version 10.1.2 (324) | Software for biostatistics and scientific graphing. |
| Halsey Needle Holder | Fine Science Tools (FST) | 12500-12 | Used at the end of the surgery to hold the suturing needle for closing the cervical wound. |
| Iris Scissors | Roboz Surgical Instrument Co. | RS-5840 | Used to make a sagittal incision at the thyroid cartilage of the mouse's neck, cutting through the skin and superficial muscles. |
| LSM 510 Laser-Scanning Confocal Microscope | Carl Zeiss | LSM 510 | Laser-scanning confocal microscope for immunofluorescence image acquisition and Z-stack scanning |
| Laser Speckle Imaging System | RWD Life Science Co., Ltd. | RFLSI ZW | To monitor and record blood perfusion. |
| Micro Vannas Spring Scissors | Fine Science Tools (FST) | 15000-00 | Used for extremely precise dissection of the left common carotid artery (CCA) and the deeper internal carotid artery (ICA) under the microscope |
| MShot Image Analysis System | M-shot | V 1.1.4 | Image acquisition software. |
| RFLSI Acquisition | RWD Life Science Co., Ltd. | V 2.1.4.34859 | Acquisition software of Laser Speckle Imaging System. |
| RFLSI Analysis | RWD Life Science Co., Ltd. | V 2.1.3.34859 | Analysis software of Laser Speckle Imaging System. |
| Stemi 508 Stereo Microscope | Carl Zeiss | 435064-9010-000 | Provides a magnified field of view. |
| Straight tissue forceps | Fine Science Tools (FST) | 11023-10 | Used for grasping and retracting tissues, such as the sternocleidomastoid muscle covering the CCA, during dissection. |
| Upright biological microscope | OLYMPUS | Olympus BX51 | Image acquisition for H&E and IHC staining. |
| VisuTrack | Shanghai Xinruan Information Technology Co., Ltd. | Version XR-VT | Animal behaviors were acquired and analyzed using the VisuTrack software. |
| 96-well PCR Plate, Semi-skirted, 0.2 mL, white | Axygen (Corning) | PCR-96-LP-AB-W | 0.2 mL semi-skirted white-well 96-well qPCR plate, DNase/RNase-free, non-pyrogenic |
| Braided Silk(6/0) | Fine Science Tools (FST) | 18020-60 | Used for ICA ligation. |
| Dafilon 5/0 Suture (with DS16 Needle) | B. Braun | C0936154 | Used to suture the mouse's cervical surgical wound after the ligation is complete. |
| Durapore Surgical Tape 1.25cm | 3M | 7100057169 | Used to firmly bind and immobilize the limbs and head of the mouse when it is placed in a supine position. |
| Ultra-clear optical qPCR sealing film | Axygen (Corning) | UC-500 | Pressure-sensitive ultra-clear sealing film for real-time PCR, low autofluorescence |
| 0.1% Sodium Hyaluronate Eye Drops | Alcon | Applied to the mouse's eyes during anesthesia to protect the globe and prevent corneal desiccation and damage. | |
| 4% Paraformaldehyde (PFA) | Sigma-Aldrich (USA) | Not specified | Analytical Reagent(AR) grade,500g,CAS 30525-89-4 |
| 70% Ethanol Solution | Sigma-Aldrich (USA) | E7023 | Used to spray and disinfect the autoclaved surgical instruments prior to the surgical procedure. |
| Animal Depilatory Cream (Veet) | Braintree Scientific, Inc. | NAIR | Used in the preoperative preparation stage to remove hair from the neck region of the mouse to facilitate disinfection and the surgical incision. |
| Avidin/Biotin Blocking Kit | Vector Laboratories (USA) | SP-2001 | Kit for blocking endogenous avidin-biotin binding sites in tissue sections, for ABC-based IHC |
| Bovine Serum Albumin (BSA), Albumin Fraction V | BioFroxx (neoFroxx GmbH, Germany) | 4240GR500 | 500 g, for molecular biology, CAS 9048-46-8, MW 68000 |
| Butorphanol tartrate | Zoetis | 10000305 | Analgesic agent, administered via subcutaneous injection at a dose of 0.4 mg/kg as the mouse wakes up at the end of the surgery. |
| CD31 (PECAM-1) (D8V9E) XP® Rabbit mAb | Cell Signaling Technology | 77699 | Rabbit monoclonal antibody, reacts with mouse CD31; IHC-paraffin 1:100, for endothelial cell detection |
| Citric acid monohydrate | Sigma-Aldrich (USA) | C1909 | ACS reagent grade, for citrate antigen-retrieval buffer |
| DAB Substrate Kit with Nickel | Vector Laboratories (USA) | SK-4100 | Nickel-enhanced DAB chromogenic substrate kit for peroxidase-based IHC staining, produces blue-black reaction product |
| DAPI Solution (1 mg/mL) | Invitrogen (Thermo Fisher Scientific) | 62248 | Fluorescent nuclear counterstain, ready-to-use liquid format, applied for cell nuclei labeling in immunofluorescence. |
| Eosin staining solution | BASO Diagnostics Inc. | BA4024 | Aqueous-type,1000ml |
| Goat anti-Rabbit IgG (H+L) Cross-Adsorbed Secondary Antibody, Alexa Fluor™ 488 | Invitrogen (Thermo Fisher Scientific) (USA) | A-11008 | Alexa Fluor 488 (green fluorescence), cross-adsorbed, for immunofluorescence; reacts with rabbit primary antibody |
| Goat anti-Rabbit IgG (H+L) Secondary Antibody, HRP | Invitrogen (Thermo Fisher Scientific) (USA) | 31460 | HRP-conjugated, for IHC (paraffin/frozen) and WB, goat host, reacts with rabbit primary antibody |
| Normal Goat Serum | Jackson ImmunoResearch | 005-000-121 | High-quality serum used at 5% working concentration for blocking non-specific binding sites in tissue sections prior to antibody incubation. |
| Hematoxylin staining solution | BASO Diagnostics Inc. | BA4041 | Harris formula,1000ml |
| HiScript III All-in-one RT SuperMix Perfect for qPCR | Vazyme | R333-01 | One-step gDNA removal and cDNA synthesis kit for RT-qPCR |
| Isolectin GS-IB4, Alexa Fluor™ 594 Conjugate | Invitrogen (Thermo Fisher Scientific) (USA) | I21413 | 500μg, lectin probe for mouse vascular/retinal endothelial staining, also labels activated microglia, Alexa Fluor 594 |
| Ketamine Hydrochloride | Sigma-Aldrich | K2753 | Anesthetic agent, administered via intraperitoneal injection at a dose of 80 mg/kg to anesthetize the mice before surgery, as well as prior to sacrifice for retinal isolation. |
| Methanol | Sigma-Aldrich (USA) | 34860 | ≥99.9 %, suitable for immunofluorescence, CAS 67-56-1, used as cold (−20 °C) organic fixative for intracellular antigen staining |
| NeuN (D4G4O) XP® Rabbit mAb | Cell Signaling Technology | 24307 | Rabbit monoclonal antibody; reacts with human/mouse/rat NeuN; WB 1:1000, IHC-paraffin 1:400, IF-frozen 1:150, neuronal nuclear marker |
| Povidone-Iodine Solution | 3M | 19-065534 | Used for local disinfection of the mouse's neck before making the skin incision and after suturing the wound. |
| PBS, pH 7.4 (1X) | Gibco (Thermo Fisher Scientific) | 10010023 | Ready-to-use sterile 1X phosphate-buffered saline (pH 7.4), used as the base buffer for washing tissues and preparing blocking solutions. |
| Paraplast Regular Embedding Medium | Leica Biosystems | 39601006 | High-purity refined paraffin wax (melting point 56°C), specifically used for tissue dehydration and histology sectioning. |
| Triton X-100 | Sigma-Aldrich (USA) | X100 | ≥99 %, MW 625, CAS 9036-19-5, non-ionic detergent for cell permeabilization |
| TRIzol® Reagent | Invitrogen (Thermo Fisher Scientific) (USA) | 15596026CN | 100ml, for total RNA isolation, research-use only |
| VECTASTAIN Elite ABC-HRP Kit | Vector Laboratories (USA) | PK-6100 | ABC amplification kit for peroxidase-based IHC-DAB detection; for biotin-conjugated secondary antibody |
| Xylazine | Sigma-Aldrich | X1126 | Muscle relaxant and sedative, administered via intraperitoneal injection at a dose of 5 mg/kg alongside ketamine to provide synergistic anesthesia. |
参考文献
- Hoon M, Okawa H, Della Santina L, Wong RO. Functional architecture of the retina: development and disease. Prog Retin Eye Res. 2014;42:44-84.
- Cideciyan AV, et al. Measures of function and structure to determine phenotypic features, natural history, and treatment outcomes in inherited retinal diseases. Annu Rev Vis Sci. 2021;7:747-772.
- Roy S, Kern TS, Song B, Stuebe C. Mechanistic insights into pathological changes in the diabetic retina: implications for targeting diabetic retinopathy. Am J Pathol. 2017;187(1):9-19.
- Chen X, et al. Vitamin K1 alleviates retinal inflammation following acute ocular hypertension by modulating microglial ferroptosis. Invest Ophthalmol Vis Sci. 2025;66(4):46.
- Klein R, et al. The association of atherosclerosis, vascular risk factors, and retinopathy in adults with diabetes: the Atherosclerosis Risk in Communities Study. Ophthalmology. 2002;109(7):1225-34.
- Chen DY, et al. Endothelium-derived semaphorin 3G attenuates ischemic retinopathy by coordinating β-catenin-dependent vascular remodeling. J Clin Invest. 2021;131(4):e135296.
- Yu J, et al. Associations of multiomics biological aging with diabetic retinopathy and life expectancy. Invest Ophthalmol Vis Sci. 2026;67(6):36.
- Georgiou M, et al. Phenotyping and genotyping inherited retinal diseases: molecular genetics, clinical and imaging features, and therapeutics of macular dystrophies, cone and cone-rod dystrophies, rod-cone dystrophies, Leber congenital amaurosis, and cone dysfunction syndromes. Prog Retin Eye Res. 2024;100:101244.
- Miloudi S, et al. Nestin contributes to laser choroidal and retinal neovascularization. Mol Vis. 2022;28:280-299.
- Brodie SE, et al. Persistence of retinal function after selective ophthalmic artery chemotherapy infusion for retinoblastoma. Doc Ophthalmol. 2009;119(1):13-22.
- Roth GA, et al. Global burden of cardiovascular diseases and risk factors, 1990-2019: update from the GBD 2019 Study. J Am Coll Cardiol. 2020;76(25):2982-3021.
- Lee D, et al. Retinal dysfunction induced in a mouse model of unilateral common carotid artery occlusion. PeerJ. 2021;9:e11665.
- Wang Y, et al. Deletion of yes-associated protein (YAP) specifically in cardiac and vascular smooth muscle cells reveals a crucial role for YAP in mouse cardiovascular development. Circ Res. 2014;114(6):957-65.
- Jin Z, et al. Andrographolide suppresses hypoxia-induced embryonic hyaloid vascular system development through HIF-1α/VEGFR2 signaling pathway. Front Cardiovasc Med. 2023;10:1090938.
- Wu X, et al. Adenosine triggers an ADK-dependent intracellular signaling pathway interacts PFKFB3-mediated glycolytic metabolism to promote newly formed myofibers development. Int J Mol Sci. 2025;26(24):12184.
- Shi L, et al. Andrographolide inhibits murine embryonic neuronal development through PFKFB3-mediated glycolytic pathway. Eur J Pharmacol. 2023;940:175474.
重印与许可
本文已发表
视频即将推出