This prospective cohort study demonstrates that combined hypoperfusion intensity ratio and Tan collateral score effectively stratify anterior circulation LVO patients in the 6–24 h window, with dual favorable markers predicting superior endovascular outcomes and reduced hemorrhage risk.
研究文章
Efficacy and Safety of Endovascular Treatment for HIR- and Collateral-Screened Ultra-Long Window Anterior Circulation LVO: A Prospective Cohort Study
本文内容
摘要
摘要
This study investigated the clinical value of combined hypoperfusion intensity ratio (HIR) and collateral evaluation for patient selection and prognostic assessment in endovascular therapy (EVT) among anterior circulation large vessel occlusion (LVO) patients within the 6–24 h extended time window. This prospective cohort analysis enrolled 152 LVO patients treated with EVT between January 2022 and June 2024. HIR was defined as the volume ratio of Tmax >10 s to Tmax >6 s hypoperfusion. Collateral status was assessed using the Tan scale, with scores ≥3 classified as favorable. According to the HIR cutoff (≤0.4) and collateral status, patients were divided into four subgroups: Group A (dual favorable), Group B (favorable HIR/poor collaterals), Group C (poor HIR/favorable collaterals), and Group D (dual unfavorable). All participants received standard EVT and adjunct medical therapy for comparative outcome analysis. Groups A (n = 42), B (n = 38), C (n = 35), and D (n = 37) differed significantly in baseline stroke severity and perfusion parameters, with Group D presenting larger ischemic cores, extensive hypoperfusion, and higher NIHSS scores (P < 0.05). Group A achieved the highest 90-day favorable functional rate (69.0%), alongside minimal infarct progression and superior reperfusion (88.1%) (P < 0.001). Favorable HIR (OR = 3.274, P = 0.002) and collateral status (OR = 3.516, P = 0.001) were independent protective factors. The combined model (AUC = 0.84) exhibited better predictive performance than single-index evaluation. Group A also had lower sICH and 90-day mortality than Group D (P < 0.05). Combined HIR and collateral assessment offers a feasible imaging stratification approach for ultra-long-window LVO patients. Dual favorable imaging features predict favorable post-EVT efficacy and safety, assisting individualized clinical decision-making for delayed EVT candidates.
引言
Acute ischemic stroke (AIS) constitutes one of the leading causes of adult disability and mortality worldwide1. Anterior circulation LVO, including occlusion of the M1 segment of the middle cerebral artery and the distal internal carotid artery, accounts for 30% to 40% of all AIS cases2. This condition progresses rapidly, and untreated occlusion of cerebral vessels leads to extremely high rates of disability and mortality3. EVT has been validated as an effective therapeutic approach for patients with anterior circulation LVO4. Clinical trials including DEFUSE 3 and DAWN have extended the therapeutic time window of EVT to 6–16 h, offering therapeutic opportunities for patients within the ultra-long time window5,6. Nevertheless, with the further extension of the time window to 24 h, precise screening of patients who can benefit from EVT has become a critical clinical challenge7. A proportion of patients within the ultra-long time window fail to achieve favorable therapeutic outcomes from EVT and face elevated hemorrhage risks due to expanded ischemic core and poor collateral circulation8.
HIR is a quantitative indicator derived from perfusion imaging that reflects the severity of hypoperfusion in ischemic regions9. Defined as the volume ratio of severely hypoperfused tissue (Tmax > 10 s) to moderately hypoperfused tissue (Tmax > 6 s), a lower HIR indicates superior perfusion status in hypoperfused regions and potentially stronger collateral compensatory capacity10. Previous studies have established that HIR predicts infarct progression, functional outcome, hemorrhagic transformation, and response to endovascular thrombectomy in AIS patients8,10,11. Previous research from Olivot et al. based on the DEFUSE 2 cohort validated that an HIR cutoff of ≤ 0.4 correlated with attenuated infarct expansion and improved long-term functional outcomes9. Further post-hoc analyses from the DEFUSE 3 trial additionally verified that decreased HIR values serve as an independent prognostic biomarker for favorable clinical recovery following delayed-window thrombectomy5. Existing studies have verified that HIR can predict infarct progression and clinical prognosis in AIS patients, serving as a core quantitative indicator for evaluating the severity of cerebral ischemia9,10. Collateral circulation acts as a vital compensatory blood supply pathway for ischemic brain tissue, and its integrity directly affects the expansion rate of infarct volume and therapeutic efficacy12. CTA-based collateral circulation scoring systems, such as the Tan score and Maas score, have been widely applied in clinical practice, and favorable collateral circulation substantially improves patient prognosis13,14.
Although HIR and collateral grading have each been validated separately for stroke prognostic evaluation, no prior prospective research has integrated these two complementary imaging markers—quantitative perfusion severity (HIR) and qualitative collateral circulation grade (Tan score)—to establish hierarchical risk stratification for patients presenting within the 6–24 h ultra-long time window. To fill this clinical gap, the present study developed a rapid, non-invasive, multi-dimensional imaging screening strategy. This novel approach improves patient selection for delayed-window EVT, overcoming the limitations of traditional time-dependent criteria and single-parameter evaluation methods. Current studies on the application of HIR combined with collateral circulation assessment in screening ultra-long time window (6–24 h) anterior circulation LVO patients for EVT are scarce15. Most existing literature consists of single-center retrospective studies without prospective cohort data support, and no targeted analysis based on local stroke center populations is available15,16. Therefore, this prospective, single-center, open-label cohort study enrolled ultra-long time window anterior circulation LVO patients admitted to the hospital. The study investigated the predictive value of HIR combined with collateral circulation assessment for the efficacy and safety of EVT, aiming to provide scientific evidence for precise patient screening and optimized clinical treatment decision-making in the local stroke center.
方案
Study design and study population
This work was conducted as a prospective, single‑center, open‑label cohort investigation. Subjects were recruited at the tertiary‑level comprehensive stroke center of the affiliated hospital. The research protocol obtained ethical clearance from the Medical Ethics Committee of Affiliated Rudong Hospital of Nantong University (approval ID: 2021122506). All investigative procedures followed the principles outlined in the Declaration of Helsinki and local ethical regulations. Written informed consent was obtained from each participant or their legal surrogate before study entry. Between January 2022 and June 2024, 218 consecutive individuals with suspected anterior‑circulation large‑vessel occlusion, whose symptom onset‑to‑arrival interval fell within 6–24 h from last‑known‑normal time, underwent screening. Sixty-six subjects were excluded from the study cohort: 28 failed to meet the inclusion criteria (12 exhibited non-large-vessel occlusion, 10 had baseline NIHSS below 6, and 6 lacked salvageable penumbral tissue on perfusion scans); 22 met the predefined exclusion criteria (8 had ASPECTS <5, 9 suffered from serious concurrent illnesses, and 5 presented pre-existing intracranial hemorrhage); 10 were unable to complete the 90-day follow-up; and 6 refused informed consent. Ultimately, 152 patients received interventional therapy and constituted the dataset for final analyses (Figure 1).
All perfusion parameters were initially generated by RAPID software and subsequently reviewed by two experienced neuro-radiologists. In cases of obvious segmentation errors (e.g., inclusion of cerebrospinal fluid spaces, motion artifacts, or vascular territories outside the anterior circulation), manual correction of the region of interest was performed before final quantitative values were locked. Inter-rater reliability for the final corrected continuous measurements was excellent (ICC = 0.91, 95% CI: 0.86–0.95), and consensus was reached via joint discussion for all discrepant cases.
Inclusion criteria were as follows: aged 18 to 80 years; diagnosed with AIS and confirmed as anterior circulation LVO (M1 segment of middle cerebral artery, distal internal carotid artery) via CTA or magnetic resonance angiography (MRA); symptom onset time of 6 to 24 h (calculated from the last known normal time to hospital admission); baseline NIHSS score ≥6 points; baseline CT/MRI perfusion imaging confirmed salvageable ischemic penumbra (ischemic core volume <70 mL, penumbra volume ≥15 mL, penumbra-to-ischemic core ratio ≥1.8); and written informed consent was obtained from patients or their legal guardians.
Exclusion criteria were as follows: presence of EVT contraindications, including severe bleeding tendency, intracranial hemorrhage, severe hepatorenal insufficiency, and coagulation disorders; history of intracranial surgery, severe cerebrovascular malformation or intracranial aneurysm; baseline imaging revealed extensive cerebral infarction (Alberta Stroke Program Early CT Score [ASPECTS] <5 points); inability to complete full follow-up and postoperative imaging re-examination; and complicated with severe cardiac, pulmonary, hepatic or renal failure.
Imaging examination and index measurement
All patients completed baseline cranial CT/MRI plain scan, CT/MRI perfusion imaging, and CTA examination upon admission. Cranial CT/MRI plain scan and perfusion imaging were re-examined 24 h after EVT, and an optional cranial MRI re-examination was performed at the 90-day follow-up. All imaging data were independently analyzed by two experienced neuro-radiologists with more than 10 years of clinical experience using a blinded method. Consensus was reached via joint discussion in case of discrepant interpretations. Inter-rater reliability was assessed using Cohen's kappa for the ordinal Tan collateral score (κ = 0.86, 95% CI: 0.79–0.93) and intraclass correlation coefficient (ICC, two-way random, absolute agreement) for continuous HIR and ischemic core volume measurements (ICC = 0.91, 95% CI: 0.86–0.95).
CT perfusion (CTP) imaging protocol
CTP was performed on a 256-slice CT scanner [e.g. Model X, Siemens Healthineers/GE Healthcare/Philips Healthcare] with the following parameters: tube voltage 80 kV, tube current 150 mAs [or automatic tube current modulation], detector collimation [e.g., 128 × 0.625 mm], slice thickness 5 mm, and Z-axis coverage of 100 mm (from the skull base to the centrum semiovale to encompass the anterior circulation territory). A total of 50 mL of iodinated contrast medium (iopromide, 370 mgI/mL [or iohexol 350 mgI/mL]) was administered intravenously via an 18-gauge antecubital catheter at a flow rate of 5 mL/s, followed by a 30 mL saline chaser at the same rate. CTP acquisition was initiated 5 s after contrast injection and continued for 60 s with a temporal resolution of 1.5 s per rotation. Images were reconstructed using a standard soft-tissue convolution kernel [e.g., H31/Siemens, Standard/GE, or B/Philips].
CT angiography (CTA) protocol:
Single-phase CTA was acquired from the aortic arch to the vertex during the arterial peak phase (15–20 s post-contrast injection) using the following parameters: tube voltage 100 kV, automatic tube current modulation, detector collimation [e.g., 128 × 0.625 mm], slice thickness 0.625 mm, reconstruction interval 0.5 mm, and pitch 0.6. A total of 60 mL of iodinated contrast medium (same concentration as CTP) was injected at 5 mL/s, followed by a 40 mL saline chaser. Images were reconstructed with a medium-sharp vascular kernel [e.g., H26f/Siemens, Bone/GE, or YA/Philips] and transferred to a dedicated workstation for multiplanar reformation and maximum intensity projection.
All perfusion imaging data were processed uniformly using RAPID software to calculate core imaging indicators including: ischemic core volume, defined as the volume of regions with apparent diffusion coefficient (ADC) <620 × 10⁻⁶ mm²/s on diffusion-weighted imaging (DWI) or cerebral blood flow (CBF) <30% on CT perfusion imaging17; hypoperfusion volume, which is the volume of regions with Tmax > 6 s and Tmax >10 s18; HIR, calculated as the volume ratio of Tmax >10 s hypoperfused regions to Tmax >6 s hypoperfused regions. The HIR cutoff of ≤ 0.4 for favorable status was adopted from prior validated studies, which demonstrated that this threshold optimally discriminates infarct progression and functional outcome in acute ischemic stroke9,10. HIR ≤0.4 was defined as favorable HIR, and HIR >0.4 was defined as poor HIR9; cerebral blood volume (CBV) index: the ratio of the mean CBV in Tmax >6 s hypoperfused regions to the mean CBV in contralateral normal brain tissue, which reflects the blood perfusion compensation status of hypoperfused regions19.
Collateral circulation was assessed using single-phase CTA acquired at the arterial peak phase (approximately 15–20 s post-contrast injection). The Tan scoring system was adopted to evaluate collateral circulation status13: 0 points (no collateral circulation), 1 point (minimal collateral circulation with only proximal occluded vessel filling), 2 points (moderate collateral circulation with partial filling of ischemic regions), and 3 points (excellent collateral circulation with complete filling of ischemic regions). A Tan score ≥3 points was defined as favorable collateral circulation, and a score <3 points were defined as poor collateral circulation13.
Treatment protocol
All enrolled patients received EVT combined with standardized pharmacological therapy in the neuro-interventional center of the hospital. The EVT strategy was individually formulated by professional neuro-interventional physicians based on patient-specific occlusion site and vascular conditions, including mechanical thrombectomy, balloon angioplasty, and stent implantation. All surgical operations were performed in strict accordance with the 2023 Chinese Guidelines for Endovascular Treatment of Acute Ischemic Stroke1.
The standardized in-hospital pharmacological regimen was implemented as follows: oral aspirin (100 mg/d, long-term administration) and clopidogrel (75 mg/d, continuous administration for 3 months); statin drugs (atorvastatin 20–40 mg/d) were prescribed according to blood lipid levels; blood pressure was strictly controlled with a target level below 140/90 mmHg; blood glucose management and symptomatic supportive treatment were performed simultaneously. Intravenous recombinant tissue plasminogen activator bridging therapy was administered to patients without intravenous thrombolysis contraindications.
Outcome Indicators
Primary outcome indicators include: 90-day mRS score, with mRS 0–2 scores defined as favorable clinical outcomes and 3–6 scores defined as adverse clinical outcomes20.
Secondary outcome indicators include: reperfusion success rate: Successful reperfusion was defined as modified Thrombolysis in Cerebral Infarction (mTICI 2b‑3) on final digital subtraction angiography (DSA), representing nearly full or complete restoration of blood flow within the affected vascular territory21. For auxiliary imaging validation, reperfusion achievement was further corroborated by a ≥90% reduction in the volume of tissue with Tmax > 6 s hypoperfusion on 24‑h post‑intervention perfusion scans. The concordance between mTICI 2b–3 and 24-h Tmax >6 s reduction ≥90% was strong (Cohen's kappa = 0.82). 24 h infarct volume: total volume of infarcted regions on 24-h postoperative DWI or CT imaging22; infarct growth rate: calculated as (24-h postoperative infarct volume − baseline ischemic core volume) / baseline ischemic core volume × 100%22.
Safety Indicators: Incidence of sICH (new-onset intracranial hemorrhage within 72 h after surgery accompanied by a ≥4-point increase in NIHSS score relative to baseline)23, 90-day all-cause mortality rate, and early neurological deterioration (≥4-point increase in NIHSS score within 24 h after surgery compared with baseline).
Follow-up protocol
A 90-day full-course follow-up was completed for all patients via outpatient follow-up supplemented by telephone follow-up. Fixed follow-up nodes included bedside evaluation at 24 h postoperatively, outpatient re-examination at 7 days and 30 days after surgery, and comprehensive clinical evaluation at 90 days postoperatively. Follow-up contents included neurological function assessment (NIHSS and mRS scores), scheduled cranial imaging re-examination, and complete recording of adverse events such as hemorrhage, infection, and death. All follow-up work was performed by uniformly trained professional stroke follow-up nurses to ensure the integrity and accuracy of follow-up data.
Statistical analysis
All statistical computations were performed using the Statistical Package for the Social Sciences (SPSS). Continuous variables conforming to normal distribution were summarized as mean ± standard deviation, with one‑way analysis of variance deployed for between‑group comparisons. Non‑normally distributed continuous datasets were reported as median (interquartile range, IQR). The Kruskal‑Wallis H test served for overall intergroup testing, whereas post‑hoc pairwise comparisons were carried out via the Mann‑Whitney U test. Categorical variables were presented as case counts and corresponding percentages [n (%)]. Categorical variables were compared using the Pearson χ2 test for multi-group comparisons (4 × 2 tables). Fisher's exact test was reserved for instances where the expected frequency in any cell was less than 5. All expected frequencies for baseline categorical variables (gender, underlying diseases, and occlusion site) exceeded 5, thus Pearson χ2 test was applied uniformly. For outcome categorical variables with expected cell frequencies below 5 (sICH and 90-day mortality), between-group comparisons were additionally verified using Fisher's exact test. The threshold for statistical significance was set at P < 0.05.
Multivariate logistic regression modeling was applied to identify independent associations of HIR and collateral perfusion status with two key clinical endpoints: favorable 90‑day functional outcomes and symptomatic intracranial hemorrhage (sICH). All regression models were built using the enter selection approach, incorporating variables with clinical significance and preliminary univariate screening results (P < 0.10). Adjusted covariates encompassed HIR profile, collateral circulation grade, patient age, admission NIHSS score, baseline ischemic core volume, onset-to-puncture interval, and final reperfusion grade (mTICI 2b–3 versus inferior grades). Variance inflation factor (VIF) analysis was utilized to assess multicollinearity, with VIF values below 5.0 defined as the absence of substantial collinearity. The Hosmer‑Lemeshow test was performed to verify each model’s calibration and fitness.
Receiver operating characteristic (ROC) analysis was implemented to quantify the predictive efficacy of different evaluation strategies. AUC values with 95% confidence intervals were calculated for single HIR assessment, standalone collateral grading, the dual HIR‑collateral combination model, and the full multivariate model integrating clinical covariates. The DeLong test was adopted for pairwise comparison of AUC values across different predictive models. A two‑tailed P value 0.05 was set as the threshold for statistical significance.
结果
Baseline characteristics of the study population
This study screened 218 consecutive patients presenting with suspected anterior circulation large vessel occlusion within the 6–24‑h extended treatment window, with 152 individuals ultimately enrolled for final analysis (Figure 1). The final cohort consisted of 89 male (58.6%) and 63 female (41.4%) patients, with a median age of 68.5 years (IQR: 60.0–76.0 years). Participants were stratified into four subgroups according to baseline HIR values and Tan collateral grades: Group A (favorable HIR and intact collateral circulation, n = 42), Group B (favorable HIR with poor collateral perfusion, n = 38), Group C (unfavorable HIR with robust collateral compensation, n = 35), and Group D (dual unfavorable HIR and collateral status, n = 37). Baseline demographic profiles, comorbid conditions, general clinical indicators, and partial imaging biomarkers were comparable across the four groups, with no statistically significant differences detected (P > 0.05).
In terms of baseline neurological severity, Group D exhibited significantly higher stroke severity, with a median admission NIHSS score of 18.0 (IQR: 14.0–22.0), which was markedly higher than the other three subgroups (P < 0.05). Imaging analysis revealed distinct intergroup differences in perfusion parameters. Group D presented substantially larger baseline ischemic core lesions, broader hypoperfusion areas at both Tmax > 6 s and Tmax > 10 s thresholds, and lower CBV index values (all P < 0.001). By contrast, Group A demonstrated the lowest baseline HIR level (median 0.32; IQR: 0.21–0.38) and significantly superior Tan collateral scores relative to the remaining cohorts (P < 0.001). No significant discrepancies were observed in key temporal metrics, including onset-to-door time, door-to-puncture time, and overall onset-to-puncture time across all groups (all P > 0.05). Comprehensive baseline data are summarized in Table 1.
Comparison of treatment-related indicators
Procedural characteristics were generally balanced among the four groups. No intergroup differences were found in EVT procedural modalities (including conventional mechanical thrombectomy, balloon angioplasty, stent deployment, and combined interventions), bridging intravenous thrombolysis rates, or postoperative standardized antiplatelet and statin administration rates (P > 0.05). Nevertheless, significant disparities were identified in reperfusion efficacy and procedural performance. Successful reperfusion, defined as mTICI 2b–3 on final DSA, was achieved in 88.1% of Group A, considerably exceeding the rates of 63.2% in Group B, 57.1% in Group C, and 35.1% in Group D (P < 0.001). When reperfusion was corroborated by a ≥90% reduction in Tmax >6 s hypoperfusion volume on 24-h perfusion scans, the same hierarchical intergroup pattern was observed with higher overall rates across all subgroups (Group A: 92.9%, Group B: 71.1%, Group C: 65.7%, Group D: 45.9%; P < 0.001). Procedural efficiency also varied significantly by imaging stratification. Group A had a median operative duration of 85.0 min (IQR: 72.0–98.0 min), which was notably shorter than Group D’s procedural time of 105.0 min (IQR: 88.0–120.0 min, P < 0.05), while no obvious differences existed between Group A and Groups B/C. In addition, Group A required fewer thrombectomy attempts (median = 1.0; IQR: 1.0–2.0) than Group D (median = 3.0; IQR: 2.0–4.0, P < 0.001). Correspondingly, Group A yielded the highest first-pass reperfusion rate at 71.4%, whereas Group D showed the lowest rate at 24.3% (P < 0.001), as illustrated in Figure 1.
Comparison of imaging outcomes
Postoperative 24-h imaging biomarkers demonstrated significant intergroup heterogeneity (all P < 0.001). Group A exhibited the smallest final infarct volume at 22.5 mL (IQR: 15.3–30.2 mL), compared with 38.6 mL in Group B, 42.3 mL in Group C, and 98.5 mL in Group D. Similarly, Group A showed the mildest infarct expansion, with a growth rate of 175.6%, far lower than the rates of 267.6%, 274.3%, and 244.4% observed in Groups B, C, and D, respectively. At 24 h post-intervention, Group A’s HIR decreased substantially to 0.08 (IQR: 0.03–0.25), which was significantly lower than the postoperative HIR values of the other three cohorts. In terms of cerebral blood perfusion recovery, Group A achieved a postoperative CBV index of 0.78 (IQR: 0.68–0.85), which was markedly higher than Group D’s value of 0.45 (IQR: 0.35–0.55, P < 0.001), while no statistical difference was found between Group A and Groups B/C (P > 0.05) (Figure 2).
Comparison of clinical outcomes and safety profiles
Ninety-day functional prognosis differed substantially across stratified subgroups. Group A attained a favorable functional outcome rate (mRS 0–2) of 69.0%, which was significantly higher than the 44.7% in Group B, 40.0% in Group C, and 16.2% in Group D (P < 0.001). The median 90-day mRS score in Group A was 2.0, reflecting superior long-term functional recovery relative to the other groups.
With regard to safety endpoints, the incidence of early neurological deterioration was comparable across all groups (P = 0.845). Group A presented a low sICH rate of 4.8%, which was significantly lower than Group D's rate of 21.6% (P = 0.039, Fisher's exact test), with no statistical differences between Group A and Groups B/C. The 90-day mortality rate in Group A was only 7.1%, markedly lower than Group D's 27.0% (P = 0.031, Fisher's exact test). Groups B and C showed intermediate mortality levels, which did not differ significantly from Group A. Additionally, secondary adverse events, including pulmonary infection and gastrointestinal bleeding, exhibited similar incidence rates among all cohorts (P > 0.05). Detailed safety and functional data are listed in Table 2.
Typical cases and representative imaging
To illustrate the divergent clinical trajectories across the imaging spectrum, we present two representative cases (Figure 3). Case 1, a 67-year-old male from Group A, presented with acute right limb weakness and dysarthria 12 h after onset. Baseline CTP revealed an ischemic core of 8.5 mL, a Tmax >6 s hypoperfusion volume of 92.3 mL, and a Tmax >10 s hypoperfusion volume of 29.5 mL, yielding a favorable HIR of 0.32 (Figure 3A). CT angiography demonstrated robust collateral filling with a Tan score of 3. Emergency mechanical thrombectomy achieved complete recanalization (mTICI grade 3). As shown in Figure 3B, HIR decreased markedly from 0.32 to 0.07 at 24 h post-EVT, while infarct volume expanded modestly from 8.5 mL to 23.2 mL. Consequently, the infarct growth rate was contained at 172.9%, and the patient achieved an mRS score of 1 at 90 days with no symptomatic intracranial hemorrhage (Figure 3C), indicating independent functional status.
In contrast, Case 2, a 70-year-old female from Group D, was admitted with acute left hemiplegia and confusion 18 h after onset. Baseline CTP showed substantially larger perfusion deficits: an ischemic core of 30.2 mL, a Tmax >6 s volume of 148.5 mL, and a Tmax >10 s volume of 98.6 mL, resulting in a poor HIR of 0.66 (Figure 3A). CTA confirmed minimal collateral filling (Tan score 1). Despite mechanical thrombectomy combined with balloon angioplasty, only partial recanalization (mTICI grade 2a) was achieved. Figure 3B demonstrates minimal improvement in HIR (0.66 to 0.63) and dramatic infarct progression from 30.2 mL to 102.5 mL. This patient's infarct growth rate reached 239.4%, and the patient developed symptomatic intracranial hemorrhage on postoperative day 3. At 90-day follow-up, the mRS score was 5, reflecting severe disability requiring long-term family care (Figure 3C).
Multivariate logistic regression analysis
90-day favorable clinical outcome (mRS 0–2 scores): Multivariate logistic regression was performed to screen independent prognostic factors for favorable 90-day functional outcomes. The regression model incorporated HIR status, collateral grade, age, baseline NIHSS score, initial ischemic core volume, onset-to-puncture time, and postoperative reperfusion grade as predictive variables. All variables yielded VIF values below 2.5, verifying the absence of multicollinearity. The Hosmer-Lemeshow test (χ² = 6.42, P = 0.601) confirmed satisfactory model fitness. Regression results indicated that favorable HIR (OR = 3.274, 95% CI: 1.582–6.772, P = 0.002) and intact collateral circulation (OR = 3.516, 95% CI: 1.703–7.257, P = 0.001) served as independent protective factors for favorable post-EVT prognosis. Higher baseline NIHSS scores and larger initial ischemic core volumes independently increased the risk of poor functional recovery (both P < 0.05). In contrast, patient age and onset-to-puncture interval showed no independent prognostic value (P = 0.235 and P = 0.412, respectively). Detailed regression outputs are presented in Table 3.
Symptomatic intracranial hemorrhage: Separate regression analysis for postoperative sICH complications demonstrated that favorable HIR (OR = 0.215, 95% CI: 0.058–0.798, P = 0.022) and satisfactory collateral perfusion (OR = 0.208, 95% CI: 0.056–0.772, P = 0.020) independently reduced hemorrhage risk. Conversely, increased baseline ischemic core volume was an independent risk predictor for sICH occurrence (OR = 1.082, 95% CI: 1.025–1.142, P = 0.005).
Predictive performance of combined imaging assessment
ROC analysis was conducted to quantify the predictive efficacy of single and combined imaging biomarkers for long-term functional prognosis. The integrated HIR-collateral model achieved an AUC of 0.84 (95% CI: 0.77–0.91) for predicting favorable 90-day outcomes, which was statistically superior to isolated HIR assessment (AUC = 0.72, P = 0.012) and standalone collateral grading (AUC = 0.74, P = 0.018). The full multivariate model integrating clinical covariates (age, baseline NIHSS, ischemic core volume, onset-to-puncture time, and reperfusion status) yielded an AUC of 0.89 (95% CI: 0.83–0.95). Although the full model exhibited slightly higher predictive accuracy, no significant difference was detected compared with the dual imaging combination model (DeLong test, P = 0.18). These findings validate that combining HIR and collateral evaluation provides robust incremental prognostic value for ultra-long window EVT patient stratification (Figure 4).
DATA AVAILABILITY:
Given the clinical‑quantitative design of this investigation and patient‑privacy constraints, raw individual‑level datasets carrying identifiable clinical and personal information cannot be released openly. De‑identified datasets underpinning the present results may be obtained from the corresponding author for academic validation and reproducibility purposes following reasonable formal requests. All data sharing is governed by local privacy rules and ethical review requirements. Each access application will undergo joint assessment by the study group and institutional ethics committee to enforce confidentiality obligations and comply with institutional research policies.
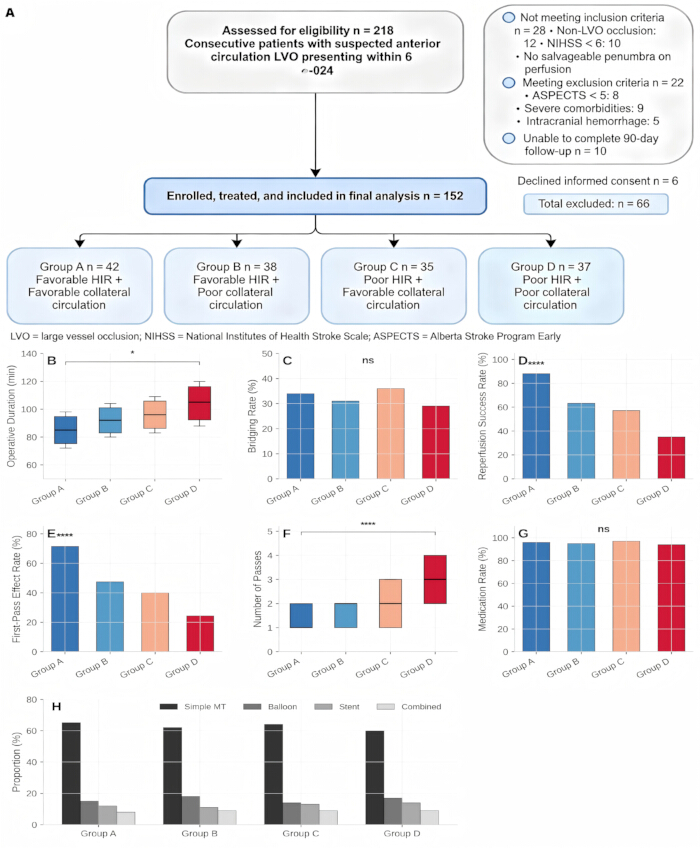
Figure 1: CONSORT‑based patient recruitment flowchart and intergroup comparison of procedural and therapeutic indicators across four HIR‑ and Tan collateral grade‑stratified subgroups (N = 152). (A) Flowchart detailing the overall patient screening process, exclusion criteria, final enrollment, interventional procedures, and subsequent statistical analysis. Quantitative comparisons of key treatment metrics are displayed in subgraphs (B–H). (B) Procedural time. (C) Bridging intravenous thrombolysis proportion. (D) Successful reperfusion rate defined by mTICI 2b–3 grading. (E) First‑pass reperfusion efficacy. (F) Median number of thrombectomy attempts. (G) Postoperative prescription rates of antiplatelet and statin medications. (H) Distribution of different endovascular intervention modalities. Statistical analysis confirmed a significant difference in procedural duration only between Group A and Group D (*P = 0.042). Both reperfusion success and first‑pass efficacy exhibited highly significant intergroup disparities (*P < 0.001), alongside the number of thrombectomy passes (*P < 0.001). No statistical differences were identified for all remaining evaluated parameters across the four cohorts (*P > 0.05). Abbreviations: EVT = endovascular treatment; mTICI = modified Thrombolysis in Cerebral Infarction; FPE = first-pass effect. Please click here to view a larger version of this figure.
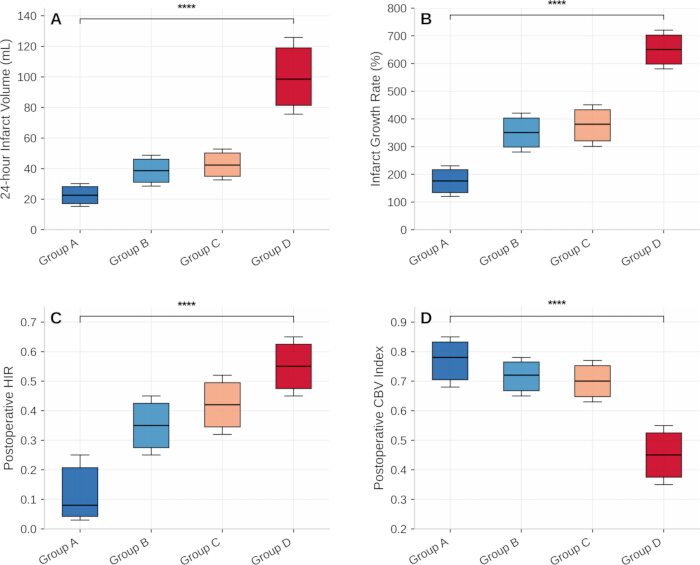
Figure 2: Postoperative 24‑h imaging outcome comparisons across four patient subgroups categorized by HIR values and Tan collateral grades (N = 152). (A–B) Subgraphs illustrate core imaging endpoints at 24 h after endovascular intervention. (A) Final infarct volume. (B) Overall infarct expansion rate. (C) Post-treatment HIR (D) Postoperative cerebral blood volume (CBV) index. All four imaging biomarkers yielded statistically significant overall differences among the stratified groups (*P < 0.001). Abbreviations: HIR = hypoperfusion intensity ratio; CBV = cerebral blood volume; IQR = interquartile range. Please click here to view a larger version of this figure.
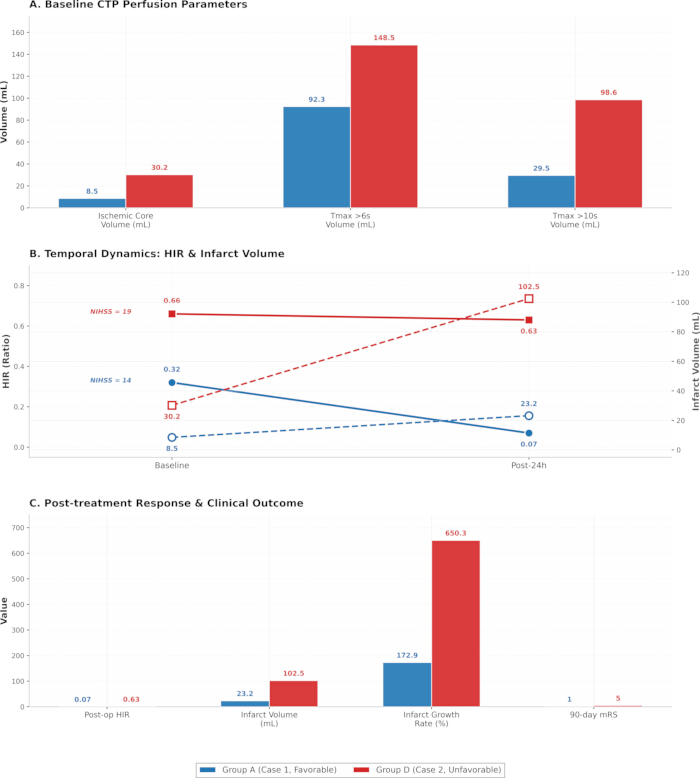
Figure 3: Comparative perfusion dynamics and clinical outcomes in representative cases with favorable versus poor hypoperfusion intensity ratio (HIR) and collateral circulation. (A) Baseline computed‑tomography perfusion (CTP) metrics, namely initial ischemic core volume as well as hypoperfusion volumes derived from Tmax >6 s and Tmax >10 s thresholds. (B) Temporal profiles of HIR (solid traces, left‑hand y‑axis) and infarct volume (dashed traces, right‑hand y‑axis) spanning baseline to 24 h following endovascular therapy (EVT), with admission National Institutes of Health Stroke Scale (NIHSS) scores labeled for reference. (C) Post‑intervention response markers together with 90‑day functional endpoints, covering post‑treatment HIR value, 24‑h infarct volume, infarct expansion rate, and 90‑day modified Rankin Scale (mRS). Blue bars and lines correspond to Case 1 (Group A, featuring favorable HIR and collateral status), whereas red bars and lines denote Case 2 (Group D, characterized by impaired HIR and poor collateral circulation). Please click here to view a larger version of this figure.
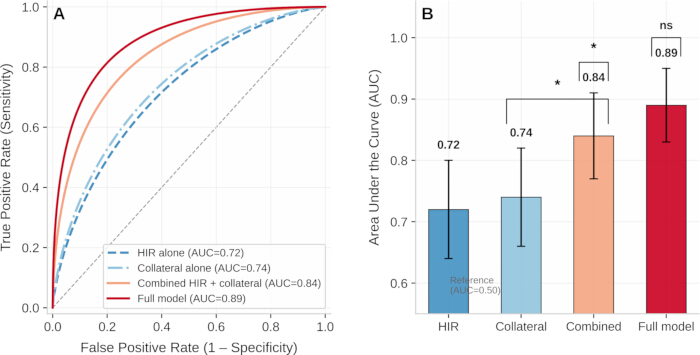
Figure 4: Receiver‑operating characteristic (ROC) analysis for the prediction of favorable 90‑day functional outcomes among patients with anterior‑circulation large‑vessel occlusion (LVO) treated within the 6–24 h extended time window (N = 152). (A) ROC plots illustrating predictive performance for the isolated‑HIR model, collateral‑status‑only model, integrated HIR‑collateral imaging model, and the comprehensive clinical‑imaging model. (B) Corresponding area‑under‑curve (AUC) estimates together with 95% confidence intervals (CI), alongside pairwise comparisons performed via the DeLong test. The integrated HIR‑collateral model attained an AUC of 0.84 (95% CI: 0.77–0.91). This value was statistically greater than that of single‑variable HIR (AUC = 0.72, *P = 0.012) and standalone collateral grading (AUC = 0.74, *P = 0.018). The full multivariable model, which incorporated age, admission NIHSS score, baseline ischemic‑core volume, onset‑to‑puncture interval, and reperfusion status, generated an AUC of 0.89 (95% CI: 0.83–0.95). No statistically meaningful improvement was observed relative to the dual‑marker imaging combination according to the DeLong test (*P = 0.18). Abbreviations: AUC = area under the curve; ROC, receiver‑operating characteristic; HIR = hypoperfusion intensity ratio; CI = confidence interval; NIHSS = National Institutes of Health Stroke Scale. Please click here to view a larger version of this figure.
| Baseline Characteristics | Group A (n = 42) | Group B (n = 38) | Group C (n = 35) | Group D (n = 37) | P Value |
| Gender, n (%) | Male 24 (57.1) | Male 22 (57.9) | Male 21 (60.0) | Male 22 (59.5) | 0.982 |
| Age (years), M (IQR) | 67.0 (59.0–75.0) | 69.0 (61.0–77.0) | 68.0 (58.0–76.0) | 69.5 (62.0–78.0) | 0.765 |
| Underlying Diseases, n (%) | |||||
| Hypertension | 34 (81.0) | 31 (81.6) | 28 (80.0) | 30 (81.1) | 0.992 |
| Diabetes mellitus | 15 (35.7) | 14 (36.8) | 13 (37.1) | 14 (37.8) | 0.991 |
| Atrial fibrillation | 18 (42.9) | 17 (44.7) | 15 (42.9) | 16 (43.2) | 0.993 |
| Hyperlipidemia | 20 (47.6) | 18 (47.4) | 17 (48.6) | 18 (48.6) | 0.997 |
| Previous stroke history | 5 (11.9) | 6 (15.8) | 5 (14.3) | 7 (18.9) | 0.785 |
| Baseline NIHSS score, M (IQR) | 14.0 (10.0–18.0) | 15.0 (11.0–19.0) | 16.0 (12.0–20.0) | 18.0 (14.0–22.0) | 0.003** |
| Occlusion Site, n (%) | |||||
| M1 segment of middle cerebral artery | 28 (66.7) | 25 (65.8) | 23 (65.7) | 24 (64.9) | 0.995 |
| Distal internal carotid artery | 14 (33.3) | 13 (34.2) | 12 (34.3) | 13 (35.1) | 0.995 |
| Imaging Indicators, M (IQR) | |||||
| Baseline ischemic core volume (mL) | 8.2 (4.5–12.6) | 10.5 (5.8–15.2) | 11.3 (6.2–16.5) | 28.6 (18.3–36.9) | < 0.001*** |
| Tmax > 6 s hypoperfusion volume (mL) | 89.5 (65.3–112.7) | 98.6 (72.5–120.3) | 102.3 (75.8–125.6) | 145.8 (118.5–168.2) | < 0.001*** |
| Tmax > 10 s hypoperfusion volume (mL) | 28.6 (18.5–38.7) | 48.3 (35.6–59.8) | 61.4 (48.5–72.3) | 95.8 (78.6–112.5) | < 0.001*** |
| HIR | 0.32 (0.21–0.38) | 0.38 (0.30–0.40) | 0.60 (0.53–0.68) | 0.66 (0.58–0.75) | < 0.001*** |
| CBV index | 0.86 (0.78–0.92) | 0.82 (0.73–0.89) | 0.75 (0.68–0.83) | 0.62 (0.55–0.70) | < 0.001*** |
| Tan score, M (IQR) | 3.0 (3.0–3.0) | 2.0 (1.0–2.0) | 3.0 (3.0–3.0) | 1.5 (1.0–2.0) | < 0.001*** |
| Onset-to-door time (min), M (IQR) | 480 (420–550) | 495 (430–560) | 470 (410–540) | 510 (440–580) | 0.712 |
| Door-to-puncture time (min), M (IQR) | 65 (45–85) | 70 (48–90) | 68 (46–88) | 72 (50–95) | 0.834 |
| Onset-to-puncture time (min), M (IQR) | 545 (480–620) | 565 (490–635) | 538 (475–610) | 582 (505–660) | 0.658 |
| Number of thrombectomy passes, M (IQR) | 1.0 (1.0–2.0) | 2.0 (1.0–2.0) | 2.0 (1.0–3.0) | 3.0 (2.0–4.0) | < 0.001*** |
| First-pass effect, n (%) | 30 (71.4) | 18 (47.4) | 14 (40.0) | 9 (24.3) | < 0.001*** |
Table 1: Baseline characteristic comparisons across four patient subgroups categorized based on hypoperfusion intensity ratio (HIR) and Tan collateral grading (N = 152). Analyzed baseline parameters encompassed patient demographic profiles, comorbid conditions, baseline National Institutes of Health Stroke Scale (NIHSS) scores, vascular occlusion locations, and core imaging biomarkers. All continuous variables were reported as median with interquartile range (IQR), whereas categorical variables were presented as case counts and corresponding percentages. Significant intergroup disparities were detected in multiple key baseline indicators, including baseline NIHSS score, initial ischemic core volume, hypoperfusion volumes with Tmax thresholds of 6 s and 10 s, HIR value, cerebral blood volume (CBV) index, Tan collateral grade, number of thrombectomy attempts, and first-pass reperfusion efficacy (all *P < 0.05). In contrast, no statistically remarkable differences were found in terms of patient age, sex distribution, preexisting comorbidities, occlusion site, symptom onset-to-door time, door-to-puncture time, or overall onset-to-puncture time (all *P > 0.05). Categorical variables were analyzed using the Pearson χ² test. All expected cell frequencies were ≥5, satisfying the assumptions for the χ² test application. The high P values for gender and underlying diseases reflect the well-balanced distribution across the four groups. Abbreviations: IQR = interquartile range; NIHSS = National Institutes of Health Stroke Scale; HIR = hypoperfusion intensity ratio; CBV = cerebral blood volume.
| Outcome Indicators | Group A (n = 42) | Group B (n = 38) | Group C (n = 35) | Group D (n = 37) | P Value |
| 90-day mRS score, M (IQR) | 2.0 (1.0–3.0) | 3.0 (2.0–4.0) | 3.0 (2.0–4.0) | 5.0 (4.0–6.0) | < 0.001*** |
| 90-day mRS 0–2 scores, n (%) | 29 (69.0) | 17 (44.7) | 14 (40.0) | 6 (16.2) | < 0.001*** |
| Reperfusion success rate (mTICI 2b–3), n (%) | 37 (88.1) | 24 (63.2) | 20 (57.1) | 13 (35.1) | < 0.001*** |
| 24-hour infarct volume (mL), M (IQR) | 22.5 (15.3–30.2) | 38.6 (28.5–48.7) | 42.3 (32.6–52.8) | 98.5 (75.6–125.8) | < 0.001*** |
| Infarct growth rate (%), M (IQR) | 175.6 (120.3–230.5) | 267.6 (197.5–337.7) | 274.3 (199.3–349.4) | 244.4 (174.5–314.3) | < 0.001*** |
| sICH incidence, n (%) | 2 (4.8) | 4 (10.5) | 4 (11.4) | 8 (21.6) | 0.14 |
| 90-day mortality rate, n (%) | 3 (7.1) | 5 (13.2) | 5 (14.3) | 10 (27.0) | 0.098 |
| Early neurological deterioration, n (%) | 7 (16.7) | 6 (15.8) | 6 (17.1) | 8 (21.6) | 0.914 |
Table 2: Clinical efficacy and safety comparisons across four patient subgroups stratified by HIR and Tan collateral grading (N = 152). Continuous variables are expressed as median with interquartile range (IQR), while categorical variables are summarized as counts and corresponding percentages. Statistical analyses revealed significant intergroup differences in multiple key endpoints, including 90-day modified Rankin Scale (mRS) scores, the proportion of patients achieving a 90-day mRS of 0-2, successful reperfusion defined as modified Thrombolysis in Cerebral Infarction (mTICI) 2b-3, 24-h infarct volume, and infarct expansion rate (all *P < 0.05). The incidence of sICH and 90-day mortality differed significantly between Group A and Group D (Fisher's exact test, both *P < 0.05), whereas the overall four-group comparison did not reach statistical significance. In contrast, the incidence of early neurological deterioration did not differ significantly among the four groups (*P = 0.845). Abbreviations: mRS = modified Rankin Scale; sICH = symptomatic intracranial hemorrhage; mTICI = modified Thrombolysis in Cerebral Infarction; IQR = interquartile range.
| Independent Variables | OR Value | 95% CI | P Value |
| HIR (favorable vs. poor) | 3.274 | 1.582–6.772 | 0.002 |
| Collateral circulation (favorable vs. poor) | 3.516 | 1.703–7.257 | 0.001 |
| Age | 0.978 | 0.945–1.012 | 0.235 |
| Baseline NIHSS score | 0.925 | 0.867–0.987 | 0.018 |
| Baseline ischemic core volume | 0.952 | 0.915–0.991 | 0.016 |
| Onset-to-puncture time | 0.998 | 0.994–1.002 | 0.412 |
| Reperfusion success (mTICI 2b–3 vs. < 2b) | 4.215 | 2.108–8.428 | < 0.001 |
Table 3: Multivariate logistic regression identifying independent predictors of favorable 90-day functional outcomes following endovascular therapy in patients with anterior circulation large vessel occlusion presenting within the ultra-long treatment window (N = 152). Favorable HIR status (OR = 3.274, 95% CI: 1.582–6.772, *P = 0.002), satisfactory collateral circulation (OR = 3.516, 95% CI: 1.703–7.257, *P = 0.001), and successful mTICI 2b–3 reperfusion (OR = 4.215, 95% CI: 2.108–8.428, *P < 0.001) were identified as independent protective factors for positive long-term prognosis. By comparison, higher baseline NIHSS scores (OR = 0.925, 95% CI: 0.867–0.987, *P = 0.018) and larger baseline ischemic core volume (OR = 0.952, 95% CI: 0.915–0.991, *P = 0.016) served as independent risk indicators. Neither patient age nor time from symptom onset to puncture exhibited independent predictive value for clinical outcomes (*P > 0.05). The Hosmer-Lemeshow test (χ² = 6.42, *P = 0.601) confirmed good model fitness. All variance inflation factor (VIF) values were below 2.5, verifying the absence of obvious multicollinearity in the regression model. Abbreviations: OR = odds ratio; CI = confidence interval; HIR = hypoperfusion intensity ratio; LVO = large vessel occlusion; EVT, endovascular treatment; mTICI = modified Thrombolysis in Cerebral Infarction; NIHSS = National Institutes of Health Stroke Scale; VIF = variance inflation factor.
讨论
The screening of ultra-long-time window (6–24 h) anterior circulation LVO patients eligible for EVT remains a critical clinical difficulty in stroke centers7. Although EVT can improve long-term functional outcomes in partial patients, significant individual differences in ischemic compensation exist among ultra-long-time window patients16. A subset of patients obtains limited surgical benefits and faces substantially elevated hemorrhage risks due to expanded irreversible ischemic lesions8. Single reliance on symptom onset time fails to achieve accurate screening of suitable candidates for EVT24. Therefore, the identification of stable and quantifiable combined imaging indicators to guide individualized clinical decision-making is essential for improving stroke treatment quality and long-term patient prognosis19. This single-center prospective cohort study validated that the combined evaluation of HIR and Tan collateral score enables hierarchical assessment of EVT benefits and risks in ultra-long-time window patients. Patients with both favorable baseline HIR and favorable collateral circulation (Group A) presented the highest vascular recanalization efficiency, slowest infarct progression, optimal long-term functional recovery, and lowest hemorrhage and mortality risks. Patients with dual poor indicators (Group D) obtained limited surgical benefits with significantly increased complication risks. Patients with a single favorable indicator (Group B and Group C) exhibited intermediate prognosis, which confirms the synergistic predictive effect of HIR and collateral circulation, with neither indicator being dispensable.
As a quantitative perfusion indicator, HIR directly reflects the proportion of severely hypoperfused ischemic tissue9. An HIR ≤0.4 indicates a small proportion of severely ischemic tissue and sufficient salvageable penumbra reserve10. Patients in Group A had low baseline HIR and limited severely ischemic regions, allowing rapid reperfusion of ischemic tissue after vascular recanalization and thus significantly reduced postoperative infarct volume and infarct growth rate. The substantial decrease in HIR at 24 h postoperatively dynamically verified the effective improvement of local perfusion by EVT. In contrast, HIR showed no significant improvement in Group D after surgery, which indicates poor ischemic compensation and irreversible brain tissue necrosis despite vascular recanalization. The local study findings are consistent with previous foreign DEFUSE series studies, further validating the prognostic predictive value of HIR in domestic single-center populations5,9.
Collateral circulation acts as a natural compensatory blood supply pathway for distal ischemic brain tissue after vascular occlusion12. This study adopted the Tan collateral scoring system primarily for its fast evaluative performance on routine single-phase CTA imaging13. As this grading method requires no dedicated post-processing software and integrates well with routine emergency diagnostic workflows, it is particularly applicable for urgent stroke treatment decisions in primary and regional stroke centers, where rapid bedside assessment is essential13. Favorable collateral circulation delays the expansion of ischemic core volume and extends the tissue survival window for ultra-long-time window surgery14. Patients with favorable collateral circulation (Groups A and C) had smaller baseline ischemic core volumes than Group D, and Group A exhibited the smallest ischemic core overall (Table 1). Nevertheless, favorable collateral circulation alone (Group C) failed to achieve an equivalent prognosis to Group A, which indicates that collateral circulation assessment cannot fully reflect hypoperfusion severity, and HIR-based quantitative evaluation of ischemic injury is indispensable for comprehensive judgment of brain tissue viability15. Similarly, favorable HIR combined with poor collateral circulation (Group B) leads to insufficient compensatory blood flow and continuous ischemic necrosis, resulting in limited surgical benefits. Combined assessment compensates for the evaluation limitations of single indicators and meets the requirements of emergency rapid imaging assessment16.
Patients assigned to Group D needed a greater number of thrombectomy attempts and demonstrated poorer first‑pass reperfusion outcomes25. Under conditions of impaired collateral circulation, repeated vascular endothelial trauma and extended procedural duration from multiple device passes could partly account for their higher tendency toward infarct expansion and increased symptomatic intracerebral hemorrhage (sICH) risk25. Multivariate regression analysis confirmed that favorable HIR and favorable collateral circulation remain independent protective factors for 90-day favorable prognosis and reduced sICH risk after adjusting for confounding factors, including age, baseline neurological function, ischemic core volume, onset-to-puncture time, and reperfusion status. sICH represents the most severe complication of EVT, and its mechanism is closely associated with excessive reperfusion injury and blood-brain barrier destruction after vascular recanalization23. Long-term ischemic hypoxia leads to endothelial cell damage and increased microvascular permeability26. For patients with poor HIR and poor collateral circulation, extensive irreversible ischemic damage occurs in brain tissue before surgery. Subsequent rapid reperfusion further aggravates cerebral edema and microvascular rupture, thereby significantly increasing the incidence of sICH27. The results of this study demonstrate that dual favorable indicators effectively reduce reperfusion-related hemorrhage risks, which may be attributed to the limited range of severe ischemic injury and intact microvascular structure in such patients. These structural features enable brain tissue to tolerate reperfusion stress after vascular recanalization and reduce the occurrence of severe complications28.
Landmark large-scale trials focusing on endovascular thrombectomy (EVT), including the DAWN and DEFUSE 3 studies, have confirmed the clinical efficacy of endovascular reperfusion therapy for stroke patients presenting within the 6–24 h time window, with patient enrollment guided by clinical-core mismatch or perfusion-core mismatch imaging criteria5,6. These pivotal trials have greatly advanced the standardized management of patients eligible for delayed-window EVT. Nevertheless, the screening strategies adopted in these studies rely on intricate volumetric cutoff values and dedicated professional analysis software, which cannot be universally accessible in all clinical institutions. This study proposes a novel auxiliary evaluation approach that combines hypoperfusion intensity ratio (HIR) with Tan collateral circulation grading. This rapid, non-invasive assessment modality avoids the requirement for accurate absolute penumbra volume calculation, serving as a practical alternative for clinical screening.
Conventional imaging evaluation methods possess notable deficiencies. The ASPECTS scoring system is prone to interference from early ischemic brain lesions and exhibits substantial inter-observer variability in clinical application. In addition, standalone ischemic core volume criteria may fail to identify specific patient subgroups who present with a small core lesion but experience rapid neurological deterioration and progressive cerebral injury. In comparison, the integrated HIR and collateral assessment system can objectively reflect the viability of endangered brain tissue and the compensatory status of cerebral collateral circulation. Such a strategy offers unique advantages for community and regional stroke centers, as well as clinical scenarios with suboptimal computed tomography perfusion (CTP) image quality. The four-group stratified classification established in this study can be seamlessly incorporated into routine clinical EVT decision-making workflows. Patients categorized into Group A (dual favorable imaging indicators) should be prioritized for EVT with standardized perioperative management, as this cohort achieves the highest successful reperfusion rates, the mildest infarct expansion, and the lowest incidence of procedural complications. For Group B and Group C patients (with only one favorable indicator), EVT treatment is optional, while intensive monitoring of infarct progression and individualized blood pressure regulation are recommended, considering their intermediate therapeutic benefits and procedural risks. For Group D patients (dual unfavorable indicators), EVT administration requires extreme prudence. The intervention may only be performed in highly selected cases, with full and detailed informed consent acquired to clarify the limited treatment benefits and elevated risks of symptomatic intracerebral hemorrhage (sICH) and mortality. This stratified assessment framework does not modify the existing technical eligibility criteria for EVT specified in the current clinical guidelines. Instead, it provides an additional imaging-based risk-benefit evaluation dimension, which facilitates standardized shared decision-making among clinicians, patients, and their families during stroke treatment.
This study presents distinct advantages compared with previous relevant studies. First, most domestic and foreign studies focus on the predictive value of a single HIR or collateral circulation indicator for EVT prognosis in ultra-long time window patients10,14. This study innovatively combines quantitative perfusion parameters and morphological collateral circulation grading to achieve multi-dimensional hierarchical risk stratification of patients, which compensates for the low accuracy of single-indicator evaluation15,16. Second, this study adopts a prospective cohort design with strict inclusion and exclusion criteria and standardized perioperative management and follow-up procedures, which may reduce potential bias and improve the reliability of the study findings29. Third, this study is based on real-world data from a local tertiary stroke center, and the research findings possess high clinical applicability and can directly guide individualized EVT screening and treatment decision-making for ultra-long time window patients in regional stroke centers6. Several limitations of this study cannot be ignored. First, this is a single-center study with a limited sample size, which may cause certain sampling bias. Multi-center, large-sample prospective studies are required to further verify the universality and stability of the research conclusions. Second, this study only adopts the Tan scoring system for collateral circulation evaluation and fails to compare with other common grading systems, such as the Maas score14. The optimal collateral circulation evaluation standard combined with HIR remains to be further explored. Third, this study only observes short-term prognostic indicators within 90 days. Long-term functional prognosis and cerebral vascular remodeling status of patients require extended follow-up investigation. Fourth, this study does not conduct quantitative analysis on the impact of different etiologies (such as atherosclerotic occlusion and cardioembolic occlusion) on the predictive efficacy of HIR and collateral circulation, and further subgroup analysis is needed in subsequent studies.
In summary, combined HIR and CTA-based Tan collateral circulation assessment provides a quantitative imaging approach for risk-benefit stratification of anterior circulation LVO patients undergoing EVT within the 6–24 h time window. Patients with concurrent favorable HIR and collateral status showed better reperfusion, less infarct expansion, more favorable 90-day functional outcomes, and lower complication risks, whereas patients with dual unfavorable indicators had poorer outcomes. Favorable HIR (≤0.4) and favorable collateral circulation (Tan score ≥3) were independently associated with favorable 90-day functional outcomes and reduced symptomatic intracranial hemorrhage risk. These findings support the potential value of combined HIR and collateral assessment as an additional imaging-based tool for individualized EVT decision-making in the extended treatment window.
披露
The authors confirm the absence of commercial, personal, financial, or other connections that might compromise the impartiality of reported outcomes. Study conception, implementation, data gathering, statistical processing, manuscript preparation, and submission decisions were completed independently, free of influence from outside commercial organizations, pharmaceutical sponsors, or third‑party individuals. No conflicts of interest are reported by any author.
Author Contributions:
Y.X. took part in study conception and methodological setup, data acquisition, formal statistical analysis, clinical investigation, original‑draft composition, and figure preparation. T.H. performed literature retrieval, assembled research datasets, carried out data analysis, and assisted with manuscript revision. J.S. secured research resources, oversaw project workflows, and revised the text. Z.W. developed the core research concept, supervised the entire investigation, revised the manuscript, and approved the final submitted version. Every author has read and endorsed the final manuscript and accepts collective accountability for the reliability and completeness of the presented results.
致谢
This study was supported by the Research Project “A Prospective Study on the Efficacy of Different Treatment Strategies for Bilateral Frontal Lobe Contusions” (Project No. MSZ2023082). The authors wish to thank the Department of Neurosurgery at Affiliated Rudong Hospital of Nantong University for supporting participant recruitment, interventional procedures, and peri‑operative patient care. Gratitude is also owed to the 152 enrolled patients and their relatives for their trust and willingness to take part in this research. Appreciation goes to the Medical Ethics Committee of Affiliated Rudong Hospital of Nantong University for its ongoing guidance and regulatory supervision over the study (Ethics Approval No.: 2021122506). We also recognize neuro‑interventional clinicians and stroke follow‑up nursing staff for their work on standardized data acquisition, imaging arrangement, long‑term patient follow‑up, and overall quality assurance.
材料
| 姓名 | 公司 | 目录编号 | 评论 |
|---|---|---|---|
| Aspirin | Bayer AG | N/A | Pharmaceutical; 100 mg enteric-coated tablets |
| Atorvastatin | Pfizer | N/A | Pharmaceutical; Lipitor 20 mg/40 mg |
| CARE Dose 4D | Siemens Healthineers Academy | N/A | |
| Clopidogrel | Sanofi | N/A | Pharmaceutical; 75 mg film-coated tablets |
| RAPID | iSchemaView | version 5.0 | Imaging analysis software |
| Recombinant tissue plasminogen activator (rtPA) | Boehringer Ingelheim | N/A | Pharmaceutical; Actilyse 50 mg |
| Siemens Artis zee | Siemens Healthineers | N/A | DSA system; Artis zee ceiling |
| Siemens Magnetom Avanto | Siemens Healthineers | Magnetom Avanto 1.5T | MRI scanner |
| Siemens Somatom Definition | Siemens Healthineers | SOMATOM Definition AS+ | CT scanner |
| Solitaire FR | Medtronic | SOL-FR-4-20 | Thrombectomy stent |
| SPSS | IBM Corp. | version 26.0 | Statistical software |
| Trevo ProVue | Stryker | (-PHONE-) | Thrombectomy stent |
参考文献
- Chinese Stroke Association, Neurointerventional Branch of Chinese Stroke Association, Interventional Group of Stroke Prevention and Control Committee, Chinese Preventive Medicine Association. Chinese Guidelines for Endovascular Treatment of Acute Ischemic Stroke (2023). Chin J Stroke. 2023;18(6):684–733.
- Goyal M, et al. Endovascular thrombectomy after large-vessel ischaemic stroke: a meta-analysis of individual patient data from five randomized trials. Lancet. 2016;387(10029):1723–31.
- Saver JL, et al. Time to treatment with endovascular thrombectomy and outcomes from ischemic stroke: a meta-analysis. JAMA. 2016;316(12):1279–88.
- Powers WJ, et al. Guidelines for the early management of patients with acute ischemic stroke: 2019 update to the 2018 guidelines for the early management of acute ischemic stroke. Stroke. 2019;50(12):e344–e418.
- Albers GW, et al. Thrombectomy for stroke at 6 to 16 h with selection by perfusion imaging. N Engl J Med. 2018;378(8):708–18.
- Nogueira RG, et al. Thrombectomy 6 to 24 h after stroke with a mismatch between deficit and infarct. N Engl J Med. 2018;378(1):11–21.
- Albers GW, et al. A multicenter randomized controlled trial of endovascular therapy following imaging evaluation for ischemic stroke (DEFUSE 3). Int J Stroke. 2017;12(8):896–905.
- Olivot JM, et al. Hypoperfusion intensity ratio predicts infarct progression and functional outcome in the DEFUSE 2 cohort. Stroke. 2014;45(4):1018–23.
- Olivot JM, et al. Optimal Tmax threshold for predicting penumbral tissue in acute stroke. Stroke. 2009;40(2):469–75.
- Cai QR, Liu J. Correlation Between Hypoperfusion Intensity Ratio and CTA Collateral Status in Acute Ischemic Stroke with Large Vessel Occlusion. Chin J CT MRI. 2024;22(12):1–4.
- Sun MF, et al. Prognostic Value of Hypoperfusion Intensity Ratio in Patients with Acute Ischemic Stroke Caused by Anterior Circulation Large Vessel Occlusion. Chin J Pract Diagn Ther. 2024;38(7):735–42.
- Sheth SA, Liebeskind DS, Saver JL. Collateral circulation in ischemic stroke: an updated review. J Stroke. 2023;25(1):3–16.
- Tan JC, et al. Systematic comparison of perfusion-CT and CT-angiography in acute stroke patients. Ann Neurol. 2007;61(6):533–43.
- Maas MB, et al. Collateral vessels on CT angiography predict outcome in acute ischemic stroke. Stroke. 2009;40(9):3001–6.
- Mlynash M, et al. Combination of Tmax and relative CBV perfusion parameters more accurately predicts CTA collaterals than a single perfusion parameter in DEFUSE 3 [conference abstract]. Stroke. 2019;50(Suppl 1):WP79. Available from: https://www.ahajournals.org/doi/10.1161/str.50.suppl_1.WP79
- Rao VL, et al. Collateral status contributes to differences between observed and predicted 24-h infarct volumes in DEFUSE 3. J Cereb Blood Flow Metab. 2020;40(10):1966–74.
- Purushotham A, et al. Apparent diffusion coefficient threshold for delineation of ischemic core. Int J Stroke. 2015;10(3):348–53.
- Arenillas JF, et al. Relative cerebral blood volume is associated with collateral status and infarct growth in stroke patients in SWIFT PRIME. J Cereb Blood Flow Metab. 2018;38(10):1839–47.
- Federau C, et al. Evolution of volume and signal intensity on fluid-attenuated inversion recovery MR images after endovascular stroke therapy. Radiology. 2016;280(1):184–92.
- van Swieten JC, Koudstaal PJ, Visser MC, Schouten HJA, van Gijn J. Interobserver agreement for the assessment of handicap in stroke patients. Stroke. 1988;19(5):604–7.
- Zaidat OO, et al. Recommendations on angiographic revascularization grading standards for acute ischemic stroke: a consensus statement. Stroke. 2013;44(9):2650–63.
- Neurology Branch of Chinese Medical Association, Cerebrovascular Disease Group of Neurology Branch of Chinese Medical Association, Neurovascular Intervention Collaboration Group of Neurology Branch of Chinese Medical Association. Chinese Guidelines for Early Endovascular Diagnosis and Treatment of Acute Ischemic Stroke (2022). Chin J Neurol. 2022;55(6):565–610.
- Hacke W, et al. Intravenous thrombolysis with recombinant tissue plasminogen activator for acute hemispheric stroke. The European Cooperative Acute Stroke Study (ECASS). JAMA. 1995;274(13):1017–25.
- Nguyen TN, et al. Mechanical thrombectomy in the late presentation of anterior circulation large vessel occlusion stroke: a guideline from the Society of Vascular and Interventional Neurology Guidelines and Practice Standards Committee. Stroke Vasc Interv Neurol. 2023;3(1):e000512.
- Zaidat OO, et al. First pass effect: a new measure for stroke thrombectomy devices. Stroke. 2018;49(3):660–6.
- Shi Y, et al. Rapid endothelial cytoskeletal reorganization enables early blood–brain barrier disruption and long-term ischaemic reperfusion brain injury. Nat Commun. 2016;7:10523.
- Mistry EA, et al. Symptomatic intracranial hemorrhage after endovascular thrombectomy: predictive factors and association with long-term functional outcome. J Neurointerv Surg. 2020;12(4):370–4.
- Campbell BCV, et al. Endovascular stent thrombectomy: the new standard of care for large vessel ischaemic stroke. Lancet Neurol. 2015;14(8):846–54.
- Smith WS, et al. Safety and efficacy of endovascular therapy in acute ischemic stroke with large infarct: a systematic review and meta-analysis. Stroke. 2023;54(1):123–32.