This bibliometric analysis maps 274 publications on probiotic-based interventions for postmenopausal osteoporosis from 2005 to 17 September 2026. The literature remained sparse through 2019, expanded after 2020, and shifted from prebiotic and fermented-dairy studies toward gut-microbiome mechanisms, short-chain fatty acid signaling, and randomized clinical trials.
研究文章
Bibliometric Analysis of Global Research Trends on Probiotic-Based Interventions for Postmenopausal Osteoporosis
* These authors contributed equally
本文内容
摘要
摘要
Postmenopausal osteoporosis (PMOP) is a major skeletal disorder associated with increased fracture risk and substantial morbidity. Growing evidence links the gut microbiota with bone homeostasis, supporting investigation of probiotic-based interventions through immunomodulation, maintenance of intestinal barrier function, and production of short-chain fatty acids. Existing bibliometric studies have examined broader relationships between the gut microbiota, bone metabolism, and osteoporosis; the present analysis focuses specifically on probiotic-based interventions relevant to PMOP. Records indexed in the Web of Science Core Collection were retrieved from the earliest eligible publication in 2005 to a fixed search cut-off of 17 September 2026. Relevance was determined from titles, abstracts, and author keywords, followed by independent screening. A total of 274 records were analyzed using VOSviewer and CiteSpace to characterize publication trends, geographic and institutional contributions, author productivity, journal distribution, document co-citation, and keyword co-occurrence. Publication output remained sparse through 2019 and increased after 2020, reaching 44 publications in 2025, the latest complete year. China contributed the most publications, while the United States had the highest international co-authorship link strength. Michigan State University and Sichuan University each contributed 21 publications, and Claes Ohlsson had the highest number of publications. Co-citation and keyword analyses indicated a shift from prebiotic, calcium-absorption, and fermented-dairy research toward gut-microbiome mechanisms, immunomodulatory pathways, short-chain fatty acid signaling, and randomized clinical trials. These findings provide a reproducible descriptive map of an emerging and heterogeneous research area and identify directions for further clinical investigation.
引言
Osteoporosis is a systemic skeletal disorder characterized by low bone mass, deterioration of bone microarchitecture, and increased susceptibility to fracture1. Postmenopausal osteoporosis (PMOP) is the most prevalent form of primary osteoporosis and affects approximately 32% of postmenopausal women in developed countries2. Estrogen deficiency after menopause disrupts the balance between bone formation and resorption, resulting in accelerated bone loss, particularly at trabecular-rich skeletal sites such as the lumbar spine, femoral neck, and distal radius3. Osteoporotic fractures, especially hip fractures, are associated with substantial morbidity, mortality, and healthcare expenditure4.
Current pharmacological management of PMOP includes antiresorptive agents, such as bisphosphonates, denosumab, and selective estrogen receptor modulators, as well as anabolic agents including teriparatide, abaloparatide, and romosozumab5. Although these therapies reduce fracture risk, their long-term use may be limited by adverse effects, treatment discontinuation, cost, and poor adherence6. Use of menopausal hormone therapy has also declined following reports of increased risks of breast cancer, cardiovascular events, and stroke in selected populations7. These limitations have encouraged the investigation of complementary long-term strategies, including interventions targeting the intestinal microbiota.
The human gastrointestinal tract contains a complex microbial community that contributes to host metabolism, immune regulation, nutrient absorption, and resistance to pathogens8. Growing evidence supports a functional relationship between the intestinal microbiota and skeletal homeostasis, commonly referred to as the gut-bone axis9. Proposed mechanisms include regulation of osteoimmune responses, particularly the balance between T helper 17 and regulatory T cells; production of short-chain fatty acids (SCFAs); maintenance of intestinal barrier integrity; modulation of calcium bioavailability; and regulation of systemic mediators involved in bone metabolism10,11,12.
Intervention studies relevant to this area predate the more widely cited mechanistic literature. A 2005 trial reported that inulin-type fructans enhanced calcium absorption and bone mineralization13, followed by a 2007 synthesis examining the effects of prebiotics, probiotics, and synbiotics on mineral absorption, bone mineral content, and bone structure14. A 2011 trial evaluated the prebiotic Synergy in relation to calcium utilization15, and a 2013 study examined a Lactobacillus-fermented preparation in an ovariectomy-induced bone-loss model16. In 2016, Li et al. demonstrated that sex steroid deficiency-associated bone loss was microbiota dependent and could be attenuated by Lactobacillus rhamnosus GG in mice17. Subsequent preclinical studies have investigated the bone-protective effects of Lactobacillus, Bifidobacterium, and related microbiota-targeted interventions18,19,20. Short-chain fatty acids have also emerged as potential mediators of skeletal effects through regulation of osteoclastogenesis and Treg-associated bone-formation pathways21,22. Human translation remains at an early stage, with randomized controlled trials reporting heterogeneous effects on bone-related outcomes23,24.
Bibliometric analyses have examined the broader relationships among the gut microbiota, bone metabolism, and osteoporosis25,26. A Scopus-based bibliometric analysis covering literature from 2010 to 2022 has also addressed related research27. The present study uses a more narrowly defined Web of Science Core Collection dataset focused on probiotic-based interventions relevant to PMOP and incorporates temporal publication analysis, country and institutional collaboration, author productivity, journal distribution, document co-citation, keyword co-occurrence, cluster timelines, and citation-burst analysis. This scope is intended to complement, rather than establish priority over, previous bibliometric studies.
The objectives were to characterize temporal publication and citation patterns; describe geographical, institutional, and author contributions and collaboration networks; evaluate journal distribution and document co-citation patterns; map keyword co-occurrence; and identify temporal changes in research themes. The resulting analysis is intended to provide a transparent and reproducible descriptive map of a small, heterogeneous, and emerging literature and to identify areas requiring further clinical and mechanistic investigation.
方案
This bibliometric analysis followed established bibliometric methodology and used a PRISMA-style framework to document literature identification, screening, eligibility assessment, and inclusion. The study workflow comprised five stages: database selection and literature retrieval; study selection and data extraction; data cleaning and standardization; bibliometric and visualization analysis; and interpretation and validation. A study-flow diagram records the numbers of records identified, screened, excluded, and included at each stage. Screening decisions, thesaurus files, software project files, parameter settings, and analysis files were retained to support reproducibility. The analysis used bibliographic metadata from published scientific literature and did not involve human participants, identifiable private information, animal experimentation, or biological samples. Institutional ethical review and informed consent were therefore not required. The tools used for this protocol are listed in the Table of Materials.
1. Database selection and justification
This bibliometric analysis followed established bibliometric methodology28 and used a PRISMA-style framework to document the identification, screening, eligibility assessment, and inclusion of the literature. The Science Citation Index Expanded (SCI-EXPANDED) and Social Sciences Citation Index (SSCI) were searched.
Use of a single database maintained consistent indexing conventions for author names, affiliations, cited references, subject categories, and author-keyword fields. Combining records from multiple databases can introduce duplicates and inconsistencies in author and institutional names. The single-database approach, however, does not provide exhaustive coverage because relevant publications indexed only in Scopus, PubMed, Embase, or other databases may not have been captured.
2. Search strategy and retrieval parameters
The search strategy combined terms related to probiotic or microbiota-targeted interventions with terms related to postmenopausal or estrogen-deficiency-associated bone loss. Relevance was determined from the title (TI), abstract (AB), and author-keyword (AK) fields. KeyWords Plus terms were retained as bibliographic metadata but were not used to determine eligibility because these terms are derived from cited-reference titles and may introduce records that do not directly address the research topic.
The Boolean search terms were:
(probiotic* OR Lactobacill* OR Bifidobacter* OR Lactiplantibacill* OR Lacticaseibacill* OR synbiotic* OR prebiotic*) AND (postmenopaus* OR "postmenopausal women" OR "postmenopausal female*") AND (osteoporos* OR osteopen* OR "bone loss" OR "bone mineral density" OR BMD OR "bone turnover" OR "bone health").
The search was performed in SCI-EXPANDED and SSCI from database inception to a fixed cut-off date of 17 September 2026. Both indices provide coverage extending from 1900 to the present. Searching from inception avoided imposition of an arbitrary starting year and enabled identification of the earliest eligible literature. The earliest included publication was a 2005 study examining inulin-type fructans, calcium absorption, and bone mineralization13, followed by a 2007 synthesis of the effects of prebiotics, probiotics, and synbiotics on mineral absorption and bone outcomes14. The analyzed publication period, therefore, extended from 2005 to 17 September 2026.
All publication counts and citation values were fixed to the same retrieval date. Because 17 September occurred before completion of the 2026 calendar year, records published or indexed during 2026 were treated as partial-year data. Thirty-six records were indexed during 2026 by the search cut-off. These records were retained in descriptive analyses but excluded from full-year comparisons, compound-growth calculations, curve fitting, and extrapolation of annual publication output.
- Language
Web of Science language metadata identified 272 English-language records and two non-English records among the 274 included records. The non-English records comprised a Portuguese systematic review published in 2012 and a Hungarian article published in 2015. Both records were retained because the indexed bibliographic metadata permitted their inclusion in descriptive mapping. Exclusion of these two records did not alter the reported top-ranked countries, institutions, authors, or journals. - Document types
The 274 included records comprised 181 original articles, 81 reviews, two articles published in conference proceedings, six meeting abstracts, one editorial, and three articles or reviews recorded in the Early Access stage. Original articles and reviews therefore accounted for 262 of 274 records (95.6%).
Meeting abstracts, the editorial, and proceedings articles were retained in the descriptive mapping to preserve consistency with the retrieved dataset. A sensitivity analysis excluding these records together with the two non-English records produced a 265-record dataset and did not alter the reported top-10 country, institution, author, or journal rankings.
Early Access was treated as a publication stage rather than as a separate document type. Records that subsequently received final bibliographic information were assigned to the year of final publication. Records that remained in Early Access at the search cut-off retained that status, preventing duplicate counting or assignment to more than one publication year.
3. Study selection and data extraction
Retrieved records were screened after duplicates were removed. Records admitted solely through KeyWords Plus or records that did not satisfy the predefined scope criteria were excluded. Two investigators (SY and AM) independently screened the title, abstract, and author keywords of each record. Eligible records addressed a probiotic, prebiotic, synbiotic, postbiotic, fermented-dairy, or microbiota-transfer intervention in the context of postmenopausal, estrogen-deficiency-associated, or ovariectomy-associated bone loss. Disagreements between the two investigators were adjudicated by a third investigator (JY).
The following variables were extracted from each included record: authors, author affiliations, title, abstract, author keywords, KeyWords Plus, journal name, publication year, volume, issue, page range or article number, DOI, document type, language, total citation count, cited references, and funding information. KeyWords Plus terms were retained for bibliographic description but were not used to determine study eligibility.
Country names were standardized using a controlled thesaurus. Records indexed as "Peoples R China" and "China" were unified as "China," and historical variants of "Turkey" were standardized as "Turkiye." Records from England, Scotland, Wales, and Northern Ireland were retained according to the country values recorded in Web of Science. For the country-collaboration visualization, software aggregation of these four constituent countries under a United Kingdom category was restricted to the graphical representation and did not alter the underlying country metadata.
Institutional names were standardized using organization name, city, and country. Author names were disambiguated using institutional affiliation and ORCID identifiers when available.
4. Bibliometric analysis software and parameters
VOSviewer version 1.6.20 (RRID:SCR_023516) was used for network construction and visualization29. CiteSpace version 6.4.R1 (RRID:SCR_025121) was used for document co-citation clustering, cluster-timeline visualization, and citation-burst detection30. Two investigators (AM and AA) independently performed the bibliometric analyses. Differences in analytical output were resolved by consensus using the same cleaned dataset and predefined parameter settings.
- VOSviewer analysis
VOSviewer was used to construct country co-authorship, institutional co-authorship, journal coupling, and keyword co-occurrence networks. Author productivity was additionally summarized using publication counts.
Fractional counting was applied to co-authorship and co-occurrence analyses to reduce the influence of publications containing large numbers of co-authors or institutional affiliations. Association-strength normalization was used for network mapping. Minimum thresholds for inclusion in network analyses were three publications for countries, two publications for authors, two publications for institutions, three occurrences for keywords, and two citations for cited journals. These network-inclusion thresholds were distinct from the thresholds used to display selected summary tables. Table 1 presents countries with at least five publications. Total link strength (TLS) was defined as the fractional co-authorship link strength calculated by VOSviewer under the stated analysis settings. - CiteSpace analysis
CiteSpace was used for document co-citation clustering, cluster-timeline visualization, and citation-burst analysis. The co-cited-reference network was constructed using 1-year time slices from 2014 through 2026. The underlying source corpus covered publications from 2005 through the fixed cut-off date in 2026.
Term sources included titles, abstracts, and author keywords. KeyWords Plus terms were excluded from relevance labeling. The cited-reference node type was used for document co-citation analysis, and the keyword node type was used for co-word analysis. The top 50 items per time slice were selected using LRF = 2.5, L/N = 10, LBY = 5, and e = 1.0. Cosine similarity was used for link strength, and Pathfinder pruning was applied.
The resulting document co-citation network contained 872 nodes and 2,820 links, with a network density of 0.0074. The largest connected component contained 847 nodes, corresponding to 97% of the network. The analysis resolved 15 clusters. Cluster quality was assessed using modularity and silhouette statistics, with modularity Q = 0.7404 and weighted mean silhouette S = 0.8966.
Keyword evolution was additionally examined using VOSviewer temporal-overlay maps. Citation-burst analyses excluded the incomplete 2026 calendar year.
结果
Publication output and temporal growth trends
The earliest eligible publication was identified in 2005 and examined inulin-type fructans in relation to calcium absorption and bone mineralization13. This was followed in 2007 by a synthesis of the effects of prebiotics, probiotics, and synbiotics on mineral absorption, bone mineral content, and bone structure14. No eligible records were identified in 2008 or 2009. Subsequent early intervention studies included investigations of genistin plus fructooligosaccharides in 2010, the Synergy prebiotic in 201115, and a Lactobacillus-fermented preparation in an ovariectomy-induced bone-loss model in 201316. The 2016 study by Li et al. provided an additional mechanistic contribution by demonstrating microbiota-dependent bone loss associated with sex steroid deficiency17.
Annual publication output remained low through 2019, with no more than 11 publications in any single year. Output increased after 2020, with 21 publications in 2020, 23 in 2021, 35 in 2022, 24 in 2023, 40 in 2024, and 44 in 2025, the highest total among complete calendar years (Figure 1). By the fixed cut-off of 17 September 2026, the cumulative dataset contained 274 records. Of these, 51 records (18.6%) were published before 2020, 187 (68.2%) were published during the six complete years from 2020 through 2025, and 36 were indexed during the incomplete 2026 calendar year. Because 2026 represents a partial publication year and annual output was low during much of the study period, no compound-growth rate or fitted growth curve was calculated. China contributed the largest number of publications, with 103 of 274 records (37.6%).
Country contribution and collaboration analysis
A total of 39 countries or regions contributed to the dataset (Figure 2; Table 1). The 10 highest-output countries accounted for approximately 86% of country-assigned publications under full counting, in which internationally co-authored publications were assigned to each contributing country. China contributed 103 publications and 3,736 citations, followed by the United States with 41 publications and 2,936 citations. South Korea contributed 19 publications, while Poland and India contributed 12 each. Australia and Iran contributed 11 publications each, Sweden and Switzerland contributed nine each, and Denmark contributed eight. Canada and Japan also contributed eight publications and therefore shared the same publication count as Denmark.
Citation counts represent total Web of Science times-cited values at the fixed 17 September 2026 cut-off. Under fractional counting, the United States had the highest total link strength (TLS = 16), followed by China (TLS = 11), indicating a higher level of international co-authorship connectivity for the United States despite China's larger publication count. Among the higher-output countries, Poland had approximately 151 citations per document, followed by the United States with approximately 72 and Sweden with approximately 69. These values are descriptive and should be interpreted cautiously because several national publication totals were small.
Institutional contribution analysis
Michigan State University and Sichuan University contributed the largest number of publications, with 21 each (Table 2). Jiangnan University and Shanghai Jiao Tong University each contributed 16 publications, while the University of Gothenburg and Shiraz University of Medical Sciences each contributed 15. Emory University and Southeast University each contributed 13 publications, and Universiti Putra Malaysia and Shanghai University each contributed 10.
Among the institutions listed in Table 2, Emory University had the highest mean citation count at 32.08 citations per document, followed by Michigan State University at 29.43 citations per document. The institutional co-authorship network showed several geographically concentrated groups (Figure 3A). One group included Michigan State University, Emory University, the University of Gothenburg, and Aarhus University. A second group included Shanghai Jiao Tong University, Sichuan University, Jiangnan University, Southeast University, and Southern Medical University. Additional groups included institutions in South and Southeast Asia and the Middle East, including Shiraz University of Medical Sciences, Universiti Putra Malaysia, and Chulalongkorn University. The temporal overlay showed the distribution of institutional activity from 2018 through 2026 (Figure 3B).
Author productivity and collaboration
A total of 1,620 distinct authors contributed to the 274-record dataset. Claes Ohlsson had the highest publication count, with six publications and 512 citations (Table 3). Rupesh K. Srivastava, Klara Sjogren, Laura R. McCabe, Rene Rizzoli, and Connie M. Weaver each contributed five publications. Several additional authors contributed four publications. Among the authors meeting the productivity threshold, Laura R. McCabe had 777 citations and Narayanan Parameswaran had 651 citations. The revised ranking, therefore, distinguishes authors with repeated contributions to the dataset from authors associated with a single highly cited publication. Author and document co-citation patterns identified several recurring research groups. These included a Gothenburg group involving Ohlsson and Sjogren, a Michigan State University group involving McCabe and Parameswaran, and Indian groups involving Srivastava, Bhardwaj, Sapra, and Mishra. Figure 4 presents the document co-citation network rather than an author co-authorship network.
Journal distribution and coupling analysis
The 274 publications appeared across 150 journals, indicating substantial dispersion across publication venues. Nutrients had the highest publication count with 18 articles (Table 4). Osteoporosis International and Frontiers in Endocrinology each published eight articles, while Calcified Tissue International, Probiotics and Antimicrobial Proteins, and Frontiers in Immunology each published seven. Food & Function published six articles, while Scientific Reports and Critical Reviews in Food Science and Nutrition each published five.
Among the journals listed in Table 4, Calcified Tissue International had an average of 12.14 citations per document, while Gut Microbes had an average of 10.00 citations per document.
The journal coupling network placed Nutrients, Osteoporosis International, Calcified Tissue International, and Probiotics and Antimicrobial Proteins near the center of the network (Figure 5A). The temporal overlay suggested increasing representation of microbiology- and immunology-focused journals during more recent publication years (Figure 5B).
Keyword o-occurrence and research theme evolution
Document co-citation analysis identified 15 clusters within a network of 872 cited references and 2,820 links (Figure 4; Figure 6A). The network had a modularity Q value of 0.7404 and a weighted mean silhouette value of 0.8966, indicating substantial separation and internal consistency among the identified clusters. Keyword co-occurrence analysis provided a complementary representation of major author-keyword themes (Figure 6B).
Cluster #0, "ovariectomy-induced cortical bone loss," represented a predominantly preclinical theme involving ovariectomized models, cortical and trabecular bone microarchitecture, bone mineral density, and mechanical properties. Cluster #4, "gut microbiome," included work on microbial composition, intestinal barrier function, immune regulation, bile acids, and short-chain fatty acids. Cluster #6, "double-blind controlled trial," represented clinical studies involving randomized placebo-controlled probiotic interventions and bone-related outcomes in postmenopausal women. Cluster #3, "osteoporosis pathogenesis," included RANKL/OPG signaling, inflammatory cytokines, and Th17/Treg-associated immune regulation.
The remaining clusters were #1 "musculoskeletal condition," #2 "bone loss," #5 "dietary strategies," #7 "fermented dairy products consumption," #8 "nutritional intervention," #9 "BMP-2 gene," #10 "postmenopausal osteopenic women," #11 "lactose intolerance," #12 "inhibitory factor," #13 "postmenopausal osteoporotic mice model," and #14 "healthy postmenopausal Japanese women."
The keyword network and co-citation timeline showed a broad shift in research emphasis over time. Earlier publications emphasized the effects of prebiotics and inulin-type fructans on calcium absorption, fermented dairy products, soy isoflavones, equol, and mineral balance. Subsequent work increasingly examined ovariectomized models, gut-microbiota composition, Lactobacillus rhamnosus GG, and Treg-Th17-associated mechanisms. More recent publications included short-chain fatty acid signaling, 16S rRNA sequencing, aryl hydrocarbon receptor signaling, mesenchymal stem cells, and randomized controlled trials. The incomplete 2026 calendar year was excluded from citation-burst interpretation.
DATA AVAILABILITY:
The raw input data consist of the Web of Science Core Collection export file generated on 17 September 2026 from the Science Citation Index Expanded (SCI-EXPANDED) and Social Sciences Citation Index (SSCI) indexes using the search syntax reported in the Search strategy section. Processed and derived materials include the cleaned and deduplicated dataset of 274 records in tabular format, country and institutional thesaurus files used for name standardization, and ranking tables for countries, institutions, authors, and journals. All shareable derived materials are included as Supplementary File 1 with this submission.
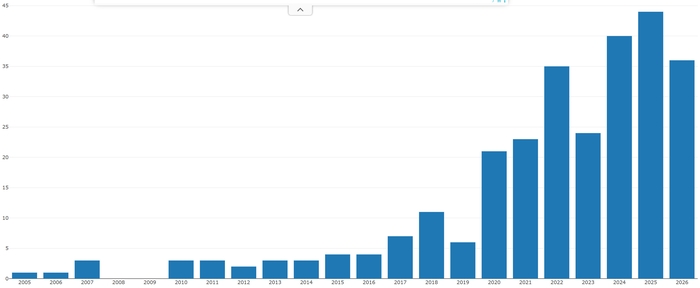
Figure 1: Annual publication output of probiotic-based postmenopausal osteoporosis research, 2005-2026. Annual publication counts are shown for the 274 records included, based on the fixed search cut-off of 17 September 2026. No eligible publications were identified in 2008 or 2009. Annual output remained low through 2019 and increased after 2020, reaching 44 publications in 2025, the latest complete calendar year. The 36 records indexed in 2026 represent a partial year and were excluded from full-year comparisons and trend fitting. Please click here to view a larger version of this figure.
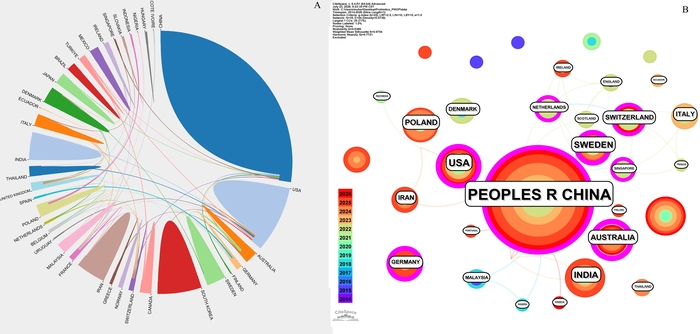
Figure 2: International co-authorship network by country. The collaboration chord diagram shows publication output and international co-authorship relationships among contributing countries. Segment size is proportional to publication count, and connecting chords represent co-authorship links between countries. Historical variants of "Turkey" were standardized as "Turkiye." Records from England, Scotland, Wales, and Northern Ireland were retained separately in the underlying Web of Science data but were aggregated under a United Kingdom category (labeled as "United Kingdom" rather than "UK") for visualization. Please click here to view a larger version of this figure.
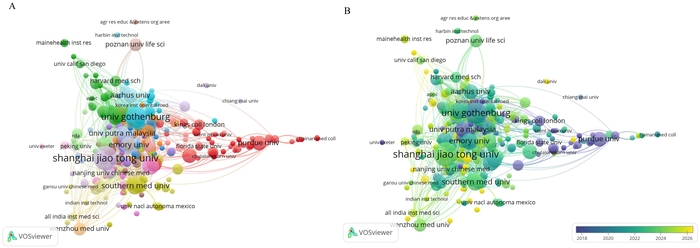
Figure 3: Institutional co-authorship network. (A) Cluster view of institutional co-authorship relationships, with node size representing publication count, links representing co-authored publications, and color indicating network cluster. (B) Temporal overlay showing the average publication year of each institution from 2018 to 2026. Please click here to view a larger version of this figure.
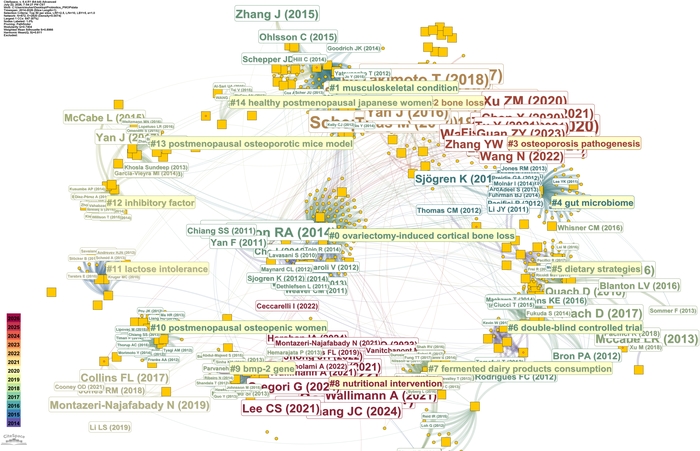
Figure 4: Document co-citation network. CiteSpace document co-citation analysis was performed using 1-year slices from 2014 to 2026, selection of the top 50 items per slice, and Pathfinder pruning. The network contained 872 cited-reference nodes and 2,820 links, with a density of 0.0074. Fifteen clusters were identified, with modularity Q = 0.7404 and weighted mean silhouette S = 0.8966. The largest connected component contained 847 nodes, corresponding to 97% of the network. Node size represents co-citation frequency, and node color reflects co-citation year. Please click here to view a larger version of this figure.
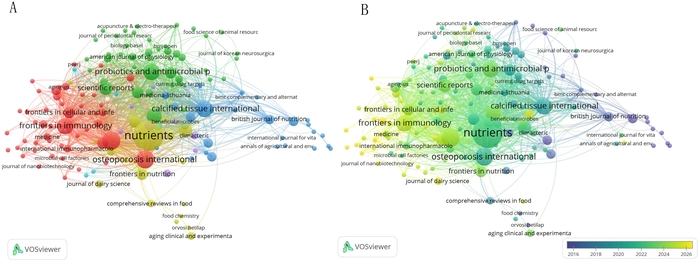
Figure 5: Journal coupling network. (A) Cluster view of bibliographic coupling among journals, with node size representing publication count and links representing shared references. (B) Temporal overlay showing the average publication year of each journal from 2016 to 2026. Nutrients, Osteoporosis International, Calcified Tissue International, and Probiotics and Antimicrobial Proteins were positioned near the center of the coupling network. Please click here to view a larger version of this figure.
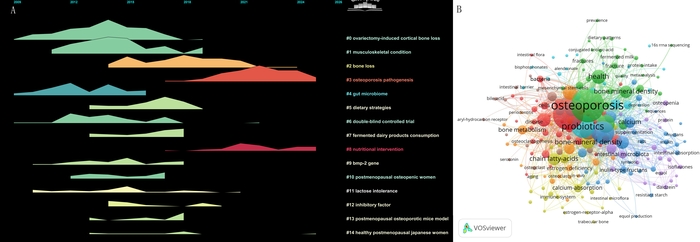
Figure 6: Research themes and temporal evolution. (A) CiteSpace timeline of the 15 document co-citation clusters, positioned according to the publication years of the cited references. The cited-reference timeline may extend before the 2005 start of the source corpus because the axis represents publication dates of cited literature rather than of included records. (B) VOSviewer author-keyword co-occurrence network, with node size representing keyword frequency and color representing cluster membership. Keyword variants were standardized using a controlled thesaurus to eliminate duplicate entries. Major themes included prebiotic and calcium-absorption research, gut-microbiota and immune mechanisms, short-chain fatty acid signaling, and clinical intervention studies. The incomplete 2026 calendar year was excluded from citation-burst interpretation. Please click here to view a larger version of this figure.
Table 1: Ten countries with the highest publication output. Countries are ranked by the number of publications in the 274-record dataset. Columns report rank, country, number of documents, total Web of Science citations at the fixed 17 September 2026 cut-off, and total link strength from the fractional co-authorship analysis. Countries with at least five publications were included in the displayed ranking. Please click here to download this Table.
Table 2: Ten institutions with the highest publication output. Institutions are ranked by the number of publications. Columns report rank, institution, country, number of documents, total citations, and average citations per document. Institution names were standardized using organization name, city, and country. Please click here to download this Table.
Table 3: Ten authors with the highest publication output. Authors are ranked primarily by number of publications, with total link strength used as the tie-breaker. Columns report rank, author, affiliation, number of documents, total citations, and total link strength. Authors with at least four publications were included in the displayed ranking. Please click here to download this Table.
Table 4: Ten journals with the highest publication output. Journals are ranked by the number of publications in the included dataset. Columns report rank, journal, number of documents, total citations, and average citations per document. Citation values were calculated using Web of Science times-cited counts at the fixed 17 September 2026 cut-off. Please click here to download this Table.
Supplementary File 1: The raw input data. Please click here to download this file.
讨论
This bibliometric analysis characterizes publications on probiotic-based interventions relevant to postmenopausal osteoporosis (PMOP) from the earliest included record in 2005 to the fixed cut-off of 17 September 2026. The 274-record corpus remains small and heterogeneous, with only limited annual output through 2019 followed by increased publication activity after 2020. The literature spans early studies of prebiotics, calcium absorption, and fermented dairy products; subsequent preclinical investigations of gut-bone mechanisms; and a smaller body of human intervention studies. This pattern indicates an emerging research area rather than a mature or consolidated field. The present analysis complements earlier bibliometric studies addressing the broader relationships between gut microbiota, bone metabolism, and osteoporosis25,26.
Geographical and institutional contributions were unevenly distributed. China contributed the largest share of publications, accounting for 103 of 274 records (37.6%), whereas the United States had the highest total international co-authorship link strength. Several European countries showed high citation averages, although these estimates were influenced by small publication counts and individual highly cited papers. Research groups in China, the United States, Sweden, India, Iran, Malaysia, South Korea, and other countries contributed to the literature, but the relatively small number of publications from many countries limits the interpretation of national rankings. Country, institution, author, and journal rankings should therefore be regarded as descriptive indicators of publication activity rather than measures of research quality or scientific influence.
Keyword and co-citation analyses identified recurring themes involving immune regulation, intestinal microbial composition, short-chain fatty acids, and estrogen-deficiency-associated bone loss. Experimental studies have linked estrogen deficiency with changes in intestinal barrier function, immune activation, and the balance between T helper 17 and regulatory T cells, while probiotic interventions have been investigated for potential effects on these pathways17,18,19,20,21,22,. Short-chain fatty acids, particularly propionate and butyrate, have also been examined as potential mediators of skeletal effects through regulation of osteoclast differentiation and Treg-associated bone formation21,22. These mechanistic themes are prominent in the mapped literature, although much of the causal evidence continues to derive from ovariectomized animal models. The appearance of randomized and double-blind controlled trials within the more recent literature indicates increasing clinical investigation, but available human findings remain heterogeneous23,24. Evidence is not yet sufficient to establish optimal probiotic strains, doses, treatment durations, timing relative to menopause, or patient characteristics associated with treatment response. Future clinical studies would benefit from larger sample sizes, longer follow-up, standardized intervention reporting, and clinically meaningful skeletal outcomes. Measures of bone mineral density and bone turnover may be supplemented by assessments of trabecular and cortical microarchitecture and, where appropriate, imaging-based approaches such as dual-energy X-ray absorptiometry, computed tomography Hounsfield units, and vertebral bone quality measurements31. Investigation of host characteristics, baseline microbiota composition, diet, and concurrent osteoporosis treatment may also help explain variation in clinical response.
Several limitations should be considered. The analysis used a single bibliographic database, and publications indexed only in Scopus, PubMed, Embase, or other sources may therefore have been missed. The dataset was predominantly English-language, although two non-English records were retained, which may contribute to language and geographic bias. Conference abstracts, one editorial, and two proceedings articles were also retained in the descriptive dataset; sensitivity analysis excluding these records together with the two non-English records did not alter the reported top-10 rankings. The small size of the literature means that percentages, citation averages, centrality measures, and rankings can be affected substantially by individual publications. The 2026 calendar year was incomplete and was excluded from full-year comparisons and trend fitting. Citation counts are time-dependent, and author or institutional disambiguation cannot eliminate all ambiguity. Bibliometric analysis describes patterns in the published literature but does not evaluate methodological quality, risk of bias, or treatment efficacy in individual studies.
Overall, probiotic-based interventions for PMOP represent a small but increasingly investigated area at the transition between preclinical and early clinical research. The mapped literature highlights recurring mechanistic themes involving the gut microbiota, immune regulation, intestinal barrier function, and microbial metabolites while also showing that clinical evidence remains limited. Further progress will require reproducible mechanistic studies and adequately powered clinical trials with standardized interventions, longer follow-up, clinically relevant skeletal outcomes, and careful assessment of safety and sources of interindividual variation.
披露
The authors declare no competing financial interests or conflicts of interest regarding this study. Artificial intelligence (AI) tool Doubao was used in modifying wording and grammatical errors of this manuscript.
致谢
This study was supported by the Natural Science Foundation of Xinjiang Uyghur Autonomous Region (2022D01C586), the Youth Innovative Scientific Project of Xinjiang Medical University (2026XYZR10), the Youth Program of the Natural Science Foundation of Xinjiang Uygur Autonomous Region (Seyida Yimamuyushan), the Youth Backbone Talent Project of the "Tianshan Talent" High-Level Medical and Health Personnel Training Program (TSYC202301B020), the Leading Scholar Program Project of the "Tianshan Talent" High-Level Medical and Health Personnel Training Program (TSYC202301A073), the Student Innovation Program of Xinjiang Medical University, and the Major Scientific Research Project Cultivation Project of Xinjiang Medical University (XYD2024ZX09). The funding sources had no role in study design, data collection, data analysis, interpretation of the results, manuscript preparation, or the decision to submit the work for publication.
材料
| 姓名 | 公司 | 目录编号 | 评论 |
|---|---|---|---|
| CiteSpace | Chaomei Chen, Drexel University, Philadelphia, PA, USA | 6.4.R1 | RRID: SCR_025121; document co-citation analysis, cluster timeline visualization, and citation-burst detection |
| VOSviewer | Centre for Science and Technology Studies, Leiden University, Leiden, Netherlands | 1.6.20 | RRID: SCR_023516; network construction and visualization |
| Web of Science Core Collection | Clarivate, Philadelphia, PA, USA | Online platform; accessed 17 September 2026 | RRID: SCR_022706; bibliographic database and cited-reference data source |
参考文献
- Walker MD, Shane E. Postmenopausal osteoporosis. N Engl J Med. 2023;389(21):1979-1991. doi:10.1056/NEJMcp2307353.
- Sozen T, Ozisik L, Basaran NC. An overview and management of osteoporosis. Eur J Rheumatol. 2017;4:46-56.
- Subarajan P, Arceo-Mendoza RM, Camacho PM. Postmenopausal osteoporosis: a review of latest guidelines. Endocrinol Metab Clin North Am. 2024;53:497-512.
- Kanis JA, Cooper C, Rizzoli R, Reginster JY. European guidance for the diagnosis and management of osteoporosis in postmenopausal women. Osteoporos Int. 2019;30(1):3-44. doi:10.1007/s00198-018-4704-5.
- Camacho PM et al. American Association of Clinical Endocrinologists/American College of Endocrinology clinical practice guidelines for the diagnosis and treatment of postmenopausal osteoporosis-2020 update. Endocr Pract. 2020;26(Suppl 1):1-46.
- Sølling AS, Langdahl BL, Cosman F. Recent advances in osteoporosis therapeutics. Annu Rev Med. 2026;77:433-448. doi:10.1146/annurev-med-050124-040555.
- Prentice RL et al. Randomized trial evaluation of the benefits and risks of menopausal hormone therapy among women 50-59 years of age. Am J Epidemiol. 2021;190(3):365-375. doi:10.1093/aje/kwaa210.
- Thursby E, Juge N. Introduction to the human gut microbiota. Biochem J. 2017;474(11):1823-1836. doi:10.1042/BCJ20160510.
- Castaneda M et al. Alterations to the gut microbiome impair bone tissue strength in aged mice. Bone Rep. 2021;14:101065. doi:10.1016/j.bonr.2021.101065.
- Zhang YW et al. Diets intervene osteoporosis via gut-bone axis. Gut Microbes. 2024;16(1):2295432. doi:10.1080/19490976.2023.2295432.
- Indrio F, Salatto A. Gut microbiota-bone axis. Ann Nutr Metab. 2025;81(Suppl 1):47-56.
- Hill C et al. Expert consensus document: The International Scientific Association for Probiotics and Prebiotics consensus statement on the scope and appropriate use of the term probiotic. Nat Rev Gastroenterol Hepatol. 2014;11:506-514.
- Abrams SA et al. A combination of prebiotic short- and long-chain inulin-type fructans enhances calcium absorption and bone mineralization in young adolescents. Am J Clin Nutr. 2005;82(2):471-476. doi:10.1093/ajcn/82.2.471.
- Scholz-Ahrens KE et al. Prebiotics, probiotics, and synbiotics affect mineral absorption, bone mineral content, and bone structure. J Nutr. 2007;137(3 Suppl 2):838S-846S. doi:10.1093/jn/137.3.838S.
- Legette LL et al. Genistein, a phytoestrogen, improves total cholesterol, and Synergy, a prebiotic, improves calcium utilization, but there were no synergistic effects. Menopause. 2011;18(8):923-931. doi:10.1097/gme.0b013e3182116e81.
- Shim KS et al. Lactobacillus fermentation enhances the inhibitory effect of Hwangryun-haedok-tang in an ovariectomy-induced bone loss. BMC Complement Altern Med. 2013;13:106. doi:10.1186/1472-6882-13-106.
- Li JY et al. Sex steroid deficiency-associated bone loss is microbiota dependent and prevented by probiotics. J Clin Invest. 2016;126(6):2049-2063. doi:10.1172/JCI86062.
- Sapra L et al. Lactobacillus rhamnosus attenuates bone loss and maintains bone health by skewing Treg-Th17 cell balance in Ovx mice. Sci Rep. 2021;11:1807. doi:10.1038/s41598-020-80536-2.
- Guo M et al. Lactobacillus rhamnosus GG ameliorates osteoporosis in ovariectomized rats by regulating the Th17/Treg balance and gut microbiota structure. Gut Microbes. 2023;15:2190304. doi:10.1080/19490976.2023.2190304.
- Li J et al. The role of gut microbiota in bone homeostasis. Bone Joint Res. 2021;10(1):51-59. doi:10.1302/2046-3758.101.BJR-2020-0273.R1.
- Lucas S et al. Short-chain fatty acids regulate systemic bone mass and protect from pathological bone loss. Nat Commun. 2018;9:55. doi:10.1038/s41467-017-02490-4.
- Park SG et al. The microbial metabolite imidazole propionate dysregulates bone homeostasis by inhibiting AMP-activated protein kinase (AMPK) signaling. Commun Biol. 2024;7(1):1644. doi:10.1038/s42003-024-07316-w.
- Gregori G et al. Limosilactobacillus reuteri 6475 and prevention of early postmenopausal bone loss: a randomized clinical trial. JAMA Netw Open. 2024;7(6):e2415455. doi:10.1001/jamanetworkopen.2024.15455.
- Jansson PA et al. Probiotic treatment using a mix of three Lactobacillus strains for lumbar spine bone loss in postmenopausal women: a randomised, double-blind, placebo-controlled, multicentre trial. Lancet Rheumatol. 2019;1(3):e154-e162. doi:10.1016/S2665-9913(19)30068-2.
- Zhang Z et al. Association between gut microbiota and bone metabolism: insights from bibliometric analysis. Front Physiol. 2023;14:1156279. doi:10.3389/fphys.2023.1156279.
- Luo ZQ et al. A decade of insight: bibliometric analysis of gut microbiota's role in osteoporosis (2014-2024). Front Med (Lausanne). 2024;11:1409534. doi:10.3389/fmed.2024.1409534.
- Harahap IA, Suliburska J. Can probiotics decrease the risk of postmenopausal osteoporosis in women? PharmaNutrition. 2023;24:100336. doi:10.1016/j.phanu.2023.100336.
- Donthu N et al. How to conduct a bibliometric analysis: an overview and guidelines. J Bus Res. 2021;133:285-296. doi:10.1016/j.jbusres.2021.04.070.
- van Eck NJ, Waltman L. Software survey: VOSviewer, a computer program for bibliometric mapping. Scientometrics. 2010;84(2):523-538. doi:10.1007/s11192-009-0146-3.
- Chen C. CiteSpace II: Detecting and visualizing emerging trends and transient patterns in scientific literature. J Am Soc Inf Sci Technol. 2006;57(3):359-377. doi:10.1002/asi.20317.
- Xu W et al. A novel approach for assessing osteoporosis utilizing DXA, HU and VBQ. Biomedical Technology. 2024;5:102-108.