This study employs bibliometric methods to systematically map the research hotspots, intellectual structure, and emerging frontiers of acupuncture for stroke, providing an objective, data-driven scientific landscape for researchers, clinicians, and policymakers.
研究文章
Scientific Frontiers and Emerging Themes in Acupuncture for Stroke: A Bibliometric Analysis
本文内容
摘要
摘要
Stroke is a leading cause of death and long-term disability worldwide, and acupuncture is widely used as a complementary therapy in stroke rehabilitation. However, the rapidly expanding and heterogeneous literature lacks systematic knowledge structure analysis and identification of emerging frontiers. This study retrieved publications related to acupuncture for stroke from the Web of Science Core Collection published from January 1, 2016, to December 31, 2025, and applied bibliometric tools including CiteSpace, VOSviewer, and Scimago Graphica to visualize publication output, collaboration networks (countries, institutions, authors), co-citation patterns, journal dual-map overlays, and keyword bursts, with the aim of delineating research hotspots and developmental trends. The results show a steady increase in annual publication output, with China, the United States, and South Korea being the most productive countries. Core research teams have been established, but cross-regional cooperation still requires strengthening. Co-citation analysis revealed classic clusters focusing on neuroplasticity, inflammatory regulation, and mechanisms of electroacupuncture. Keyword burst detection indicates that early studies centered on motor recovery and acupuncture techniques, whereas recent frontiers have shifted towards “neuroprotection”, “oxidative stress”, “default mode network”, and “neurorehabilitation guidelines”. Research hotspots are shifting from purely evaluating clinical efficacy toward multimodal mechanistic exploration and integration with evidence-based recommendations. In conclusion, the field of acupuncture for stroke is in a phase of rapid development, with the research focus shifting from basic efficacy validation to deeper mechanistic understanding and interdisciplinary integration. The knowledge maps provided in this study can help researchers quickly identify frontiers and inform future clinical trial design and guideline development.
引言
Stroke, also known as cerebrovascular accident (CVA), is one of the leading causes of death and long-term disability worldwide, imposing a heavy burden on healthcare systems and society1,2. Although advances in acute reperfusion therapies and post-stroke rehabilitation have improved outcomes, many survivors continue to experience motor dysfunction, aphasia, depression, and other post-stroke complications3,4. Acupuncture, a core component of traditional Chinese medicine, has been widely used as an adjunctive therapy for stroke in East Asia and increasingly in Western countries5,6. Numerous clinical trials and systematic reviews have suggested that acupuncture may promote neurological recovery, reduce spasticity, and improve quality of life for stroke patients7,8,9. However, the existing literature is vast, heterogeneous, and rapidly expanding, making it challenging for researchers and clinicians to systematically comprehend the overall landscape, research hotspots, and evolving frontiers of this field10.
Bibliometric analysis, a quantitative method for evaluating scientific publications, offers a powerful tool for mapping the knowledge structure, identifying influential contributors, and detecting emerging trends within a research domain11,12. Unlike traditional narrative reviews, bibliometric approaches rely on large-scale data and objective algorithms, thereby providing a comprehensive and reproducible overview of a given field13,14. In the context of acupuncture for stroke, although many original studies and reviews have been published, a systematic bibliometric analysis that specifically focuses on the scientific frontiers and emerging themes is still lacking15,16. Previous bibliometric studies in this field were largely limited to general collaboration patterns and keyword distributions, using single- or dual-tool approaches, with data coverage ending before 202317. In contrast, this study provides a more comprehensive and updated analysis by extending the coverage to 2025, incorporating Scimago Graphica for enhanced visualization, performing reference co-citation cluster analysis to delineate thematic domains, and integrating citation burst detection to track dynamic shifts in research frontiers. Therefore, this study aims to conduct a bibliometric analysis of publications related to acupuncture for stroke indexed in the Web of Science Core Collection. By visualizing publication output, collaboration networks, co-citation patterns, and keyword bursts, the study seeks to uncover the intellectual landscape, research hotspots, and future directions in this field, offering valuable insights for researchers, clinicians, and policymakers.
方案
Ethical approval was not required for this study, as it is a bibliometric analysis based solely on publicly available published literature and does not involve human subjects, animal experiments, or confidential personal data.
Data source and search strategy
The data for this bibliometric analysis were retrieved from the Web of Science Core Collection (WoSCC) on May 2, 2026. To ensure currency and relevance, the search was restricted to publications from the past decade, covering the period from January 1, 2016, to December 31, 2025. The search strategy was designed using topic (TS) field searches, combining terms related to acupuncture and stroke. The complete search string was TS = (“acupuncture” OR “electroacupuncture” OR “auricular acupuncture” OR “acupuncture therapy”) AND TS = (“stroke” OR “cerebrovascular accident” OR “CVA” OR “brain ischemia” OR “cerebral infarction” OR “intracranial hemorrhages”). The two sets of terms were combined with the Boolean operator ‘AND’. The complete search strategy, including all terms, Boolean operators, filters, and the retrieval date, is listed in Supplementary Table 1.
Inclusion and exclusion criteria
To obtain a high-quality and representative dataset for analysis, predefined inclusion and exclusion criteria were applied. Studies were included if they were original articles or review articles published in English. Non-English publications were excluded to maintain consistency in metadata and text-based bibliometric analyses; this restriction may introduce language bias and is acknowledged as a study limitation. Document types such as meeting abstracts, editorials, letters, book chapters, and retracted publications were excluded because they often lack complete metadata or have not undergone peer review. No further restrictions based on study design, sample size, or specific outcomes were imposed to ensure comprehensive coverage of the field.
Literature screening and final dataset
The initial search yielded 1,419 records. Document type filters were then applied manually, restricting to “Article” and “Review Article” only. After applying the document type filter, a total of 1,356 records remained. Subsequent restriction to English-language publications resulted in 1,344 eligible records (Supplementary Figure 1). Among these, 961 were original articles, and 383 were review articles. The complete records, including titles, abstracts, keywords, authors, affiliations, cited references, and publication years, were exported in plain-text format with full records and cited references for further analysis. All screening and data extraction steps were performed independently by two reviewers, who then cross-checked each other’s results to ensure data accuracy.
Bibliometric analysis tools and parameters
Quantitative and visual analyses were conducted using three widely adopted bibliometric tools: CiteSpace, VOSviewer, and Scimago Graphica18,19 (see Table of Materials). In CiteSpace, the time slice was set to one year, and the selection criterion was based on the g-index (k = 10). This setting balances coverage and citation impact, and is widely used in CiteSpace-based bibliometric studies. Pathfinder network scaling was used to prune merged networks for clarity. VOSviewer was employed to construct and visualize co-authorship, co-occurrence, and co-citation networks, using full counting with a minimum threshold of 5 for keywords and cited references, 3 for authors, 2 for countries and institutions, and 5 for journals. All networks used the same full-counting method; different thresholds were applied for different node types. Thresholds of 3, 5, and 8 were tested; 5 was selected as it retained sufficient nodes for meaningful clustering while avoiding an overly dense network. Scimago Graphica was used to generate country- and regional-collaboration maps and journal dual-map overlays, helping reveal geographical distribution and cross-disciplinary knowledge flows.
Analysis indicators
To map the intellectual landscape and identify emerging trends in acupuncture for stroke research, the following indicators were examined: (1) annual publication output and growth trends; (2) contributions of countries, institutions, and authors, including the number of publications and citation counts; (3) co-authorship networks to reveal collaborative patterns at national and institutional levels; (4) co-citation analysis of cited journals, cited references, and cited authors to identify influential works and classic literature; (5) keyword co-occurrence analysis and burst detection to capture research hotspots and emerging frontiers; and (6) cluster analysis of co-cited references to delineate major thematic domains and their temporal evolution.
结果
Annual publication output
Between 2016 and 2025, the annual publication output and total citation count in the field of acupuncture for stroke showed a steady overall increase (Figure 1). Annual citation counts represent citations received per calendar year for publications from that year, not cumulative citations. The publication output can be divided into three phases. From 2016 to 2019, the number of publications continued to grow, but at a relatively slow pace. In 2020, the annual output exceeded 100 papers for the first time, followed by a period of faster growth between 2020 and 2022. A decline was observed in 2023, followed by a strong recovery in publication numbers. Total citation counts increased steadily over the period, rising from 23 citations for papers published in 2016 to 4,651 for those published in 2025, suggesting a continuous expansion of academic influence in this field.
Country/Regional distribution and collaboration analysis
Table 1 presents the top 10 countries by publication output in the field of acupuncture for stroke, along with their citation indicators. China ranked first with 1,204 publications and 15,732 total citations, reflecting a clear lead in research volume. However, China’s average citations per paper were 13, lower than those of the United States (20), the United Kingdom (45), Germany (40), and Italy (41), indicating that despite its large output, China’s research influence still has room for improvement. The United States ranked second with 82 publications and a total link strength of 77, second only to China’s 146, suggesting that the US plays a key role in international collaboration networks. South Korea ranked third with 62 publications but had a total link strength of only 9. The United Kingdom and Australia tied for fourth place with 20 publications each, but the UK had a notably high average of 45 citations per paper, highlighting its strength in producing high-impact research. Overall, Asian countries lead in publication volume, while European and North American countries show advantages in average citation impact and breadth of collaboration.
Figure 2A illustrates the collaboration network and cluster structure among countries. Four main research clusters were identified. The first cluster consists of European and Middle Eastern countries, including Germany, the United Kingdom, Italy, France, Switzerland, Austria, Greece, Iran, and Israel, which exhibit dense intra-regional collaboration. Among them, the United Kingdom, Germany, and Italy have relatively high total link strengths, forming the core of the European collaboration network. The second cluster is dominated by China and includes other Asia-Pacific and some European countries, such as South Korea, Japan, Australia, India, Singapore, Malaysia, Thailand, Norway, and Denmark. China’s publication volume and total link strength in this cluster far exceed those of other members, but its collaboration intensity with neighboring countries such as South Korea and Japan remains limited. The third cluster consists of Canada and South Africa, indicating that these two countries have relatively dispersed collaboration with other regions. The fourth cluster contains only the United States, reflecting its unique position in the field: despite a lower publication output than China, its collaboration network is extensive, serving as a hub for cross-regional cooperation.
Figure 2B presents the intensity of collaboration flows among major countries using a chord diagram. The link between China and the United States is the most prominent, reflecting close cooperation between the two largest producers. Within Europe, for example, a dense collaboration ring is formed among the United Kingdom, Germany, Italy, and Austria. The link between China and South Korea is relatively weak, but South Korea has some connections with Japan and Australia. Although Canada shares a cluster with South Africa, its collaboration with the United States is more pronounced. Overall, the global collaboration pattern in this field can be characterized as a “China-US dual-core driven, Europe multilateral close collaboration, and Asia-Pacific sub-center” structure.
Figure 2C shows the trends in publication output of major countries over the past decade. China, the United States, South Korea, the United Kingdom, and Australia all exhibited upward trends, with China showing the steepest increase. The United States maintained a high and stable level, while South Korea and the United Kingdom also demonstrated steady growth. After 2023, the trend curves of all countries converged toward higher values, reflecting a globally increasing focus on acupuncture research for stroke.
Institutional distribution and collaboration analysis
The top 10 institutions by publication output in the field of acupuncture for stroke, along with their respective countries, are shown in Figure 3A. All ten institutions are from China. Tianjin University of Traditional Chinese Medicine ranked first with 108 publications, closely followed by Guangzhou University of Chinese Medicine with 107 publications, and Beijing University of Chinese Medicine ranked third with 103 publications. Shanghai University of Traditional Chinese Medicine, Fujian University of Traditional Chinese Medicine, Heilongjiang University of Chinese Medicine, Chengdu University of Traditional Chinese Medicine, Zhejiang Chinese Medical University, China Medical University, and Nanjing University of Chinese Medicine successively entered the top ten. Figure 3B presents the top ten institutions by citation count and their countries of affiliation, which are all Chinese institutions. Beijing University of Chinese Medicine topped the list with 1,870 citations, followed by Guangzhou University of Chinese Medicine with 1,459 citations and Fujian University of Traditional Chinese Medicine with 1,222 citations. China Medical University, Tianjin University of Traditional Chinese Medicine, China Medical University Hospital, Shanghai University of Traditional Chinese Medicine, Capital Medical University, China Academy of Chinese Medical Sciences, and Sichuan University also entered the top ten. Together, Figures 3A,B indicate that Chinese institutions occupy a dominant position in acupuncture for stroke research, leading in both publication volume and citation impact.
Figure 3C illustrates the collaboration network and cluster structure among institutions. A total of 37 institutions were included in the analysis, forming six main research clusters. The first cluster consists of Changchun University of Chinese Medicine, Fudan University, Huazhong University of Science and Technology, Hubei University of Chinese Medicine, Nanjing Medical University, Nanjing University of Chinese Medicine, Shanghai University of Traditional Chinese Medicine, Wenzhou Medical University, Zhejiang Chinese Medical University, and Zhejiang University. These institutions are mainly located in East and Central China. The second cluster includes Anhui University of Chinese Medicine, Chinese Academy of Sciences, Fujian University of Traditional Chinese Medicine, Guangdong Provincial Hospital of Chinese Medicine, Guangzhou University of Chinese Medicine, Henan University of Chinese Medicine, Hunan University of Chinese Medicine, Southern Medical University, and Zhengzhou University, primarily based in South and Central China. The third cluster consists of Beijing University of Chinese Medicine, Capital Medical University, China Academy of Chinese Medical Sciences, Peking University, Shandong University, and Shandong University of Traditional Chinese Medicine, concentrated in Beijing and Shandong Province. The fourth cluster covers Hebei Medical University, Heilongjiang University of Chinese Medicine, National Clinical Research Center for Chinese Medicine Acupuncture and Moxibustion, Tianjin University of Traditional Chinese Medicine, University of Hong Kong, and Yunnan University of Traditional Chinese Medicine, with a relatively wide geographic distribution. The fifth cluster includes China Medical University, China Medical University Hospital, and Kyung Hee University from South Korea, which is the only cluster containing an international institution, indicating a specific collaborative link between China Medical University and Kyung Hee University. The sixth cluster consists of Chengdu University of Traditional Chinese Medicine, Hospital of Chengdu University of Traditional Chinese Medicine, and Sichuan University, located in Southwest China. Overall, Chinese institutions have formed multiple regional and tightly knit internal collaboration networks, while international collaboration is mainly concentrated between China Medical University and Kyung Hee University.
Journal distribution and collaboration analysis
The top 10 journals by publication output and their impact factors are shown in Figure 4A. The most productive journals in the field of acupuncture for stroke are Medicine and Frontiers in Neurology, whose publication volumes are significantly higher than those of the other journals. It is worth noting that the journals with the highest publication output do not necessarily have high impact factors, while journals with relatively high impact factors, such as Neural Regeneration Research, have lower publication counts, indicating that productivity is not entirely consistent with high impact.
The top 10 journals by citation count and their Journal Citation Reports (JCR) quartiles are presented in Figure 4B. Frontiers in Neurology and Evidence‑Based Complementary and Alternative Medicine are the two most cited journals. In terms of JCR quartiles, Neural Regeneration Research, Cochrane Database of Systematic Reviews, and BMC Complementary and Alternative Medicine are in Q1, while the remaining journals are mostly in Q2.
The journal collaboration network and cluster structure are shown in Figure 4C. A total of 45 journals were included in the analysis, forming five main research clusters. The first cluster is dominated by neuroscience‑oriented journals, covering brain research, neural regeneration, molecular neurobiology, and related areas. The second cluster focuses on complementary and alternative medicine and pain research, including various integrative medicine and acupuncture‑related journals. The third cluster centers on acupuncture medicine, traditional Chinese medicine, and neuropsychiatric disorders. The fourth cluster is themed around clinical neuroscience, pharmacology, and rehabilitation medicine. The fifth cluster concentrates on systematic reviews and integrative medicine. Overall, journals in the field of acupuncture for stroke exhibit a clear disciplinary differentiation, with neuroscience, complementary and alternative medicine, and clinical general medicine journals forming close collaborative clusters, reflecting the multidisciplinary nature of this research field.
Author distribution and collaboration analysis
The top 10 authors by publication output and their country affiliations are shown in Figure 5A. All ten authors are from China. Tao, Jing ranked first with 30 publications, followed by Chen, Lidian with 27 publications, and Liu, Weilin with 26 publications. Other authors in the top 10 include Xu, Nenggui, Du, Yuzheng, Huang, Jia, Meng, Zhihong, Zou, Yihuai, Lu, Liming, and Wang, Lin. Figure 5B presents the top ten authors by citation count and their country affiliations, which are all Chinese scholars. Tao, Jing ranked first with 954 citations, followed by Chen, Lidian with 818 citations, and Liu, Weilin with 763 citations. Lin, Jaung-Geng, Liu, Cun-Zhi, Huang, Jia, Yang, Jing-Wen, Lee, Yu-Chen, Lin, Ruhui, and Cao, Yan also entered the top ten. Taken together, Chinese scholars hold a dominant position in this field, and most highly productive authors also have high citation counts, indicating strong research continuity and impact.
The author collaboration network and cluster structure are shown in Figure 5C. A total of 70 authors were included in the analysis, forming seven main research clusters. The first cluster is centered around Tao, Jing, Chen, Lidian, and Liu, Weilin, who are also the authors with the highest publication and citation counts, constituting the core research team in this field. The second cluster includes Xu, Nenggui, Tang, Chunzhi, Wang, Lin, and others, showing strong internal collaboration. The third cluster is represented by Huang, Jia, Liang, Shengxiang, Lin, Ruhui, and others. The fourth, fifth, sixth, and seventh clusters include many active authors, such as the teams of Liu, Cun-Zhi, Zou, Yihuai, and Feng, Xiaodong. Overall, Chinese scholars have formed multiple tight-knit collaborative groups, with some cross-cluster connections among different teams. However, internationally collaborating authors such as Kwon, Seungwon, from South Korea occupy peripheral positions in the network, indicating that productivity is not entirely consistent with high impact.
Keyword analysis
The keyword co-occurrence network is shown in Figure 6A, and detailed information on high-frequency and high-betweenness-centrality keywords is presented in Table 2. In terms of frequency, “stroke” (348 times) ranked first, followed by “ischemic stroke” (230 times) and “acupuncture” (210 times) in second and third places, respectively. Notably, “electroacupuncture” also appeared as a distinct high-frequency keyword, suggesting its prominence as a specific intervention modality within the broader acupuncture research landscape. Other high-frequency keywords included “recovery”, “electroacupuncture”, “systematic review”, “activation”, “rehabilitation”, “brain”, and “expression”. In terms of betweenness centrality, “recovery” had the highest centrality value of 0.47, indicating that it serves as a critical bridge connecting different research topics. In addition, keywords such as “chinese medicine”, “complementary”, “artery occlusion”, “activation”, “exercise”, and “cerebral ischemia” also showed high centrality. Notably, “activation” appeared in both the high-frequency and high-centrality lists, which suggests that neural activation mechanisms constitute an important hub theme in this field.
Keyword clustering analysis is presented in Figure 6B, which formed 12 main clusters. Cluster #0 is “network meta-analysis”, focusing on guidelines and network meta-analysis for acute ischemic stroke. Cluster #1 is “randomized controlled trial”, addressing efficacy, cognitive impairment, and disability. Cluster #2 is “oxidative stress”, involving Alzheimer’s disease and focal cerebral ischemia. Cluster #3 is “post-stroke depression”, covering models, scalp acupuncture, and scale assessments. Cluster #4 is “clinical trial”, including Chinese medicine, reliability, risk, and disease. Cluster #5 consists only of “recovery”, indicating that rehabilitation stands as an independent research direction. Cluster #6 is “upper limb motor function”, relating to artery occlusion, expression, exercise, management, impairment, and deficits. Cluster #7 is “systematic review”, associated with brain and activation. Cluster #8 is “meta-analysis”, including complementary and alternative medicine, quality of life, quality, Nei Kuan acupoints, intradermal acupuncture, and disease burden. Cluster #9 is “electroencephalography”, focusing on motor functional connectivity. Cluster #10 is “ischemic stroke”, involving cerebral ischemia and reperfusion-injured rats. Cluster #11 is “cerebrovascular accident”, focusing on brain injury. These clusters cover multiple dimensions, including clinical research, mechanistic exploration, systematic reviews, and rehabilitation therapy, reflecting the broad range of research topics in this field.
The keyword timeline visualization is shown in Figure 6C, illustrating the temporal evolution of keywords across clusters. In the early period, research mainly focused on fundamental concepts such as “stroke”, “acupuncture”, “recovery”, and “electroacupuncture”. Between 2017 and 2018, keywords such as “cognitive impairment”, “oxidative stress”, and “systematic review” began to emerge, indicating a shift toward mechanistic investigation and evidence synthesis. After 2019, new keywords such as “network meta-analysis”, “motor function”, and “electroencephalography” appeared, reflecting a growing emphasis on high-quality evidence synthesis, functional assessment, and neurophysiological techniques. Overall, research on acupuncture for stroke has evolved from clinical observations of efficacy to mechanistic exploration, then to systematic evaluation and precision rehabilitation, with continuously refined themes and a clear multidisciplinary character.
Reference analysis
The detailed information of high-frequency cited references is presented in Table 3. The most frequently cited reference is GBD 2019 Stroke Collaborators (2021) published in Lancet Neurology, with 71 citations, followed by Chavez et al20. (2017) published in International Journal of Molecular Sciences, with 69 citations, and Zhang et al. (2021) published in Neural Plasticity, with 41 citations21,22. Other high-frequency cited references include Wu et al. (2019), Birch et al. (2022), Qin et al. (2022), Feigin et al. (2022), Zhang et al. (2015), Liu et al. (2021), and Yang et al. (2016)10,23,24,25,26,27,28. Table 4 shows the top ten references by betweenness centrality. Lin et al. (2015) ranked first with a centrality of 0.38, followed by Johnson et al. (2019) with 0.37, and Kim et al. (2014) with 0.3629,30,31. Notably, Zhang et al. (2015) and Yang et al. (2016) appeared in both the high-frequency and high-centrality lists, indicating that these two references possess both high academic influence and important knowledge-bridging roles in this field26,28.
The co-citation network of references is shown in Figure 7A. A total of 313 references were included, forming a tightly connected co-citation network with a network density of 0.0077, a modularity Q value of 0.8561, and a weighted mean silhouette S value of 0.9435, indicating significant clustering structures and high intra-cluster consistency. The largest connected component contained 298 nodes, accounting for 95% of all nodes, demonstrating a high degree of interrelatedness among the literature in this field.
The cluster analysis of co-cited references is presented in Figure 7B. A total of 18 major clusters were formed, reflecting the diversity and evolutionary directions of research topics in the field of acupuncture for stroke. For instance, Cluster #0 “scalp acupuncture” and Cluster #11 “muscle spasticity” focus on the clinical practice of acupuncture in improving post-stroke motor dysfunction, which aligns with the rising interest in non-pharmacological therapies in stroke rehabilitation. Cluster #1 “ferroptosis” and Cluster #17 “nf-kappa b signaling pathway” represent the frontiers of molecular mechanism research on acupuncture against post-stroke neural injury, with ferroptosis as an emerging form of regulated cell death becoming a hotspot in ischemic brain injury studies. Cluster #13 “post-stroke depression” and Cluster #5 “post-stroke dysphagia” address acupuncture interventions for common post-stroke complications, reflecting a shift from single-disease treatment to complication management. Cluster #7 “post-stroke cognitive impairment” and Cluster #6 “learning and memory” reveal the potential of acupuncture in post-stroke cognitive rehabilitation, echoing research on brain plasticity mechanisms. Cluster #14 “meta-analyses” and Cluster #16 “systematic review” represent the direction of evidence synthesis, reflecting the field’s pursuit of high-quality evidence-based medicine. The emergence of Cluster #3 “bibliometrics” indicates that the field itself has entered a stage of research summarization and frontier identification. Overall, these clusters cover multi-level research ranging from molecular mechanisms and clinical efficacy to evidence synthesis, illustrating the evolution of this field from empirical medicine toward evidence-based medicine and precision rehabilitation.
The top 20 references with the strongest citation bursts are shown in Figure 7C. The reference with the highest burst strength is Chavez et al. (2017) with a strength of 22.33, with a burst period from 2019 to 2022. This study systematically summarized the molecular mechanisms of acupuncture and became a key reference in mechanism research. Feigin et al. (2021) had a burst strength of 15.44, with a burst period from 2023 to 2025, indicating that recent data on the global burden of stroke have received high attention. Zhang et al. (2015) and Yang et al. (2016) also exhibited high burst strengths of 13.14 and 12.12, respectively, with earlier burst periods26,28. In terms of temporal trends, early burst references mainly focused on the molecular mechanisms of acupuncture and animal experimental studies, represented by Feng et al. (2013), Kim et al. (2013), Kim et al. (2014), and Lan et al. (2013)31,32,33,34. Subsequently, burst references gradually shifted toward clinical randomized controlled trials and systematic reviews, including the Cochrane systematic review by Yang et al. (2016), the study by Cai et al. (2017), and the American stroke rehabilitation guidelines by Winstein et al. (2016)3,28,35. Recent burst references have focused on the global burden of stroke and integrative medicine research, including the global stroke burden series by Feigin et al. (2021, 2022) and the study on integrative acupuncture medicine by Birch et al. (2022)10,25. This evolutionary process clearly reveals the dynamic shifts in research foci in the field of acupuncture for stroke: from basic mechanism exploration to clinical evidence accumulation, and then to a macro perspective of global disease burden and integrative medicine strategies.
DATA AVAILABILITY:
The raw bibliometric data have been deposited in the Science Data Bank repository and are publicly available at https://doi.org/10.57760/sciencedb.010sn.
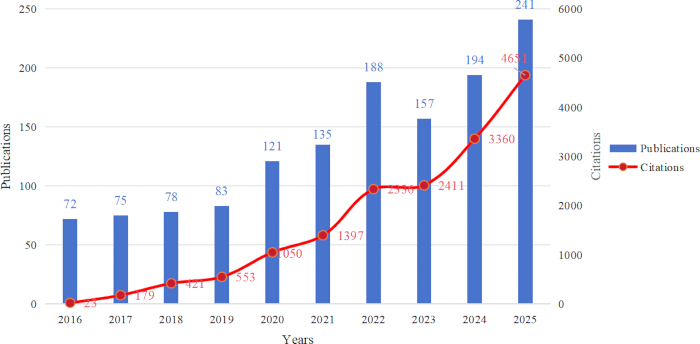
Figure 1: Annual publication output and citation trends in acupuncture for stroke research (2016–2025). The bar chart shows the number of publications per year, and the line graph shows the total citation counts of publications in each year. Citation counts are calculated as the number of citations received in each calendar year for articles published in that same year. In this figure, WoSCC refers to Web of Science Core Collection. Please click here to view a larger version of this figure.
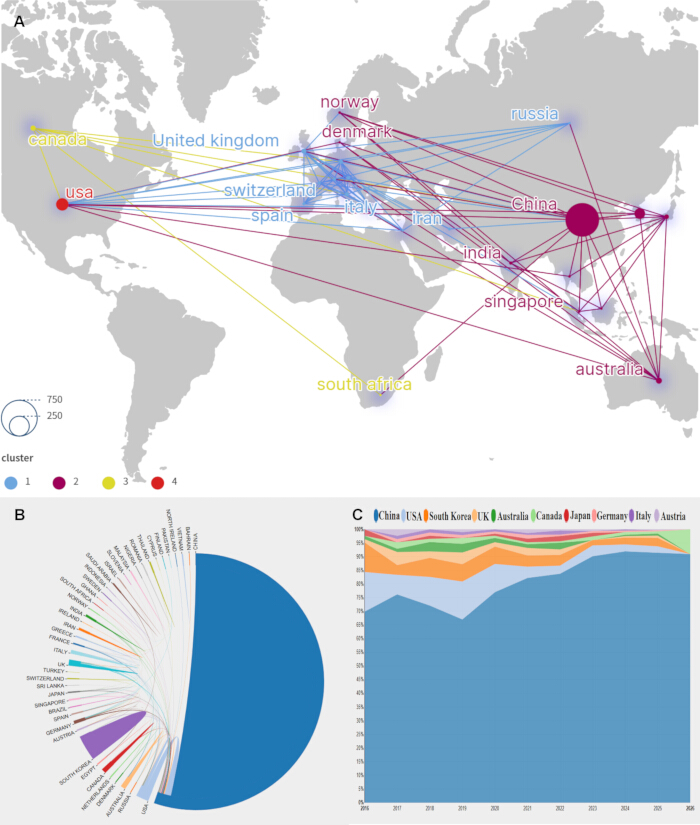
Figure 2: Country/regional distribution and collaboration analysis. (A) Collaboration network of countries/regions. (B) Major-country collaboration chord diagram. (C) Temporal trends of publication output from major countries over the past decade. In this figure, node size represents publication volume, edge thickness represents collaboration strength, and different colors indicate different clusters. Link width in the chord diagram represents the relative intensity of collaborative output, and each line in the temporal trend plot represents a country’s annual publication count. In this figure, WoSCC refers to Web of Science Core Collection. Please click here to view a larger version of this figure.
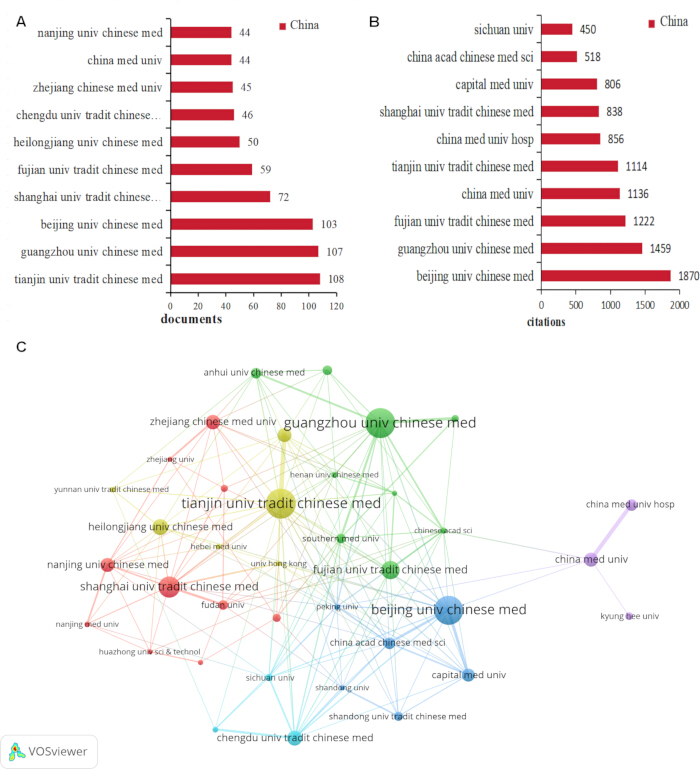
Figure 3: Institutional distribution and collaboration analysis. (A) Top ten institutions by publication output and their country affiliations. (B) Top ten institutions by citation count and their country affiliations. (C) Collaboration network of institutions. In this figure, bar length in (A) and (B) represent the number of publications or total citations, respectively. In the collaboration network (C), node size represents publication volume, edge thickness represents collaboration strength, and different colors indicate different clusters. Please click here to view a larger version of this figure.
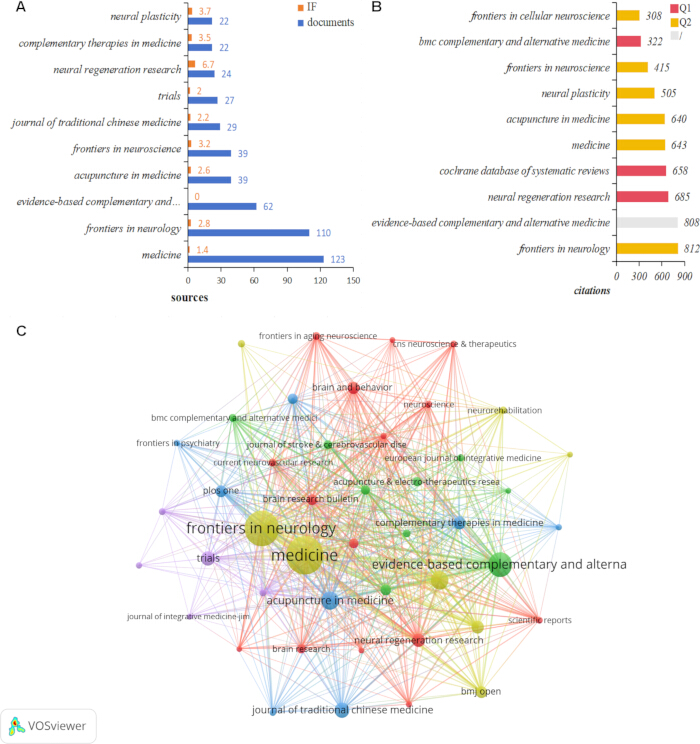
Figure 4: Journal distribution and collaboration analysis. (A) Top ten journals by publication output and their impact factors. (B) Top ten journals by citation count and their JCR quartiles. (C) Collaboration network of journals. In this figure, bar length in (A) represents the number of publications, with the values in parentheses indicating the impact factors. Bar length in (B) represents total citations, with JCR quartile categories displayed on the right. In the collaboration network (C), node size represents citation count, edge thickness represents co-citation strength, and different colors indicate different clusters. JCR data were obtained from the 2025 Journal Citation Reports (Clarivate Analytics). In this figure, JCR refers to Journal Citation Reports; IF refers to impact factor. Please click here to view a larger version of this figure.
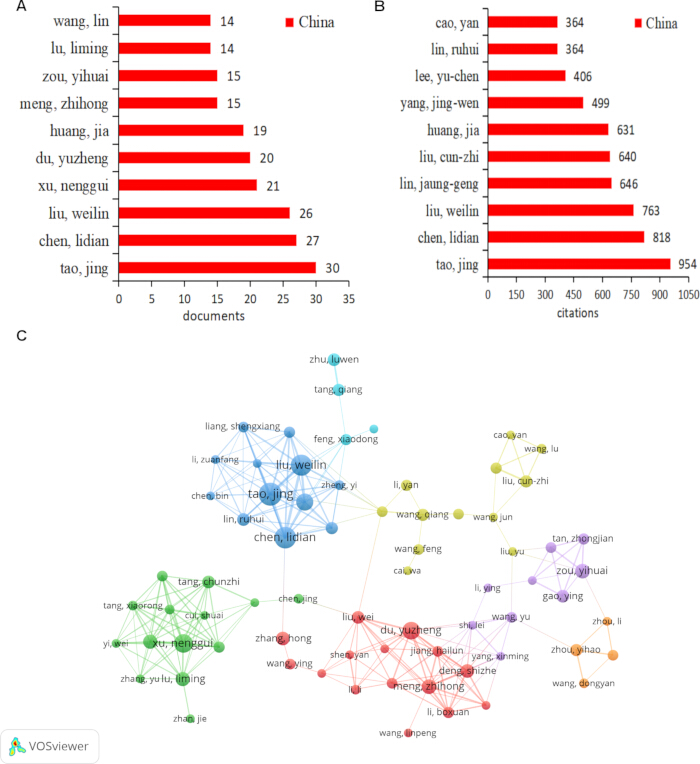
Figure 5: Author distribution and collaboration analysis. (A) Top ten authors by publication output and their country affiliations. (B) Top ten authors by citation count and their country affiliations. (C) Collaboration network of authors. In this figure, the bar length in (A) and (B) represents the number of publications or total citations, respectively. In the collaboration network (C), node size represents publication volume, edge thickness represents co-authorship strength, and different colors indicate different clusters. Please click here to view a larger version of this figure.
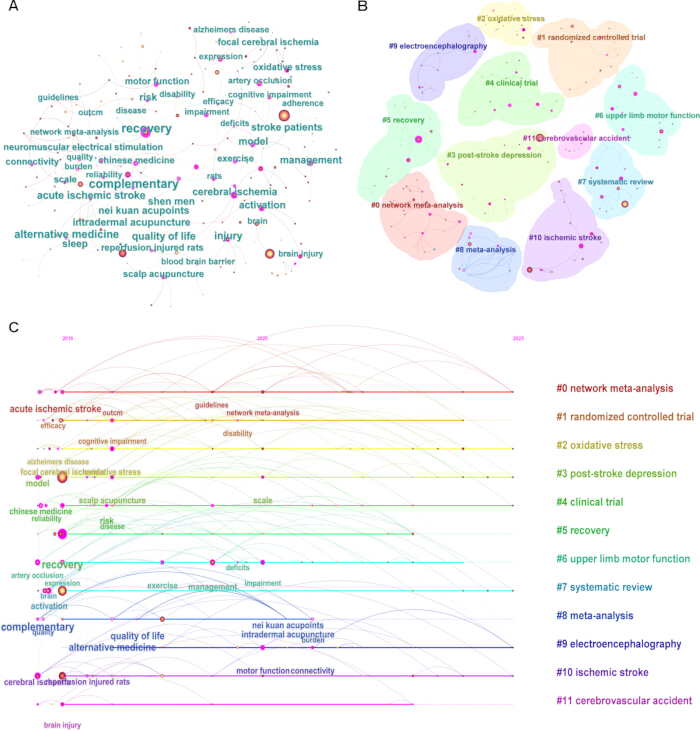
Figure 6: Keyword analysis. (A) Keyword co-occurrence network. (B) Keyword clustering analysis. (C) Keyword timeline visualization showing the temporal evolution of research topics. In this figure, node size represents keyword frequency, edge thickness represents co-occurrence strength, and different colors indicate different clusters. In the timeline visualization (C), keywords are positioned along the timeline according to their first appearance year, with node size reflecting frequency and edge thickness reflecting co-occurrence strength. Cluster labels in (B) were generated automatically by CiteSpace using the log-likelihood ratio (LLR) algorithm, with no manual modifications. Please click here to view a larger version of this figure.
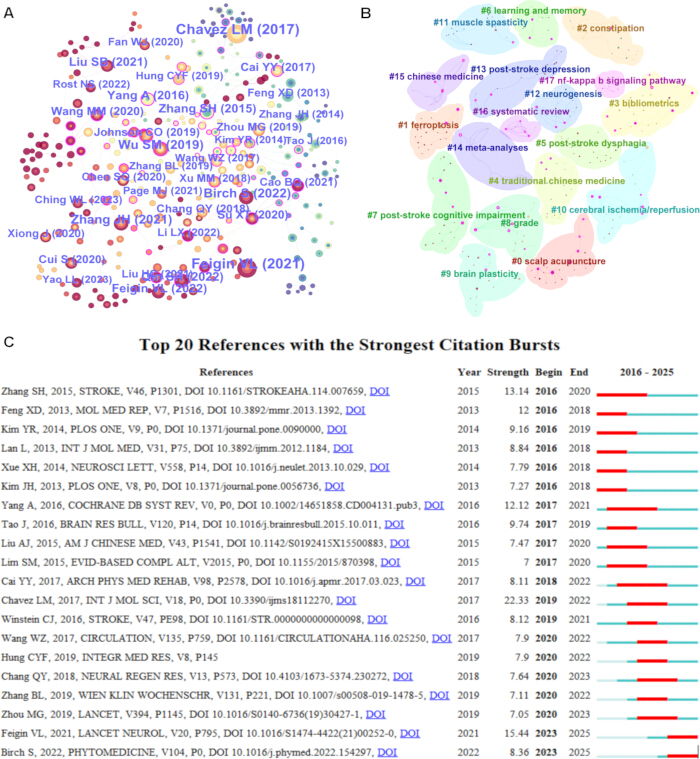
Figure 7: Reference co-citation analysis. (A) Co-citation network of references. (B) Cluster analysis of co-cited references. (C) Top 20 references with the strongest citation bursts. In this figure, node size represents citation frequency, edge thickness represents co-citation strength, and different colors indicate different clusters. In (C), the red bars indicate the burst periods of each reference. Cluster labels in (B) were generated automatically by CiteSpace using the log-likelihood ratio (LLR) algorithm, with no manual modifications. Please click here to view a larger version of this figure.
| Number | Country | Documents | Citations | Average citation per paper | Total link strength |
| 1 | China | 1204 | 15732 | 13 | 146 |
| 2 | USA | 82 | 1631 | 20 | 77 |
| 3 | South Korea | 62 | 791 | 13 | 9 |
| 4 | UK | 20 | 894 | 45 | 26 |
| 5 | Australia | 20 | 506 | 25 | 24 |
| 6 | Canada | 15 | 253 | 17 | 13 |
| 7 | Japan | 12 | 233 | 19 | 16 |
| 8 | Germany | 10 | 396 | 40 | 24 |
| 9 | Italy | 9 | 370 | 41 | 19 |
| 10 | Austria | 8 | 284 | 36 | 15 |
Table 1: Top ten countries by publication output in acupuncture for stroke research. The table includes the number of documents, total citations, average citations per paper, and total link strength for each country.
| Number | Keywords | Count | Keywords | Centrality |
| 1 | stroke | 348 | recovery | 0.47 |
| 2 | ischemic stroke | 230 | chinese medicine | 0.37 |
| 3 | acupuncture | 210 | complementary | 0.33 |
| 4 | recovery | 137 | artery occlusion | 0.3 |
| 5 | electroacupuncture | 129 | activation | 0.29 |
| 6 | systematic review | 111 | exercise | 0.29 |
| 7 | activation | 101 | cerebral ischemia | 0.27 |
| 8 | rehabilitation | 98 | cerebral infarction | 0.26 |
| 9 | brain | 94 | motor function | 0.26 |
| 10 | expression | 93 | impairment | 0.26 |
Table 2: Top ten keywords by frequency and by betweenness centrality. The left panel shows the most frequent keywords, and the right panel shows keywords with the highest betweenness centrality.
| Number | Count | Cited References |
| 1 | 71 | Feigin VL, 2021, LANCET NEUROL, V20, P795, DOI 10.1016/S1474-4422(21)00252-0 |
| 2 | 69 | Chavez LM, 2017, INT J MOL SCI, V18, P0, DOI 10.3390/ijms18112270 |
| 3 | 41 | Zhang JH, 2021, NEURAL PLAST, V2021, P0, DOI 10.1155/2021/2662585 |
| 4 | 40 | Wu SM, 2019, LANCET NEUROL, V18, P394, DOI 10.1016/S1474-4422(18)30500-3 |
| 5 | 39 | Birch S, 2022, PHYTOMEDICINE, V104, P0, DOI 10.1016/j.phymed.2022.154297 |
| 6 | 35 | Qin SR, 2022, FRONT CELL NEUROSCI, V16, P0, DOI 10.3389/fncel.2022.817732 |
| 7 | 32 | Feigin VL, 2022, INT J STROKE, V17, P18, DOI 10.1177/17474930211065917 |
| 8 | 32 | Zhang SH, 2015, STROKE, V46, P1301, DOI 10.1161/STROKEAHA.114.007659 |
| 9 | 31 | Liu SB, 2021, NATURE, V598, P641, DOI 10.1038/s41586-021-04001-4 |
| 10 | 31 | Yang A, 2016, COCHRANE DB SYST REV, V0, P0, DOI 10.1002/14651858.CD004131.pub3 |
Table 3: Top ten most frequently cited references in acupuncture for stroke research. The table lists the cited references and their citation counts.
| Number | Centrality | Cited References |
| 1 | 0.38 | Lin RH, 2015, MOL MED REP, V12, P6807, DOI 10.3892/mmr.2015.4321 |
| 2 | 0.37 | Johnson CO, 2019, LANCET NEUROL, V18, P439, DOI 10.1016/S1474-4422(19)30034-1 |
| 3 | 0.36 | Kim YR, 2014, PLOS ONE, V9, P0, DOI 10.1371/journal.pone.0090000 |
| 4 | 0.35 | Zhang SH, 2015, STROKE, V46, P1301, DOI 10.1161/STROKEAHA.114.007659 |
| 5 | 0.34 | Yang NN, 2022, CURR NEUROPHARMACOL, V20, P738, DOI 10.2174/1570159X19666210609162809 |
| 6 | 0.31 | Wang MM, 2020, FRONT CELL NEUROSCI, V14, P0, DOI 10.3389/fncel.2020.00134 |
| 7 | 0.31 | Chen LF, 2016, BMC COMPLEM ALTERN M, V16, P0, DOI 10.1186/s12906-016-1193-y |
| 8 | 0.3 | Wu SM, 2019, LANCET NEUROL, V18, P394, DOI 10.1016/S1474-4422(18)30500-3 |
| 9 | 0.29 | Yang A, 2016, COCHRANE DB SYST REV, V0, P0, DOI 10.1002/14651858.CD004131.pub3 |
| 10 | 0.27 | Chen LY, 2019, J AFFECT DISORDERS, V250, P298, DOI 10.1016/j.jad.2019.03.020 |
Table 4: Top ten references by betweenness centrality in acupuncture for stroke research. The table lists the cited references and their betweenness centrality values.
Supplementary Figure 1: Overall study workflow of bibliometric analysis. The schematic illustrates the process of literature search, screening, data extraction, and bibliometric analysis using CiteSpace, VOSviewer, and Scimago Graphica. WoSCC, Web of Science Core Collection.Please click here to download this file.
Supplementary Table 1: Complete Web of Science Core Collection search strategy. The table provides the complete topic-search terms, Boolean operators, publication-date limits, document-type and language filters, database/index settings, and retrieval date used to identify publications included in the bibliometric analysis.Please click here to download this file.
讨论
This study performed a systematic bibliometric analysis of the literature on acupuncture for stroke indexed in the Web of Science Core Collection between 2016 and 2025, offering an updated comprehensive depiction of the knowledge landscape from the perspective of scientific frontiers and emerging themes. The results show that over the past decade, both annual publication output and total citation counts have steadily increased, with a noticeable acceleration after 2020, which may reflect continuously growing academic attention and a trend of increasing influence in this field. At the country level, China ranks first globally with 1,204 publications and 15,732 total citations, reflecting a clear lead in research volume. However, China’s average citations per paper are lower than those of the United States, the United Kingdom, and Germany, suggesting that its research impact still has room for improvement. Institution and author analyses reveal that the top ten most productive and most cited institutions and authors are all from China, forming multiple regional and tightly knit collaborative networks centered around Tianjin University of Traditional Chinese Medicine, Guangzhou University of Chinese Medicine, Beijing University of Chinese Medicine and others. International collaboration, in contrast, remains limited, with only a stable link between China Medical University and Kyung Hee University in South Korea. These findings suggest that China is the most productive country in this field, with research primarily conducted within domestic networks and limited international collaboration.
Keyword co-occurrence and cluster analyses reveal the diversity and dynamic evolution of research topics in the field of acupuncture for stroke. Looking at high-frequency keywords, “ischemic stroke”, “recovery”, “electroacupuncture”, “systematic review”, “rehabilitation”, “brain” and “expression” rank among the top, indicating that clinical rehabilitation efficacy and molecular mechanism exploration are the two main research threads. Notably, “activation” appears in both the high-frequency and high-centrality lists, suggesting that neural activation mechanisms serve as a key hub connecting different research themes. The keyword timeline visualization shows that in the early period (2016–2017), research mainly focused on fundamental concepts such as “stroke”, “acupuncture”, “recovery” and “electroacupuncture”. Between 2018 and 2019, keywords such as “cognitive impairment”, “oxidative stress” and “systematic review” began to emerge, which may reflect a shift from simple efficacy observation to mechanistic investigation and evidence synthesis. After 2020, new keywords such as “network meta-analysis”, “motor function” and “electroencephalography” appeared, reflecting a growing emphasis on high-quality evidence synthesis, objective functional assessment and neurophysiological techniques. This evolutionary trajectory is further supported by the keyword clusters identified in the analysis. Clusters such as “oxidative stress”, “ferroptosis”, and “NF-κB signaling” (nuclear factor kappa-light-chain-enhancer of activated B cells) indicate a deepening focus on molecular and cellular mechanisms. Meanwhile, clusters like “post-stroke depression” and “upper limb motor function” reflect the ongoing emphasis on symptomatic rehabilitation, whereas “electroencephalography” points to emerging interest in network-level brain activity and functional connectivity. Together, these clusters illustrate a clear progression from purely clinical efficacy observation to mechanism-driven research, and ultimately to multimodal rehabilitation strategies that integrate symptomatic management with network-level and neuroplasticity-based approaches. This evolutionary trajectory suggests a shift in research emphasis from empirical medicine towards evidence-based medicine and precision rehabilitation.
The cluster analysis of co-cited references yielded 18 major clusters, covering a wide range of topics such as scalp acupuncture, muscle spasticity, ferroptosis, the NF-κB signaling pathway, post-stroke depression, post-stroke dysphagia, cognitive impairment, learning and memory, meta-analyses, and systematic reviews. These clusters fully reflect the multi-level research landscape in this field, ranging from molecular mechanisms to clinical efficacy and evidence synthesis. Among them, Cluster #1, “ferroptosis”, and Cluster #17, “NF-κB signaling pathway”, represent the frontiers of molecular mechanism research, consistent with the growing number of studies examining how acupuncture regulates programmed cell death and inflammatory responses. The citation burst analysis further reveals the dynamic process of knowledge evolution. Early burst references were mainly animal experiments and molecular mechanism studies. Mid-period burst references gradually shifted towards clinical randomised controlled trials and systematic reviews, including the Cochrane systematic review by Yang et al. (2016), the study by Cai et al. (2017), and the AHA stroke rehabilitation guidelines by Winstein et al. (2016). Recent burst references have focused on the global burden of stroke and integrative medicine strategies. This evolutionary chain validates a three-stage paradigm shift in the field: from “mechanism exploration” to “evidence accumulation” and then to “macro-level strategy”.
Although this study employed three mainstream bibliometric tools and followed a systematic screening process, several limitations should be acknowledged. First, the data source was limited to the Web of Science Core Collection, thereby excluding other databases such as PubMed, Scopus, and the China National Knowledge Infrastructure. Consequently, regionally influential Chinese-language papers may have been omitted, which could lead to an underestimation of domestic research output. Second, only English articles and review articles were included, which may have excluded high-quality conference proceedings, clinical case reports, and important non-English studies, thereby introducing language bias. Third, original articles and reviews were analyzed together in this study. Since reviews tend to accumulate citations more rapidly and have a higher average citation count than original research, citation-based metrics such as total citations and average citations per paper may be partially influenced by the proportion of reviews included in the dataset. However, this mixed-document approach is widely adopted in bibliometric studies to provide a comprehensive overview of the field, and we believe it does not compromise the main conclusions of this study33. Fourth, although the keyword co-occurrence and clustering algorithms are objective, the interpretation of cluster labels inevitably involves subjectivity, and different parameter settings may affect the network structure. These limitations should be considered when interpreting the findings. Additionally, it should be recognized that bibliometric analysis reflects the structure and visibility of research activity rather than directly measuring methodological quality, clinical effectiveness, or patient benefit—a distinction that is particularly pertinent for clinically oriented topics such as stroke. In addition, it is important to distinguish the translational readiness of the emerging themes identified in this study. Among the mechanistic clusters, “oxidative stress”, “ferroptosis”, and “NF-κB signaling” remain predominantly supported by preclinical studies, such as animal models and in vitro experiments, highlighting a significant translational gap to clinical application34,36,37. In contrast, themes such as “functional connectivity” and “electroencephalography” have been increasingly investigated in human neuroimaging studies, while “post-stroke depression”, “upper limb motor function”, and “rehabilitation” are directly grounded in clinical research. This distinction underscores the need for cautious interpretation when translating mechanistic findings into clinical practice.
Based on the above findings, future research on acupuncture for stroke can be advanced in several directions. First, future research should strengthen the synthesis of high-quality evidence. The prominence of “systematic review”, “meta-analysis”, and “network meta-analysis” clusters supports this direction. Although numerous systematic reviews and meta-analyses exist, the quality of the primary studies included is often inconsistent. Future efforts should focus on more rigorously designed, adequately powered, well-registered multicentre randomized controlled trials, reported in accordance with Consolidated Standards of Reporting Trials (CONSORT) and STandards for Reporting Interventions in Clinical Trials of Acupuncture (STRICTA) guidelines, to enhance the reliability of the evidence38. Second, future research should deepen cross-disciplinary research on mechanisms and neuroplasticity. This direction is supported by mechanistic clusters, including “ferroptosis”, “NF-κB signaling pathway”, and “oxidative stress” identified in the analysis. Current studies on acupuncture-regulated ferroptosis, neuroinflammation, and brain network remodeling are mostly confined to animal experiments. Future work should combine neuroimaging techniques, including functional magnetic resonance imaging, electroencephalography, and positron emission tomography, to validate the effects of acupuncture on brain functional connectivity and neuroplasticity at the human level39,40. Third, international collaboration and standardization should be promoted. This recommendation stems from the finding that China is the most productive country while international collaborative networks remain relatively sparse. While China plays a leading role in this field, the international collaborative network remains sparse. Future initiatives should actively establish cross-national multicentre research platforms and promote the standardization of acupuncture protocols covering stimulation parameters, acupoint selection, and treatment courses, thereby improving the generalizability and comparability of research findings41,42. Fourth, future work should focus on comprehensive management of post-stroke complications. This direction is supported by independent keyword clusters related to post-stroke depression, dysphagia, and cognitive impairment. As shown by the clustering analysis, post-stroke depression, dysphagia, cognitive impairment, and other complications have become independent research themes. Future research should develop acupuncture treatment pathways tailored to specific complications and integrate them with modern rehabilitation techniques, including mirror therapy and transcranial magnetic stimulation, to form comprehensive rehabilitation strategies43,44. Finally, artificial intelligence and big data approaches should be leveraged. This direction is motivated by the emergence of “bibliometrics” as a cluster, indicating that the field has entered a stage of research summarisation and frontier identification. The emergence of Cluster #3 “bibliometrics” indicates that the field has entered a stage of research summarisation and frontier identification. Future studies can apply natural language processing and machine learning methods to perform deeper topic modeling and trend prediction on massive literature datasets, moving from descriptive bibliometrics to predictive science mapping45,46. In conclusion, research on acupuncture for stroke is at a critical juncture, transitioning from experience-based accumulation to evidence-driven practice and from a single therapy approach to integrated rehabilitation. Identifying frontier themes, strengthening international collaboration, and promoting methodological innovation will be the core driving forces for the sustainable development of this field.
披露
The authors declare no conflicts of interest. No artificial intelligence (AI) tools were used in the preparation of this manuscript or its figures.
材料
| 姓名 | 公司 | 目录编号 | 评论 |
|---|---|---|---|
| CiteSpace | Chaomei Chen, Drexel University | 6.4.R1 | Used for constructing co-citation networks, analyzing keyword evolution, and performing cluster analysis with g-index (k=10) and pathfinder network scaling. |
| GraphPad Prism | GraphPad Software | 10.1 | Used for basic statistical analysis and preparation of figures. |
| Journal Citation Reports (JCR) | Clarivate Analytics | 2025 | Used for obtaining journal impact factors and quartile rankings; data retrieved in 2025. |
| Scimago Graphica | SCImago Lab | 1.0.25 | Used for generating country/regional collaboration maps and journal dual-map overlays to reveal geographical distribution and cross-disciplinary knowledge flows. |
| VOSviewer | Centre for Science and Technology Studies (CWTS), Leiden University | 1.6.19 | Used for constructing and visualizing co-authorship, co-occurrence, and co-citation networks. |
| Web of Science Core Collection (WoSCC) | Clarivate Analytics | N/A | Literature database used for data acquisition; accessed on May 2, 2026. |
| WPS Excel | Kingsoft Corporation | 2023 | Used for descriptive statistical analysis and data management. |
参考文献
- GBD 2021 Stroke Risk Factor Collaborators. Global, regional, and national burden of stroke and its risk factors, 1990–2021: a systematic analysis for the Global Burden of Disease Study 2021. Lancet Neurol. 2024;23(10):973–1003.
- Yao M, et al. Projections of the global, regional and national stroke burden by 2050: a systematic analysis for the Global Burden of Disease Study 2021. Eur J Epidemiol. 2026;41(3):337–349.
- Winstein CJ, et al. American Heart Association Stroke Council, Council on Cardiovascular and Stroke Nursing, Council on Clinical Cardiology, and Council on Quality of Care and Outcomes Research. Guidelines for Adult Stroke Rehabilitation and Recovery: A Guideline for Healthcare Professionals From the American Heart Association/American Stroke Association. Stroke. 2016;47(6):e98–e169.
- Langhorne P, Bernhardt J, Kwakkel G. Stroke rehabilitation. Lancet. 2011;377(9778):1693–1702.
- Wang YF, Ma LJ, Han YX, Chen GY, Ma X. Global trends and hotspots of artificial intelligence in pain management: A bibliometric analysis. Digit Health. 2026;12:20552076261460708.
- Zhang JH, Wang D, Liu M. Overview of systematic reviews and meta-analyses of acupuncture for stroke. Neuroepidemiology. 2014;42(1):50–58.
- Peng Y, et al. Acupuncture combined with mirror therapy for post-stroke dyskinesia: A meta-analysis and systematic review. Medicine (Baltimore). 2024;103(26):e38733.
- Zhu J, et al. The effects of 8 weeks of functional strength training and blood flow restriction training on lower limb muscle strength, maximal power, and movement quality in male sprinter college athletes. Front Physiol. 2026;17:1798606.
- Zhou Z, et al. Acupuncture-related therapies for post-stroke pain management: a scoping review and evidence map. Front Neurol. 2025;16:1604655.
- Birch S, Robinson N. Acupuncture as a post-stroke treatment option: A narrative review of clinical guideline recommendations. Phytomedicine. 2022;104:154297.
- Chen G, Yan Z, Wang Y, Tao Q. Rheumatoid Arthritis and Fibromyalgia Syndrome: A Bibliometric and Bioinformatics Perspective on Comorbidity Research. J Multidiscip Healthc. 2025;18:6811–6827.
- Wang Y, et al. Research Trends and Hotspots in JAK Inhibitors for Ulcerative Colitis: A Bibliometric Analysis From 2015 to 2024. J Multidiscip Healthc. 2025;18:6755–6771.
- Synnestvedt MB, Chen C, Holmes JH. CiteSpace II: visualization and knowledge discovery in bibliographic databases. AMIA Annu Symp Proc. 2005;2005:724–728.
- Zhao J, Li M. Worldwide trends in prediabetes from 1985 to 2022: A bibliometric analysis using bibliometrix R-tool. Front Public Health. 2023;11:1072521.
- Sun F, Wang J, Wen X. Acupuncture in stroke rehabilitation: Literature retrieval based on international databases. Neural Regen Res. 2012;7(15):1192–1199.
- Wang X, et al. Acupuncture clinical hotspots and trends from 2013 to 2022: A bibliometric and visualized analysis. Medicine (Baltimore). 2025;104(14):e41890.
- Zhao Y, Huang L, Li W, Cai L. A bibliometric analysis of acupuncture for cerebral infarction from 1993 to 2023. Front Neurol. 2024;15:1386164.
- Markscheffel B, Schröter F. Comparison of two science mapping tools based on software technical evaluation and bibliometric case studies. COLLNET J Scientometr Inf Manag. 2021;15(2):365–396.
- van Eck NJ, Waltman L. Software survey: VOSviewer, a computer program for bibliometric mapping. Scientometrics. 2010;84(2):523–538.
- Chavez LM, et al. Mechanisms of Acupuncture Therapy in Ischemic Stroke Rehabilitation: A Literature Review of Basic Studies. Int J Mol Sci. 2017;18(11):2270.
- GBD 2019 Stroke Collaborators. Global, regional, and national burden of stroke and its risk factors, 1990–2019: a systematic analysis for the Global Burden of Disease Study 2019. Lancet Neurol. 2021;20(10):795–820.
- Zhang J, Lu C, Wu X, Nie D, Yu H. Neuroplasticity of Acupuncture for Stroke: An Evidence-Based Review of MRI. Neural Plast. 2021;2021:2662585.
- Wu S, et al. China Stroke Study Collaboration. Stroke in China: advances and challenges in epidemiology, prevention, and management. Lancet Neurol. 2019;18(4):394–405.
- Qin S, et al. The impact of acupuncture on neuroplasticity after ischemic stroke: a literature review and perspectives. Front Cell Neurosci. 2022;16:817732.
- Feigin VL, et al. World Stroke Organization (WSO): Global Stroke Fact Sheet 2022. Int J Stroke. 2022;17(1):18–29.
- Zhang S, et al. Acupuncture efficacy on ischemic stroke recovery: multicenter randomized controlled trial in China. Stroke. 2015;46(5):1301–1306.
- Liu S, et al. A neuroanatomical basis for electroacupuncture to drive the vagal-adrenal axis. Nature. 2021;598(7882):641–645.
- Yang A, et al. Acupuncture for stroke rehabilitation. Cochrane Database Syst Rev. 2016;2016(8):CD004131.
- Lin R, et al. Electroacupuncture ameliorates learning and memory in rats with cerebral ischemia-reperfusion injury by inhibiting oxidative stress and promoting p-CREB expression in the hippocampus. Mol Med Rep. 2015;12(5):6807–6814.
- GBD 2016 Stroke Collaborators. Global, regional, and national burden of stroke, 1990–2016: a systematic analysis for the Global Burden of Disease Study 2016. Lancet Neurol. 2019;18(5):439–458.
- Kim YR, et al. Electroacupuncture promotes post-stroke functional recovery via enhancing endogenous neurogenesis in mouse focal cerebral ischemia. PLoS One. 2014;9(2):e90000.
- Feng X, et al. Electroacupuncture ameliorates cognitive impairment through inhibition of NF-κB-mediated neuronal cell apoptosis in cerebral ischemia-reperfusion injured rats. Mol Med Rep. 2013;7(5):1516–1522.
- Kim JH, et al. Electroacupuncture acutely improves cerebral blood flow and attenuates moderate ischemic injury via an endothelial mechanism in mice. PLoS One. 2013;8(2):e56736.
- Lan L, et al. Electroacupuncture exerts anti-inflammatory effects in cerebral ischemia-reperfusion injured rats via suppression of the TLR4/NF-κB pathway. Int J Mol Med. 2013;31(1):75–80.
- Cai Y, et al. Electroacupuncture for Poststroke Spasticity: A Systematic Review and Meta-Analysis. Arch Phys Med Rehabil. 2017;98(12):2578–2589.e4.
- Su XT, et al. Mechanisms of Acupuncture in the Regulation of Oxidative Stress in Treating Ischemic Stroke. Oxid Med Cell Longev. 2020;2020:7875396.
- Zhang W, et al. Experimental Evidence on Acupuncture Targeting Ferroptosis for Neurological Function Improvement in Cerebral Stroke: A Systematic Review and Meta-Analysis. Brain Behav. 2025;15(8):e70507.
- Han JZ, et al. Effectiveness and safety of Governor vessel acupuncture therapy for post-stroke cognitive impairment: A meta-analysis of randomized controlled trials. Ageing Res Rev. 2024;99:102355.
- Chen Z, et al. Inhibition of nucleoporin 214 depletes leukemia stem cells by promoting heme catabolism and lipid peroxidation. Blood. 2026:blood.2026033244.
- Li W, Chen S. Acupuncture for thalamic pain after stroke: A systematic review and meta-analysis. Medicine (Baltimore). 2023;102(9):e33006.
- Ji W, et al. Macrophages in systemic lupus erythematosus: a bibliometric analysis of research trends and emerging frontiers. J Vis Exp. 2026;(234):e72238.
- Hu Y, Han J, Liu M. Protocol-aware epidemic forecasting across heterogeneous public health surveillance systems. Front Public Health. 2026;14:1829302.
- Liu R, et al. Acupuncture for post-stroke depression: a systematic review and meta-analysis. BMC Complement Med Ther. 2021;21(1):109.
- Yang XC, et al. Electroacupuncture attenuates ferroptosis by promoting Nrf2 nuclear translocation and activating Nrf2/SLC7A11/GPX4 pathway in ischemic stroke. Chin Med. 2025;20(1):4.
- Yang Y, et al. Research hotspots, context, and future directions of ulcerative colitis comorbid with depression from 2006 to 2025: a bibliometric and visualization analysis. Front Med (Lausanne). 2026;13:1868648.
- Lei Y, et al. Phosphorylated DEK sustains leukemia stem cells by enabling PBX3-driven transcriptional reprogramming. Blood. 2026:blood.2025032710.