Acupotomy is associated with upregulation of IFT88 and normalization of TRPV4 activity, which may contribute to restored calcium homeostasis, suppressed calmodulin/caspase-mediated apoptosis, and promoted ECM synthesis in KOA. Combined acupotomy and TRPV4 inhibition produced greater effects than either treatment alone.
研究文章
Acupotomy Alleviates Knee Osteoarthritis by Regulating Chondrocyte Apoptosis via the IFT88-Mediated TRPV4 Signaling Axis
* These authors contributed equally
本文内容
摘要
摘要
Knee osteoarthritis (KOA) is characterized by cartilage degeneration with no disease-modifying therapy available. Primary cilia, maintained by IFT88, regulate TRPV4-mediated calcium signaling in chondrocyte homeostasis, but their role in KOA remains unclear. Acupotomy shows clinical efficacy in KOA, yet its mechanism via this signaling axis is unknown. This study investigated whether acupotomy alleviates KOA by regulating chondrocyte apoptosis through the IFT88-primary cilia-TRPV4 axis. Transcriptomic analysis, Lequesne MG scoring, Mankin scores, histology, electron microscopy, flow cytometry, immunoblotting, and qRT-PCR were performed on rabbit KOA models treated with acupotomy and/or the TRPV4 inhibitor HC067047. Transcriptomics identified 85 core reversal genes enriched in apoptosis, TRP channel regulation, ECM-receptor interaction, and PI3K-Akt pathways. Acupotomy improved Lequesne scores, cartilage pathology, and chondrocyte ultrastructure. Both acupotomy and HC067047 reduced elevated intracellular Ca2⁺, decreased calmodulin, and increased ACAN expression, with the combination showing the greatest effects. Both treatments reversed abnormal expression of Caspase-3, -9, -12, ACAN, COL2, and IFT88 at the protein and mRNA levels, with greater combined effects in the combination group. These findings suggest that acupotomy alleviates KOA in association with IFT88 upregulation and TRPV4-related signaling, which may contribute to reestablished calcium balance, suppressed calmodulin/caspase-mediated apoptosis, and promoted ECM synthesis. In conclusion, this study provides evidence supporting the IFT88–primary cilia–TRPV4 axis as a potential mechanism for acupotomy intervention in KOA. Acupotomy is associated with IFT88 upregulation and normalization of TRPV4-related signaling, which may contribute to restored calcium homeostasis, suppressed calmodulin/caspase-mediated apoptosis, and enhanced ACAN/COL2 matrix synthesis.
引言
KOA is a chronic degenerative joint disease characterized by progressive articular cartilage degradation, synovial inflammation, and subchondral bone remodeling. It affects an estimated 606 million people worldwide, imposing a substantial socioeconomic burden, particularly in aging populations1,2,3,4,5,6. As a leading cause of disability, KOA has prompted extensive research into its pathophysiology; however, current pharmacological and non-pharmacological interventions primarily aim at symptomatic relief—including pain management and functional improvement—rather than disease modification. This limitation largely stems from an incomplete understanding of the molecular mechanisms that drive cartilage degeneration7.
Chondrocyte apoptosis represents a critical cellular event that initiates and perpetuates extracellular matrix (ECM) degradation, affecting key components such as aggrecan (ACAN) and collagen type II (COL2)7,8. Disruption of intracellular calcium homeostasis plays a pivotal role in triggering both mitochondrial and endoplasmic reticulum (ER) stress-mediated apoptotic pathways (e.g., Caspase-9 and Caspase-12) in osteoarthritic chondrocytes9,10,11. Previous studies have shown that ER stress participates in the progression of senescence and apoptosis in OA chondrocytes, and that the IRE1-mTOR-PERK axis coordinates autophagy and ER stress-apoptosis induced by P2X7-mediated Ca2⁺ influx11,12,13.
The transient receptor potential vanilloid 4 (TRPV4) is a calcium-permeable, non-selective cation channel highly expressed on the chondrocyte surface14,15. Under physiological conditions, TRPV4 mediates appropriate calcium influx in response to mechanical loading, thereby maintaining chondrocyte homeostasis. Conversely, under pathological inflammatory or excessive mechanical stress conditions, aberrant TRPV4 activation leads to calcium overload, which subsequently exacerbates chondrocyte apoptosis and ECM degradation14,15,16. Notably, TRPV4 is functionally coupled to the primary cilium—an antenna-like organelle that serves as a hub for mechanosensation and calcium signaling17. Galectin 3 deficiency has been shown to alter chondrocyte primary cilium formation and exacerbate cartilage destruction, further supporting the critical role of primary cilia in OA pathogenesis18. The integrity of the primary cilium, largely maintained by intraflagellar transport protein 88 (IFT88), is essential for proper TRPV4-mediated signal transduction18,19,20. Importantly, recent evidence indicates that IFT88 negatively regulates TRPV4 under pathological mechanical stress, reducing calcium influx and alleviating tissue degeneration21,22 .
Acupotomy (also known as needle-knife) is a minimally invasive therapy derived from traditional Chinese medicine that combines acupuncture principles with micro-incision techniques23. Meta-analyses and systematic reviews have confirmed its clinical efficacy in relieving knee pain, reducing joint swelling, and improving joint function in KOA patients24,25. A recent perspective article further discussed the therapeutic potential of acupotomy for musculoskeletal pain and highlighted that its possible mechanisms of action—including mechanical release, pain modulation, and tissue healing—remain incompletely understood26. Experimental studies have further revealed that acupotomy promotes autophagy via the AMPK/ULK1 pathway and regulates the TGF-β1/Smad pathway to reduce cartilage fibrosis27,28. However, whether acupotomy exerts its chondroprotective effects by specifically modulating the IFT88-primary cilia-TRPV4 signaling axis to restore Ca2⁺ homeostasis and inhibit caspase-mediated apoptosis remains completely unknown.
In this study, transcriptomic sequencing was integrated with in vivo functional experiments to test the hypothesis that acupotomy alleviates KOA by restoring Ca2⁺ homeostasis and inhibiting chondrocyte apoptosis via IFT88-mediated regulation of TRPV4 channels. Using a well-established rabbit KOA model induced by the modified Videman method29 and evaluated by Lequesne MG scores30, the study aimed to: (1) identify key differentially expressed genes (DEGs) and signaling pathways affected by acupotomy intervention; and (2) validate whether the therapeutic effects of acupotomy are dependent on the IFT88-primary cilia-TRPV4 signaling axis using pharmacological inhibition.
方案
Animals and experimental design
New Zealand white rabbits (male, 6 months old, 2.0–2.5 kg) came from Laifu Breeding Farm (Nanjing, China). Eighteen rabbits were used for transcriptomic analysis, and another 60 were used for mechanistic studies. Housing conditions included 20–24 °C, 45–55% humidity, a 12/12 h light/dark cycle, and free feeding. Ethics approval came from Anhui University of Chinese Medicine (approval no. AHUCM-rabbits-2023195). Transcriptomics used three rabbit groups (n = 6 each): normal, model, and acupotomy. Mechanistic studies used five groups (n = 12 each): normal, model, acupotomy, TRPV4 inhibitor, and acupotomy + inhibitor. Rabbits were randomly allocated to experimental groups using a computer-generated random number sequence. The allocation was performed by an investigator not involved in the subsequent interventions or outcome assessment. Normal rabbits had no intervention across 63 days. Model rabbits received no treatment for 21 days after induction. Acupotomy occurred on days 49, 56, and 63 post-induction. For the inhibitor group, HC067047 (a TRPV4 channel inhibitor) was administered intragastrically once daily at 10 mg/kg from day 43 to day 63 after modeling (21 consecutive days). The dose of HC067047 (10 mg/kg) was selected based on previous studies demonstrating effective TRPV4 blockade in animal models, including paclitaxel-induced peripheral neuropathy31 . Acupotomy was performed on days 49, 56, and 63 after modeling. Thus, HC067047 treatment covered the entire acupotomy intervention period: the first, second, and third acupotomy sessions corresponded to treatment days 7, 14, and 21, respectively. In the combination group, HC067047 was administered using the same regimen, and acupotomy was performed on the same schedule (days 49, 56, and 63). Rabbits were selected because their knee joint size and cartilage thickness allow reliable acupotomy manipulation and reproducible histopathological/molecular sampling. Compared with rodents, the rabbit stifle joint provides a larger surgical field for standardized needle insertion and sweeping, and the modified Videman immobilization model in rabbits reproduces key KOA features including cartilage degeneration and chondrocyte apoptosis. These characteristics make the rabbit model particularly suitable for evaluating acupotomy and TRPV4-related mechanisms.
Details of all reagents, equipment, and software used in this study are provided in the Table of Materials.
Model establishment
KOA was induced by the modified Videman method29. Rabbits were fasted for 12 h before modeling and weighed. Anesthesia was induced by ear vein injection of 3% pentobarbital sodium at 30 mg/kg. The left hindlimb was shaved from the groin to the ankle. The procedure was performed by two experimenters: one restrained the rabbit by holding the forelimbs and the right hindlimb, while the other pulled the left hindlimb into full extension. Medical pressure-sensitive adhesive tape was first wrapped from the groin to the ankle to protect the fur. Double-sided foam tape was then applied over the adhesive tape from the groin to the middle of the lower leg. A polymer plaster bandage (softened in 65–85 °C water) was wrapped externally under pressure to ensure the knee was extended at 180° and the ankle dorsiflexed at 60°. The toes were left exposed for daily monitoring of blood supply. The gaps were filled with absorbent cotton, and the limb was further fixed with three layers of thick cardboard, polymer plaster bandage, and cloth strips to prevent biting. The bandage was inspected regularly for toe congestion or swelling. If swelling occurred, the cast was removed temporarily and re-applied after normal blood supply was restored. Immobilization lasted for 6 weeks. After the 6-week immobilization period, the casts and bandages were removed. Model success was verified by the modified Lequesne MG score30 (pain/gait/mobility: 0–3 each; swelling: 0–2; total 0–11). A score > 6 confirmed successful KOA induction.
During the immobilization period, the casts were checked daily, and the blood supply of the toes on the affected side was monitored. If mild toe swelling occurred due to an overly tight cast, the cast was adjusted appropriately. If swelling worsened, or ulceration or necrosis appeared, the cast was removed immediately and re-applied after swelling subsided. Because mobility was restricted, the contralateral limb was monitored to prevent it from becoming trapped in the metal cage; if trapped, it was gently released. Skin wounds were treated promptly, and the cast was examined for displacement or excessive tightness. If the cast became too loose to maintain knee extension, it was removed and replaced.
Acupotomy procedure
Acupotomy was performed on days 49, 56, and 63 post-induction. Rabbits were fixed on a treatment table. The following sites were selected as needle insertion points: the musculotendinous junction of the vastus medialis (superomedial to the patella), the musculotendinous junction of the vastus lateralis (superolateral to the patella), the musculotendinous junction of the rectus femoris (central superior patellar margin), the musculotendinous junction of the biceps femoris (below the lateral femoral condyle near the fibular head), the anserine bursa (anteroinferior to the medial femoral condyle, at the conjoined tendon of the sartorius, gracilis, and semitendinosus), and palpable cord-like nodules. Cord-like nodules were identified by palpation around the knee before each treatment; the two most prominent nodules were marked. All sites were localized with gentian violet, and the skin was shaved and disinfected routinely. A disposable sterile acupotomy needle (0.35 mm × 25 mm; vendor information provided in the Table of Materials) was used. The blade was oriented parallel to the longitudinal axis of the tendon or the selected muscle-tendon cord. The needle was inserted perpendicular to the skin surface until it reached the tendon-bone junction. Insertion depth was determined by the location of the cord-like structure or by a sense of resistance beneath the blade. Longitudinal sweeping was performed for 2–3 strokes, followed by transverse separation for 1–2 strokes. The needle was withdrawn when a sense of loosening was felt. After withdrawal, a sterile cotton ball was pressed briefly to stop bleeding. Acupotomy was performed once weekly for 3 weeks. The treatment endpoint was defined as a sense of loosening beneath the blade and completion of the scheduled three sessions.
Sample collection
On day 64, rabbits were euthanized by pentobarbital overdose (3%, ≥150 mg/kg, i.p.). Knee cartilage was collected and processed as follows: (1) fixed in 4% paraformaldehyde for histology; (2) fixed in 2.5% glutaraldehyde for electron microscopy; or (3) snap-frozen in liquid nitrogen and stored at –80 °C for molecular assays. The 18 rabbits used for transcriptomics were separate from the 60 rabbits used for mechanistic studies. For mechanistic studies, 60 rabbits were used (n = 12/group). Within each group, 6 rabbits were randomly selected for qRT-PCR, 3 for Western blotting, and 3 for histology/immunofluorescence/flow cytometry. All subset selections were performed randomly.
Histological scoring
Two pathologists who were blinded to the experimental group assignments independently evaluated the stained sections using the Mankin scoring system to assess the degree of cartilage degeneration27. Before evaluation, all sections were assigned random identification codes. The treatment allocations were not disclosed to the pathologists until all scoring was complete.
Transcriptomic analysis
Total RNA from pulverized cartilage was isolated using TRIzol (1 mL per 50–100 mg tissue), followed by chloroform extraction, isopropanol precipitation, 75% ethanol wash, and DEPC-water resuspension. Purity and integrity were checked on a spectrophotometer and bioanalyzer. For sequencing, mRNA was pulled down with oligo-dT beads, heat-fragmented (94 °C, 100–300 bp), and converted to cDNA. Libraries underwent end repair, A-tailing, adaptor ligation, and 12–15 cycles of PCR before paired-end sequencing (2 × 150 bp) on a high-throughput sequencing platform.
Trimming of raw reads used Trim Galore (Q < 10). Clean reads were mapped to the rabbit reference genome OryCun2.0 via HISAT2. FPKM values for gene expression were obtained with Cufflinks. To address the complexity of the rabbit genome—particularly expanded gene families and highly similar paralogous regions—multi-mapping reads (those aligning to more than one locus, NH:i > 1) were excluded and only uniquely mapped reads (NH:i = 1) were retained for gene-level quantification, which also prevents spurious allocation of paralogous reads to a single gene. Differential expression thresholds were p < 0.05 and |log₂FC| > 1 using cuffdiff. KEGG analysis was run with clusterProfiler (R, p < 0.05).
Hematoxylin and eosin (H&E) staining
Fixed cartilage (4% paraformaldehyde, 72 h) was decalcified in EDTA (4 weeks), dehydrated, embedded in paraffin, and sectioned (5 μm). Sections were stained with H&E and observed under a light microscope.
Transmission electron microscopy (TEM)
Specimens (~1 mm3) were fixed in 2.5% glutaraldehyde (6 h), post-fixed in 1% osmic acid (2 h), dehydrated in ethanol, stained with uranyl acetate (3 h or overnight), treated with propylene oxide (30 min), and embedded in epoxy resin. Ultrathin sections (70 nm) were stained with lead citrate and examined under a transmission electron microscope.
Measurement of intracellular calcium levels
Tissues were minced in PBS containing 1 mM EDTA, filtered (70 μm strainer), and centrifuged (300 × g, 10 min). After red blood cell lysis (10 min, room temperature), cells were incubated with 2 μM Fluo-4 AM (37 °C, 20 min, dark). After two washes with calcium-free PBS, fluorescence was measured by flow cytometry. For gating, chondrocytes were first gated on forward and side scatter, followed by single-cell gating. Unstained resting cells were used as a negative reference to set the calcium threshold. Data are expressed as the mean fluorescence intensity (MFI) ratio of Fluo-4 relative to the normal group. This threshold-based dynamic comparison reflects differences in calcium signaling among groups.
Immunofluorescence staining
After dewaxing and rehydration of paraffin sections, antigen retrieval was carried out. Sections were treated with 3% H₂O₂ for 10 min to inactivate endogenous peroxidase, followed by a 30-min block with goat serum for background reduction. Primary antibodies recognizing Calmodulin (1:200) and ACAN (1:300) were added and left overnight at 4 °C. Sections were then washed and reacted with HRP-conjugated secondary antibody (30 min), then with TSA-fluorescent dye for 10 min. DAPI was applied for 5 min to label nuclei. Fluorescence images were obtained using a standard fluorescence microscope. For quantification, three randomly selected fields per section were captured under identical exposure settings. The mean fluorescence intensity (MFI) of ACAN or Calmodulin was measured using ImageJ and normalized to the tissue area.
Western blotting
Protein extraction from cartilage (~0.1 g) was performed using RIPA buffer with 0.6 mM PMSF. Lysates were cleared by centrifugation (12,000 × g, 15 min). The resulting supernatants underwent SDS-PAGE separation (90 V, 90 min) and subsequent PVDF membrane transfer. Membranes were blocked with 5% non-fat milk (2 h) and then probed overnight at 4 °C with primary antibodies against Caspase-3 (1:5000), Caspase-9 (1:2000), Caspase-12 (1:2000), ACAN (1:1000), COL2 (1:2000), IFT88 (1:2000), and GAPDH (1:5000). After a 1.2-h incubation with HRP-conjugated secondary antibody (1:20,000), signals were detected by ECL and analyzed with image analysis software. The intensity of each target protein was normalized to GAPDH.
Quantitative real-time PCR (qRT-PCR)
Total RNA was reverse-transcribed using a reverse transcription kit. qPCR was performed using a SYBR Green-based qPCR master mix under the following conditions: 95 °C for 1 min; 40 cycles of 95 °C for 20 s and 60 °C for 1 min. Relative expression was calculated using the 2⁻ΔΔCt method, with β-actin as the reference gene. Primers are listed in Table 1.
Statistical analysis
Data are presented as mean ± SEM. Normality was assessed using the Shapiro–Wilk test and Q–Q plots, and homogeneity of variance was assessed using Levene’s test. Because some experiments had a small sample size (n = 3 per group), these assumption tests have limited statistical power; the parametric results should therefore be interpreted with this limitation in mind. For two-group comparisons, an unpaired two-tailed Student’s t-test was used. For multi-group comparisons, one-way ANOVA followed by Tukey’s post hoc test was used. A two-sided p < 0.05 was considered statistically significant. All analyses were performed using GraphPad Prism 10. No a priori sample-size calculation was performed; the sample size was based on previous studies using similar rabbit KOA models and on practical constraints.
结果
Transcriptomic analysis identifies the IFT88-TRPV4 axis as a key candidate pathway
As shown in Figure 1A–D, transcriptomic sequencing was performed to identify potential molecular targets of acupotomy intervention in KOA. Compared with the normal group, the model group exhibited 1,673 DEGs, including 1,219 upregulated and 454 downregulated genes. Following acupotomy intervention, 1,107 DEGs were identified compared with the model group. Intersection analysis identified 85 core reversal genes, which were significantly enriched in KEGG pathways including apoptosis, TRP channel regulation, ECM-receptor interaction, and PI3K-Akt signaling. Notably, IFT88, TRPV4, Caspase-3/9, ACAN, and COL2 were identified as key candidate targets of acupotomy intervention. These transcriptomic findings were exploratory and hypothesis-generating. Among the enriched pathways, subsequent functional validation focused on the IFT88-primary cilia-TRPV4-calcium-apoptosis axis, based on the identification of IFT88, TRPV4, Caspase-3/9, ACAN, and COL2 as key candidate targets. Other enriched pathways, including PI3K-Akt signaling, were not experimentally validated in this study and therefore remain to be investigated in future work.
Acupotomy improves joint function and ameliorates cartilage pathology
To evaluate the therapeutic effect of acupotomy on KOA, Lequesne MG scores, Mankin scores, and H&E staining were assessed. As shown in Figure 2A, before intervention, all modeling groups had significantly higher Lequesne MG scores than the normal group, indicating successful KOA induction. After intervention, the acupotomy, inhibitor, and combination groups all exhibited significantly lower scores compared with the model group, with the combination group showing the greatest improvement. Mankin scoring (Figure 2B) showed that the model group had markedly higher scores than the normal group, indicating severe cartilage degeneration. Both acupotomy and HC067047 treatment significantly reduced Mankin scores compared with the model group, and the combination group showed the lowest Mankin scores among all treatment groups. Consistently, H&E staining (Figure 2C) revealed that the model group had rough articular surfaces, cartilage thinning, matrix erosion, and inflammatory infiltration. Both acupotomy and HC067047 treatment significantly ameliorated these pathological changes, and their combination showed the best cartilage protection. These results indicate that both acupotomy and TRPV4 inhibition effectively improve joint function and protect against cartilage damage in KOA rabbits, with greater effects observed in the combination group.
Acupotomy restores calcium homeostasis via TRPV4 regulation
To investigate whether acupotomy regulates calcium homeostasis through TRPV4, transmission electron microscopy, flow cytometry, and immunofluorescence were performed. As shown in Figure 3, TEM revealed that chondrocytes in the model group exhibited nuclear membrane shrinkage, chromatin margination, and mitochondrial vacuolization, which were markedly reversed by both acupotomy and HC067047 treatment. Red arrows indicate mitochondria, and green arrows indicate ER. Notably, the combination of acupotomy with HC067047 showed further improvement in chondrocyte ultrastructural integrity compared with either treatment alone (Figure 3A). Flow cytometry demonstrated that intracellular Ca2⁺ levels were significantly elevated in the model group compared with the normal group. Both acupotomy and HC067047 treatment significantly reduced Ca2⁺ levels, and the combination of the two exhibited a further reduction (Figure 3B–C). Immunofluorescence staining revealed that ACAN fluorescence intensity was markedly decreased in the model group, while both acupotomy and HC067047 treatment significantly restored its expression. The combination of acupotomy with HC067047 further enhanced ACAN restoration compared with either treatment alone (Figure 3D–E). In contrast, Calmodulin exhibited the opposite trend, with enhanced fluorescence intensity in the model group and a marked reduction following both acupotomy and HC067047 treatment. Notably, the combination with HC067047 resulted in a more pronounced suppression of Calmodulin fluorescence intensity compared with either treatment alone (Figure 3F–G). These results indicate that both acupotomy and TRPV4 inhibition restore calcium homeostasis and protect chondrocyte ultrastructure, and their combination produces greater protective effects than either treatment alone.
Acupotomy inhibits apoptosis, promotes matrix synthesis, and upregulates IFT88 expression
As shown in Figure 4, compared with the normal group, the model group exhibited significantly increased Caspase-3 expression and significantly decreased ACAN, COL2, and IFT88 expression at both protein and mRNA levels. Both acupotomy and HC067047 treatment significantly reversed these changes at both protein and mRNA levels. Notably, the combination of acupotomy with HC067047 showed greater combined effects, further decreasing Caspase-3 expression while further increasing ACAN, COL2, and IFT88 expression compared with either treatment alone, at both protein and mRNA levels (Figure 4A–I). The protein and mRNA expression of Caspase-9 and Caspase-12 are presented in Supplementary Figure 1A–E; both acupotomy and HC067047 reversed their abnormal expression, and the combination group showed the greatest effects. These results demonstrate that both acupotomy and TRPV4 inhibition suppress caspase-mediated chondrocyte apoptosis, promote extracellular matrix synthesis, and upregulate IFT88 expression, and their combination produces greater protective effects than either treatment alone. Collectively, these findings suggest that acupotomy exerts its therapeutic effects on KOA in association with the IFT88-primary cilia-TRPV4 regulatory axis.
DATA AVAILABILITY:
The raw data generated in this study have been deposited in Figshare under https://doi.org/10.6084/m9.figshare.34033446.
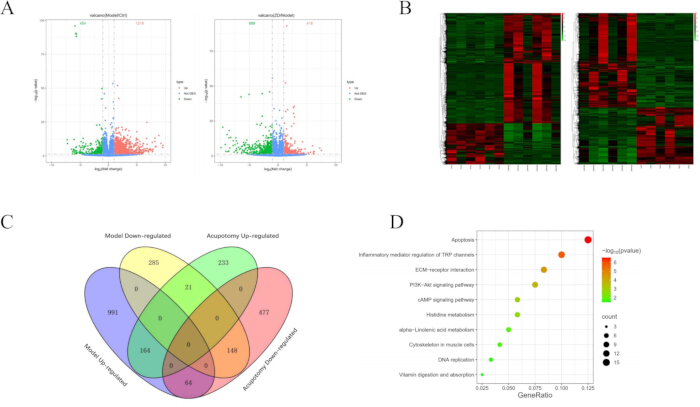
Figure 1: Transcriptomic analysis identifies the IFT88-TRPV4 axis as a key candidate pathway. (A) Volcano plots of differentially expressed genes between the model group and the normal group, and between the acupotomy group and the model group. (B) Cluster heatmaps of differentially expressed genes between the model group and the normal group, and between the acupotomy group and the model group. (C) Venn diagram of the intersection of differentially expressed genes among groups. (D) Scatter plot of KEGG enrichment analysis of intersection genes. For transcriptomic analysis, n = 6 biologically independent rabbits per group. Please click here to view a larger version of this figure.
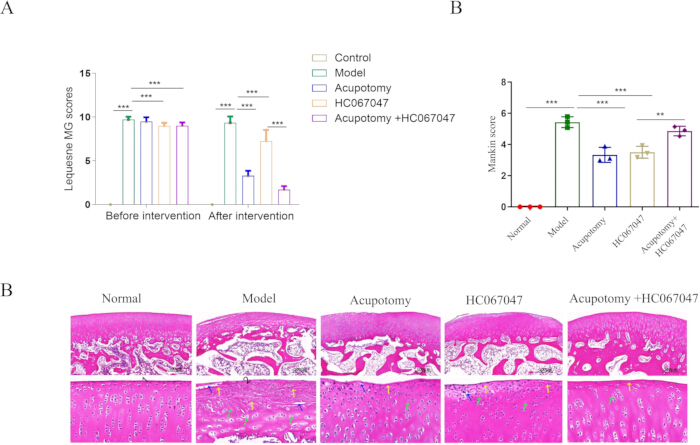
Figure 2: Acupotomy improves joint function and ameliorates cartilage pathology. (A) Lequesne MG scores of rabbits in each group. (B) Mankin scores of rabbits in each group. (C) Representative H&E staining images of rabbits in each group. Scale bars = 100 μm. Data are presented as mean ± SEM. For Lequesne MG scores, n = 12 rabbits per group. For Mankin scores and H&E staining, n = 3 biologically independent rabbits per group. *p < 0.05, **p < 0.01, ***p < 0.001. Please click here to view a larger version of this figure.
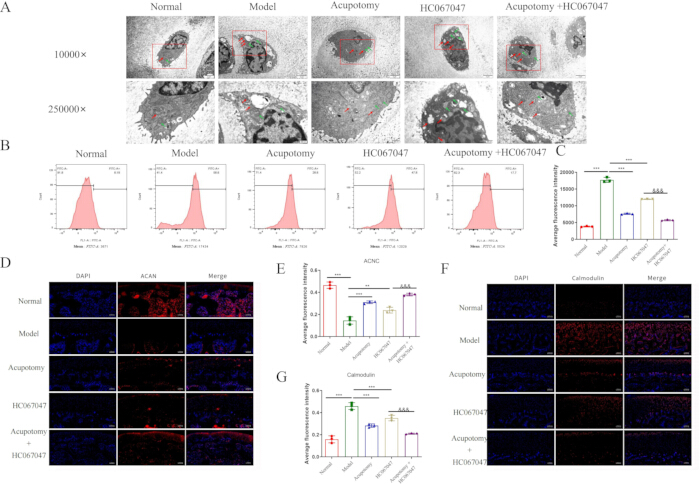
Figure 3: Acupotomy restores calcium homeostasis via TRPV4 regulation. (A) Comparison of transmission electron microscopy findings of rabbits in each group. Scale bars = 2 μm (upper panels) and 500 nm (lower panels). Red arrows indicate mitochondria, and green arrows indicate endoplasmic reticulum. (B–C) Comparison of calcium ion levels in rabbits of each group. (D–E) Comparison of ACAN immunofluorescence in rabbits of each group. (F–G) Comparison of calmodulin immunofluorescence in rabbits of each group. Scale bars = 100 μm. Data are presented as mean ± SEM; n = 3 biologically independent rabbits per group. *p < 0.05, **p < 0.01, ***p < 0.001.HC067047 group vs Acupotomy +HC067047 group , &p < 0.05, &&p < 0.01, &&&p < 0.001. Please click here to view a larger version of this figure.
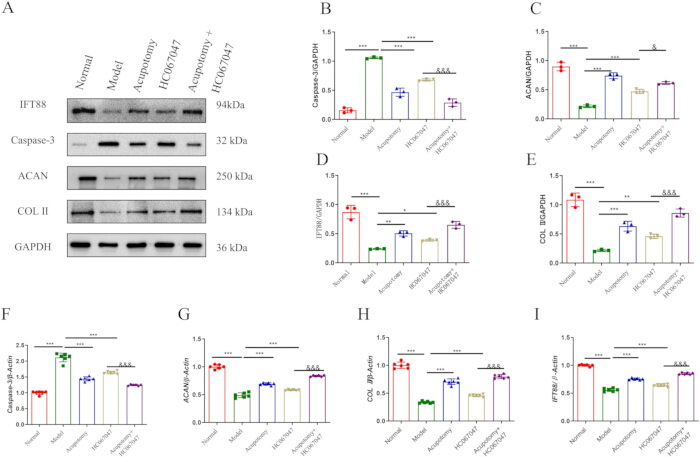
Figure 4: Acupotomy inhibits apoptosis, promotes matrix synthesis, and upregulates IFT88 expression. (A) Representative Western blot bands of Caspase-3, ACAN, IFT88, COL2, and GAPDH in cartilage tissues from each group. (B) Caspase-3 protein. (C) ACAN protein. (D) IFT88 protein. (E) COL2 protein. (F) Caspase-3 mRNA. (G) ACAN mRNA. (H) COL2 mRNA. (I) IFT88 mRNA. Data are presented as mean ± SEM. For Western blotting, n = 3 biologically independent rabbits per group; band intensities were normalized to GAPDH. For qRT-PCR, n = 6 biologically independent rabbits per group. *p < 0.05, **p < 0.01, ***p < 0.001.HC067047 group vs Acupotomy +HC067047 group , &p < 0.05, &&p < 0.01, &&&p < 0.001. Please click here to view a larger version of this figure.
Supplementary Figure 1: Expression of Caspase-9 and Caspase-12. (A) Representative Western blot bands of Caspase-9, Caspase-12, and GAPDH in cartilage tissues from each group. (B) Caspase-9 protein expression. (C) Caspase-12 protein expression. (D) Caspase-9 mRNA expression. (E) Caspase-12 mRNA expression. Data are presented as mean ± SEM. For Western blotting, n = 3 biologically independent rabbits per group; band intensities were normalized to GAPDH. For qRT-PCR, n = 6 biologically independent rabbits per group. *p < 0.05, **p < 0.01, ***p < 0.001.HC067047 group vs Acupotomy +HC067047 group , &p < 0.05, &&p < 0.01, &&&p < 0.001.Please click here to download this file.
| Gene | Forward primer | Reverse primer |
| (5'→3') | (5'→3') | |
| β-actin | AAAAACTGGAACGGTGAAGG | GTACAATCAAAGTCCTCGGC |
| Caspase-3 | CACGGTGATGAAGGAGTC | GCAAGCCTGAATAATGAA |
| Caspase-9 | AAGCGGAGTCAGGAGTGG | GATAAGAACGGAAAGGAAGG |
| Caspase-12 | GCCCTGGGTCCTGGCAATA | TCGCCACTGACACCAACCACA |
| ACAN | TTGATGAGTGCCTTTCAAGC | CATGTGAAAGAGTCGATGGC |
| COL2 | GGTTTGGGGAGACCATCAAT | GGTAGGTGATGTTCTGGGAG |
| IFT88 | GGGAACACCATGCAGACG | GAAAGCAGATGCCGAAGC |
Table 1: Primer sequences used for quantitative real-time PCR. Forward and reverse primer sequences for Caspase-3, Caspase-9, Caspase-12, ACAN, COL2, IFT88, and β-actin are provided.
讨论
This study provides integrated transcriptomic and in vivo mechanistic evidence suggesting that acupotomy alleviates KOA in association with IFT88 upregulation and normalization of TRPV4-related signaling. These changes may contribute to reduced intracellular calcium overload, inhibition of caspase-mediated chondrocyte apoptosis, and promotion of ACAN and COL2 extracellular matrix synthesis. Both acupotomy and HC067047 treatment effectively reduced intracellular Ca2⁺ levels and suppressed Calmodulin overexpression, while their combination produced the most pronounced effects. The greater combined effect observed with HC067047 supports that TRPV4 is a potential molecular target of acupotomy intervention, suggesting the IFT88-primary cilia-TRPV4 axis as a potential mechanistic pathway for mechanical therapy in KOA. This study is the first to integrate transcriptomic profiling with in vivo mechanistic validation to elucidate how a mechanical decompression therapy regulates chondrocyte fate at the molecular level.
Having established that acupotomy restores IFT88 expression, the biophysical implications of this finding were next considered. IFT88 is an essential component of the intraflagellar transport system required for primary cilia assembly and maintenance20. Primary cilia are microtubule-based organelles that function as cellular antennae for mechanical and chemical signals; in articular cartilage, they enable chondrocytes to sense mechanical loads and transduce these signals into appropriate biosynthetic or catabolic responses17. Galectin 3 deficiency has been shown to alter chondrocyte primary cilia formation and exacerbate cartilage destruction, further supporting the critical role of primary cilia in OA pathogenesis18. Under pathological conditions such as joint immobilization or excessive mechanical compression, ciliary structure becomes disrupted, leading to mislocalization and dysregulation of ciliary proteins including TRPV432. In line with previous reports linking ciliary dysfunction to OA pathogenesis33, IFT88 expression was significantly downregulated in KOA cartilage in the present study. Critically, acupotomy restored IFT88 expression, suggesting that mechanical release repairs damaged ciliary structures. This finding is consistent with Wu et al.34, who demonstrated that low-intensity pulsed ultrasound regulates KOA progression through primary cilia-mediated TRPV4 channels, and that IFT88 knockdown abolished the protective effect of mechanical stimulation. Notably, both acupotomy and HC067047 treatment significantly restored IFT88 expression, and their combination further enhanced IFT88 restoration compared with either treatment alone, indicating that TRPV4 inhibition potentiates the cilia-restoring effects of acupotomy.
The observation that acupotomy significantly reduces elevated intracellular Ca2⁺ levels aligns with the established paradigm that calcium overload is a primary driver of chondrocyte apoptosis in OA7,9. ER stress has been shown to participate in the progression of senescence and apoptosis in OA chondrocytes, and the IRE1-mTOR-PERK axis coordinates autophagy and ER stress-apoptosis induced by P2X7-mediated Ca2⁺ influx11,12. Calmodulin—a key calcium sensor that activates downstream apoptotic cascades—was overexpressed in the model group and markedly suppressed by acupotomy treatment, providing a mechanistic link between TRPV4 normalization and the inhibition of caspase-mediated cell death. Both acupotomy and HC067047 treatment significantly reduced intracellular Ca2⁺ levels and suppressed Calmodulin expression, and their combination produced the most pronounced reduction in calcium signaling, suggesting a greater combined effect of mechanical and pharmacological TRPV4 inhibition. The roles of TRPV4 and Piezo channels in stretch-evoked Ca2⁺ responses in chondrocytes have been well documented, further supporting the importance of mechanosensitive ion channels in cartilage biology16. O'Conor et al.15 demonstrated that cartilage-specific knockout of TRPV4 decreases age-related osteoarthritis, supporting the important role of TRPV4 in OA pathogenesis. Xu et al.35 showed that excessive mechanical stress induces chondrocyte apoptosis through TRPV4 in an anterior cruciate ligament-transected rat OA model. Agarwal et al.14 found that a dysfunctional TRPV4-GSK3β pathway prevents OA chondrocytes from sensing changes in ECM viscoelasticity. Collectively, these findings support TRPV4 as a key signaling node linking mechanical load to chondrocyte fate determination.
The dual anti-apoptotic and pro-anabolic actions of acupotomy distinguish it from pharmacological agents that typically target single pathways. Western blot and qRT-PCR analyses demonstrated that acupotomy significantly downregulated Caspase-3, Caspase-9, and Caspase-12, indicating suppression of both the intrinsic (mitochondrial) and ER stress-mediated apoptotic pathways. Concurrently, acupotomy upregulated ACAN and COL2 at both protein and mRNA levels, actively promoting ECM synthesis. Both acupotomy and HC067047 treatment significantly reversed the abnormal expression of Caspase-3, Caspase-9, Caspase-12, ACAN, COL2, and IFT88 at both protein and mRNA levels. Notably, the combination of acupotomy with HC067047 produced greater combined effects, further decreasing Caspase-3, Caspase-9, and Caspase-12 expression, while further increasing ACAN, COL2, and IFT88 expression compared with either treatment alone. This dual action is clinically relevant because OA is characterized by an imbalance between catabolic and anabolic activities. Targeting p21-positive senescent chondrocytes via IL-6R/JAK2 inhibition has been shown to alleviate OA, highlighting the importance of cellular senescence in OA pathogenesis. Dong et al.7 showed that CDDO-Im inhibits chondrocyte apoptosis by enhancing Nrf2-dependent autophagy. Echinacoside has been reported to upregulate Sirt1 to suppress ER stress and inhibit ECM degradation in vitro and ameliorate OA in vivo36. Together, these findings depict a complex mechanotransduction network in which primary cilia and TRP channels intersect to regulate chondrocyte fate decisions.
These findings significantly extend the current understanding of acupotomy mechanisms. An et al.37demonstrated that acupotomy combined with human adipose mesenchymal stem cells exerts chondroprotective effects in KOA rabbits via the GSK3β-cyclin D1-CDK4/CDK6 signaling pathway. Multiple meta-analyses and systematic reviews have confirmed the clinical efficacy of acupotomy for KOA. The transcriptomic analysis showed that the core DEGs following acupotomy intervention were significantly enriched in apoptosis, TRP channel regulation, ECM-receptor interaction, and PI3K-Akt signaling pathways. IFT88, TRPV4, Caspase-3, Caspase-9, ACAN, and COL2 were identified as key candidate targets. These findings support at the transcriptional level that acupotomy exerts its therapeutic effects through the coordinated regulation of multiple genes and pathways, consistent with the holistic concept of traditional Chinese medicine and the treatment philosophy of acupotomy. The observation that TRPV4 inhibition combined with acupotomy produced greater combined effects across multiple molecular endpoints supports a potential role of TRPV4 in mediating the therapeutic actions of acupotomy.
Several limitations of this study should be acknowledged. First, although HC067047 provided strong pharmacological evidence for TRPV4 involvement, genetic manipulation (e.g., IFT88 siRNA or conditional knockout) is required to establish causality. Second, although HC067047 is a widely used TRPV4 inhibitor, in-house selectivity validation against other TRP channels or calcium-permeable channels was not performed. Off-target effects cannot be fully excluded, and future studies using genetic TRPV4 manipulation or more selective inhibitors are needed. Third, the findings were obtained from a rabbit model, and translational validation in human cartilage explants or clinical cohorts is required. Fourth, the long-term effects of acupotomy beyond the 63-day observation period remain unknown. It is unclear whether the benefits persist after treatment cessation, whether repeated acupotomy is required, and whether acupotomy can delay or prevent the need for joint replacement. Fifth, it remains undetermined whether acupotomy promotes true cartilage regeneration or merely protects against further degradation. Although acupotomy improved cartilage histology, preserved matrix components, and restored chondrocyte ultrastructure, these findings do not establish de novo cartilage formation. Finally, no a priori sample-size calculation was performed because of the exploratory nature of the study and the lack of established effect sizes for acupotomy in this rabbit KOA model. This limitation should be considered when interpreting the statistical findings. Future studies with longer follow-up, serial imaging, quantitative histomorphometry, and lineage-tracing approaches are needed to distinguish cartilage regeneration from protection against degradation. Despite these limitations, the convergence of transcriptomic, pharmacological, and multi-modal molecular evidence provides strong support for the study conclusions.
In conclusion, this study provides evidence supporting the IFT88-primary cilia-TRPV4 axis as a potential mechanism for acupotomy intervention in KOA. Acupotomy is associated with IFT88 upregulation and normalization of TRPV4-related signaling, which may contribute to restored calcium homeostasis, suppressed calmodulin/caspase-mediated apoptosis, and enhanced ACAN/COL2 matrix synthesis. Both acupotomy and TRPV4 inhibition produce protective effects on chondrocyte survival and ECM integrity, and their combination yields enhanced outcomes, supporting TRPV4 as a potential downstream effector of acupotomy. These findings provide a robust theoretical foundation for the clinical application of acupotomy and identify novel therapeutic targets for KOA treatment. Based on these findings, future research should focus on: (1) translational validation in human cohorts and clinical trials evaluating acupotomy alone and in combination with TRPV4 modulators; (2) investigating the upstream signals that lead to IFT88 downregulation in KOA and how mechanical forces from acupotomy reverse this; and (3) exploring whether acupotomy has similar beneficial effects on other primary cilia-related disorders. Moreover, given the increasing global prevalence of early-onset OA, developing mechanistically grounded non-pharmacological interventions like acupotomy represents a promising direction for disease-modifying therapy.
披露
The authors declare that they have no known competing financial interests or personal relationships that could have appeared to influence the work reported in this paper. No artificial intelligence (AI) tools were used in the preparation of this manuscript or figures. All authors have read and approved the final version and take full responsibility for its content.
致谢
This work was supported by the National Natural Science Foundation of China (No. 82575228), the Anhui Province Clinical Medical Research Transformation Project (No. 202427b10020136), the Scientific Research Project of the Anhui Provincial Department of Education (No. 2023AH050824), the Health Research Program of Anhui (No. AHWJ2025Ab30130), the Anhui Association of Traditional Chinese Medicine Inheritance and Innovation Research Project (No. 2024ZYYXH153), the Anhui Provincial Scientific Research Project on Inheritance and Innovation of Traditional Chinese Medicine (No. 2025CCCX105), and the National Traditional Chinese Medicine Advantage Specialty Construction Project (National Administration of Traditional Chinese Medicine Medical Administration Letter [2024] No. 90).
材料
| 姓名 | 公司 | 目录编号 | 评论 |
|---|---|---|---|
| 3% hydrogen peroxide | Fuzhou Maixin Biotech | SP kit-A3 | |
| 4% paraformaldehyde | Biosharp | BL539A | |
| Aggrecan antibody | Proteintech | 13880-1-AP | AB_2722780 |
| Agilent 2100 | Agilent Technologies | ||
| Anhydrous ethanol | Sinopharm Chemical Reagent | 10009228 | |
| Calmodulin | Bioworld | BS2989 | AB_1663532 |
| Caspase-12 | bioss | bs-1105R | AB_10858192 |
| Caspase-3 | Abcam | AB32351 | AB_725946 |
| Caspase-9 | Abcam | ab202068 | AB_2889070 |
| Centrifuge | Anhui Jiawen Instruments | JW-3021HR | |
| Chloroform | Nanjing Reagent | 67-66-3 | |
| Citrate buffer, pH 6.0 | ZSGB-BIO | ZLI-9065 | |
| clusterProfiler | Guangchuang Yu | SCR_016884 | |
| Cufflinks | Cole Trapnell | SCR_014597 | |
| DAB substrate | Fuzhou Maixin Biotech | Kit-5230 | |
| DEPC-treated water | Generay Biotech | D1007 | |
| Disposable acupotomy needle, 0.35 mm × 25 mm | Ma'anshan Bond Medical Equipment | GB3525R | |
| ECL chemiluminescent substrate kit | Biosharp | BL520A | |
| EDTA | Biosharp | BL617A | |
| Eosin solution | Zhuhai Beso | BA4022 | |
| Fast Green solution | Solarbio | G1371 | |
| Flow cytometer | Beckman Coulter | CytoFLEX | |
| Fluo-4 AM (calcium ion fluorescent probe) | Beyotime | S1060 | |
| GAPDH | Proteintech | 60004-1-Ig | AB_2107436 |
| Gel imaging system | Shanghai Peiqing Technology | JS-1070P | |
| Goat anti-mouse IgG, HRP-conjugated | ZSGB-BIO | ZB-2305 | |
| Goat anti-rabbit IgG, HRP-conjugated | ZSGB-BIO | ZB-2301 | |
| Goat serum | ZSGB-BIO | ZLI-9056 | |
| GraphPad Prism, version 10 | GraphPad Software | Not applicable | SCR_002798 |
| HC067047 | TargetMol | T4680 | |
| Hematoxylin solution | Zhuhai Beso | BA4041 | |
| HISAT2 | Johns Hopkins University | SCR_015530 | |
| IFT88 | Proteintech | 13967-1-AP | AB_2121979 |
| Image Lab software | Bio-Rad | Not applicable | SCR_003070 |
| Inverted microscope | Olympus | CKX31 | |
| Isopropanol | Sinopharm Chemical Reagent | SCR40007960 | |
| Light microscope | Olympus | CX41 | |
| Microtome | Leica | RM2016 | |
| NanoDrop 2000 | Thermo Fisher Scientific | ||
| New Zealand White rabbits (male, 6 months old, weighing 2.0–2.5 kg) | Nanjing Pukou District Laifu Breeding Farm | SCXK (Su) 2024-0007 | |
| Paraffin wax | Thermo Fisher Scientific | 8330 | |
| PBS | Hyclone | SH30256.01 | |
| PMSF | Beyotime | ST506 | |
| PrimeScript RT Reagent Kit with gDNA Eraser | TaKaRa | RR047A | |
| PVDF membrane | Millipore | IPVH00010 | |
| Ready-to-use HRP-conjugated mouse/rabbit secondary antibody | Fuzhou Maixin Biotech | KIT5030 | |
| Real-time PCR system | Thermo Fisher Scientific | PIKOREAL 96 | |
| RIPA lysis buffer (strong) | Beyotime | P0013B | |
| Trim Galore | Babraham Bioinformatics | SCR_011847 | |
| TRIzol | Life Technologies | 15596018CN |
参考文献
- Mobasheri A, Batt M. An update on the pathophysiology of osteoarthritis. Ann Phys Rehabil Med. 2016;59:333–339.
- Duong V, et al. Evaluation and treatment of knee pain: a review. JAMA. 2023;330:1568–1580.
- James SL, et al. Global, regional, and national incidence, prevalence, and years lived with disability for 354 diseases and injuries for 195 countries and territories, 1990–2017: a systematic analysis for the Global Burden of Disease Study 2017. Lancet. 2018;392:1789–1858.
- Cisternas MG, et al. Alternative methods for defining osteoarthritis and the impact on estimating prevalence in a US population-based survey. Arthritis Care Res (Hoboken). 2016;68:574–580.
- Tang S, et al. Osteoarthritis. Nat Rev Dis Primers. 2025;11:11.
- Kloppenburg M. Inflammation is a relevant treatment target in osteoarthritis. Lancet. 2023;402:1725–1726.
- Dong J, et al. CDDO-Im ameliorates osteoarthritis and inhibits chondrocyte apoptosis in mice via enhancing Nrf2-dependent autophagy. Acta Pharmacol Sin. 2022;43:1793–1802.
- Zhao X, et al. Targeting p21-positive senescent chondrocytes via IL-6R/JAK2 inhibition to alleviate osteoarthritis. Adv Sci (Weinh). 2025;12:2410795.
- Nguyen TD, et al. Calcium signaling dysregulation in rheumatoid arthritis: a comparative perspective with osteoarthritis. Autoimmun Rev. 2025;24:103923.
- Anastasia VP, et al. Connection between mitochondria and rheumatoid arthritis and osteoarthritis: personalized treatment strategies. Curr Pharm Des. 2026;32:651–665.
- Li Z, et al. IRE1-mTOR-PERK axis coordinates autophagy and ER stress-apoptosis induced by P2X7-mediated Ca2⁺ influx in osteoarthritis. Front Cell Dev Biol. 2021;9:695041.
- Liu Y, et al. Endoplasmic reticulum stress participates in the progress of senescence and apoptosis of osteoarthritis chondrocytes. Biochem Biophys Res Commun. 2017;491:368–373.
- Li Q, et al. Hyperglycemia-induced accumulation of advanced glycosylation end products in fibroblast-like synoviocytes promotes knee osteoarthritis. Exp Mol Med. 2021;53:1735–1747.
- Agarwal P, et al. A dysfunctional TRPV4–GSK3β pathway prevents osteoarthritic chondrocytes from sensing changes in extracellular matrix viscoelasticity. Nat Biomed Eng. 2021;5:1472–1484.
- O’Conor CJ, et al. Cartilage-specific knockout of the mechanosensory ion channel TRPV4 decreases age-related osteoarthritis. Sci Rep. 2016;6:29053.
- Zhang M, et al. TRPV4 and PIEZO channels mediate the mechanosensing of chondrocytes to the biomechanical microenvironment. Membranes (Basel). 2022;12:237.
- Ti H, et al. Primary cilia as mechanosensors in musculoskeletal homeostasis and disease. Pharmacol Res. 2025;219:107887.
- Hafsia N, et al. Galectin 3 deficiency alters chondrocyte primary cilium formation and exacerbates cartilage destruction via mitochondrial apoptosis. Int J Mol Sci. 2020;21:1486.
- Zhao Z, et al. Mechanotransduction pathways in the regulation of cartilage chondrocyte homoeostasis. J Cell Mol Med. 2020;24:5408–5419.
- Coveney CR, et al. Role of ciliary protein intraflagellar transport protein 88 in the regulation of cartilage thickness and osteoarthritis development in mice. Arthritis Rheumatol. 2022;74:49–59.
- Nakamoto H, et al. Involvement of transient receptor potential vanilloid channel 2 in the induction of lubricin and suppression of ectopic endochondral ossification in mouse articular cartilage. Arthritis Rheumatol. 2021;73:1441–1450.
- Dong ZR, et al. Ciliary IFT88 inhibits intervertebral disc degeneration under excessive mechanical stress by regulating endplate cartilage calcification. J Adv Res. 2026;81:157–173.
- Wang X, et al. Acupotomy for knee osteoarthritis: a systematic review protocol. Medicine (Baltimore). 2019;98:e17292.
- Anqi D, et al. Acupotomy for knee osteoarthritis: literature review and meta-analysis. J Back Musculoskelet Rehabil. 2026;39:34–52.
- Wang Y, et al. Acupotomy therapy for knee osteoarthritis: an overview of systematic reviews. Medicine (Baltimore). 2024;103:e39700.
- Hu J, et al. Acupotomy for musculoskeletal pain: exploring therapeutic potential and future directions. J Pain Res. 2025;18:3027–3036.
- Ma T, et al. Osthole suppresses knee osteoarthritis development by enhancing autophagy activated via the AMPK/ULK1 pathway. Molecules. 2022;27:8624.
- Xing L, et al. Acupotomy ameliorates articular cartilage fibrosis in a rabbit model of knee osteoarthritis via the TGF-β1/Smad pathway. Orthop Res Rev. 2026;18:597057.
- Videman T. Experimental osteoarthritis in the rabbit: comparison of different periods of repeated immobilization. Acta Orthop Scand. 1982;53:339–347.
- Lequesne MG, Samson M. Indices of severity in osteoarthritis for weight bearing joints. J Rheumatol Suppl. 1991;27:16–18.
- Costa R, et al. Kinin receptors sensitize TRPV4 channel and induce mechanical hyperalgesia: relevance to paclitaxel-induced peripheral neuropathy in mice. Mol Neurobiol. 2018;55:2150–2161.
- Zhang Y, et al. Primary cilium-mediated mechanotransduction in cartilage chondrocytes. Exp Biol Med (Maywood). 2023;248:1279–1287.
- Sun Y, et al. Primary cilia integrity governs TRPV4-mediated NF-κB/COL2 signaling in osteoarthritis pathogenesis. Cell Signal. 2025;136:112141.
- Wu S, et al. LIPUS regulates the progression of knee osteoarthritis in mice through primary cilia-mediated TRPV4 channels. Apoptosis. 2024;29:785–798.
- Xu B, et al. Excessive mechanical stress induces chondrocyte apoptosis through TRPV4 in an anterior cruciate ligament-transected rat osteoarthritis model. Life Sci. 2019;228:158–166.
- Lin Z, et al. Echinacoside upregulates Sirt1 to suppress endoplasmic reticulum stress and inhibit extracellular matrix degradation in vitro and ameliorates osteoarthritis in vivo. Oxid Med Cell Longev. 2021;2021:3137066.
- An X, et al. Chondroprotective effects of combination therapy of acupotomy and human adipose mesenchymal stem cells in knee osteoarthritis rabbits via the GSK3β-cyclin D1-CDK4/CDK6 signaling pathway. Aging Dis. 2020;11:1116–1132.