This protocol aims to integrate serial albumin, prealbumin, and transferrin trajectories with fluid responsiveness, perfusion, and fluid balance indicators to classify dynamic risk phenotypes and to standardize fluid reassessment and nutritional evaluation during early sepsis resuscitation.
方法文章
A Visual Protocol Integrating Dynamic Albumin, Prealbumin, and Transferrin Trajectories into Fluid and Nutritional Reassessment in Sepsis
本文内容
摘要
摘要
This study developed a visual management approach for early fluid resuscitation in sepsis based on dynamic stratification of albumin, prealbumin, and transferrin. The retrospective analysis included 100 patients after propensity score matching. Measurements of the three proteins at T0, T6, T24, and T72 were considered together with fluid exposure, fluid responsiveness, and tissue perfusion indicators to derive a composite score and dynamic phenotypes; these results were then used to standardize reassessment, fluid management, and nutritional evaluation. Compared with conventional management, visual management showed numerically lower additional crystalloid administration during 3–6 h and total intravenous input during 0–24 h (median difference −6.70 mL/kg, 95% confidence interval −18.20 to 2.30; adjusted p = 0.091), as well as more frequent fluid-responsiveness assessments and an earlier first assessment, although none of these comparisons remained statistically significant after multiplicity adjustment. The prealbumin group-by-time interaction did not remain statistically significant after adjustment for multiplicity, and the composite-score findings were not interpreted due to unresolved scoring discrepancies. The visual management group had higher lactate clearance at 24 h in the exploratory 95-comparison Bonferroni sensitivity analysis (adjusted p = 0.040), whereas net fluid-balance differences at 24 h and 72 h did not remain statistically significant. Time to the resuscitation target was not significantly different in the 24 h censored Cox analysis (hazard ratio 1.509, 95% confidence interval 0.948–2.403; Bonferroni-adjusted p = 0.166), and no statistically significant differences were identified in organ-support requirements or mortality. This approach may offer a standardized framework for fluid reassessment and nursing decisions after initial resuscitation, although its clinical value requires confirmation in prospective, multicenter studies.
引言
Sepsis is a clinical syndrome in which infection induces a dysregulated host response and subsequent organ dysfunction. Early intravenous fluid resuscitation can expand effective circulating volume and restore tissue perfusion, but the balance between benefit and risk must be reconsidered as resuscitation proceeds1. Patients with sepsis and septic shock are also prone to fluid accumulation; persistent or excessive fluid administration may worsen fluid retention and has been associated with new-onset organ dysfunction and adverse outcomes2. Fluid therapy has therefore shifted from fixed-volume infusion toward repeated assessment that integrates blood pressure, lactate clearance, capillary refill time, and dynamic measures of fluid responsiveness3. Nutritional and metabolic status, however, has received less attention during this process. Severe infection can rapidly induce hypercatabolism, accelerate skeletal muscle protein breakdown, and produce negative nitrogen balance, leading to continued depletion of body protein stores4: albumin contributes to the maintenance of colloid osmotic pressure and the transport of numerous substances; prealbumin has a shorter half-life and may reflect short-term changes more rapidly; transferrin is synthesized mainly in the liver and participates in systemic iron homeostasis5,6,7. All three are affected by inflammation, hepatic function, hemodilution, and capillary leakage and cannot independently establish a diagnosis of malnutrition, but when measurement times and recent fluid exposure are clearly documented, serial evaluation of the direction, magnitude, and recovery of change may provide useful context for interpreting the overlapping effects of nutritional depletion, inflammation, and fluid redistribution.
Previous studies have often measured albumin or calculated the prognostic nutritional index to assess mortality risk and clinical outcomes in patients with sepsis8,9. Such static assessments may confound pre-existing nutritional deficiency, acute inflammatory consumption, dilutional effects, and hypoproteinemia caused by extravascular leakage; they are also difficult to apply directly to early resuscitation. In routine nursing records, nutrition-related proteins are generally presented as isolated values, without standardized retesting times, calculations of change, phenotype definitions, or intervention triggers, leaving nutritional assessment disconnected from fluid management.
Against this background, this study sought to establish a visual management approach based on dynamic stratification of albumin, prealbumin, and transferrin. After blood collection and testing at predefined time points, patients were classified as having a stable, rapid-depletion, delayed-recovery, or persistent-deterioration phenotype according to the baseline levels, direction and magnitude of change, and duration of abnormality across the three indicators. These phenotypes did not independently determine fluid administration; instead, they were displayed alongside fluid responsiveness, lactate clearance, capillary refill time, urine output, net fluid balance, and organ function. Nurses used the combined information to adjust reassessment frequency and to make standardized choices among continuing fluid administration, slowing or pausing infusion, requesting vasopressor evaluation, and initiating nutritional support consultation; subsequent results were then returned to the stratification interface, creating a dynamic management loop. The method does not replace hemodynamic monitoring with protein measurements. Rather, three proteins with different turnover characteristics are used to supplement the assessment of perfusion recovery, protein metabolic changes, and fluid-burden risk, thereby providing additional support for nursing care in patients with sepsis.
方案
This single-center retrospective case-control study was approved by the institutional medical ethics committee (No. KY20230829-03) and included clinical records from January 1, 2023, to April 30, 2026. All data were de-identified before analysis, and the requirement for written informed consent was waived. All the materials used are listed in the Table of Materials.
1. Establish the study cohort
- Screen the study population
- Search the electronic medical records of the emergency intensive care unit (ICU) and general ICU, and include patients aged ≥18 years who meet the Sepsis-3 criteria, defined as an infection-related increase of ≥2 points in the Sequential Organ Failure Assessment (SOFA) score from baseline10, and who begin resuscitation monitoring within 3 h after sepsis is recognized.
- Define the first documented recognition of sepsis and initiation of resuscitation monitoring as T0; define 6 ± 1 h, 24 ± 2 h, and 72 ± 6 h after T0 as T6, T24, and T72, respectively.
- Require albumin, prealbumin, and transferrin measurements at T0, T6, T24, and T72, together with extractable data on fluid input, urine output, lactate, mean arterial pressure (MAP), vasoactive medications, and organ function during the first 72 h.
- Exclude patients who are pregnant or have decompensated cirrhosis, nephrotic syndrome, extensive burns, active major bleeding, inherited disorders of protein metabolism, or end-stage malignancy; also exclude those who received albumin, plasma, or > 4 U of packed red blood cells within 24 h before T0, as well as cases in which out-of-hospital fluid resuscitation lasted > 6 h, key time points could not be confirmed, or > 20% of core variables were missing.
- Complete grouping and matching
- Classify patients into the visual management group or conventional management group according to whether the dynamic protein-stratification interface and the accompanying fluid-resuscitation pathway were actually used, as documented in the nursing records.
- Calculate propensity scores using age, sex, body mass index, source of infection, septic shock, baseline lactate, SOFA score, the three protein measurements, and major comorbidities.
- Perform 1:1 nearest-neighbor matching with the caliper width set at 0.20 times the standard deviation of the propensity-score logit, retaining 50 patients in each group. The final analytical datasets are shown in Figure 1.
- Calculate the absolute standardized difference for each covariate after matching. Report the available post-matching baseline measurements and their absolute standardized differences in Supplementary Table 1; these measurements do not establish balance for age, sex, body mass index, infection source, septic shock, or comorbidities, for which complete matching diagnostics could not be verified.
- Regard an absolute standardized difference < 0.10 as indicating adequate balance for the corresponding measured covariate; if more than 50 matched pairs are available, retain those with smaller matching distances.
2. Extract baseline and nutritional data
- Record age, sex, body mass index, source of infection, septic shock, and comorbidities, including hypertension, diabetes mellitus, chronic heart failure, chronic kidney disease, and chronic respiratory disease.
- Extract vital signs at T0, the Acute Physiology and Chronic Health Evaluation (APACHE) score, SOFA score, mechanical ventilation status, vasoactive medication use, renal replacement therapy, and source-control status.
- Record the Nutritional Risk Screening 2002 (NRS 2002) score11, recent weight loss, reduced food intake, dysphagia, and gastrointestinal dysfunction.
- Record the time of enteral nutrition initiation, prescribed and actual energy and protein intake, duration of feeding interruption, and gastrointestinal intolerance from T0 to T72.
- Calculate the proportions of patients meeting energy and protein targets at 24 h and 72 h.
3. Verify nutrition-related protein testing
- Measure all three proteins using an automated biochemical analyzer (Roche); determine albumin with the bromocresol green method.
- Measure prealbumin and transferrin by immunoturbidimetry using the corresponding reagents (Roche); use the reference intervals valid in the clinical laboratory during the study period, and do not transfer fixed thresholds directly between analytical platforms.
- Extract the volumes of crystalloids, colloids, albumin, plasma, and packed red blood cells administered during the 6 h preceding each blood collection; retain patients who receive albumin or blood products after baseline, and flag the possible influence of exogenous protein at subsequent time points.
- Concurrently record C-reactive protein, procalcitonin, hemoglobin, hematocrit, total bilirubin, alanine aminotransferase, and creatinine to assist in evaluating the effects of inflammation, dilution, and hepatic or renal function on the measurements.
4. Perform dynamic protein stratification
- Create fields for patient identification number, time point, the three protein measurements, local lower reference limits, relative rates of change, individual scores, composite score, risk category, and dynamic phenotype in spreadsheet software (Microsoft Excel).
- Calculate changes at T6, T24, and T72 relative to baseline as "(current value - T0 value)/T0 value × 100%".
- Assign 0 points when the ratio of the measured value to the lower reference limit is ≥ 0.80, and the value has decreased by < 5%; assign 1 point when the ratio is 0.60 to < 0.80 or the value has decreased by 5–15%; assign 2 points when the ratio is < 0.60 or the value has decreased by > 15%.
NOTE: These cutoffs are study-specific operational rules that combine the absolute deficit relative to the local reference limit with the magnitude of change from T0; they are not externally validated prognostic cutoffs or independent treatment thresholds. - If the absolute level and magnitude of change correspond to different categories, use the higher score. Add the three individual scores, and define totals of 0–1, 2–3, and 4–6 as low, moderate, and high risk, respectively.
- Apply the phenotype definitions in the following order to maintain mutually exclusive categories.
- Assign a final phenotype only when the measurements required to apply the full precedence order are available; at earlier time points, display only provisional patterns supported by the results available at that time, and request manual review when no defined category applies.
- Classify a persistent-deterioration phenotype when at least two proteins remain in the high-risk range at T72 or continue to decrease by >5% between T24 and T72.
- Classify a delayed-recovery phenotype when early rapid depletion is followed, between T24 and T72, by an increase of >10% from the nadir in at least two proteins and a decrease of ≥2 points in the composite score
- Classify a rapid-depletion phenotype when at least two proteins decrease by >10% at T6, at least two decrease by >15% at T24, or the composite score increases by ≥2 points from T0.
- Classify the remaining patients as having a stable phenotype when the composite score increases by ≤1 point at T6 and T24 and no two proteins simultaneously decrease by >10%.
5. Implement visual fluid-resuscitation nursing care
- For patients at low risk who show positive fluid responsiveness, continue resuscitation as prescribed and reassess circulatory and perfusion status at least every 1 h. Once the resuscitation target has been reached, reduce the monitoring frequency as appropriate.
- For patients at moderate risk, limit each fluid challenge to 250–500 mL, reassess circulatory and respiratory status immediately after infusion, and complete a nutritional evaluation or consultation within 24 h.
- For patients at high risk or with a rapid-depletion or persistent-deterioration phenotype, assess fluid responsiveness before each additional fluid administration and reassess within 15–30 min; if fluid responsiveness is negative, or if pulmonary edema, worsening hypoxemia, or venous congestion develops, pause further fluid administration and report the findings to the physician.
- Record the timing, triggering indicators, and outcomes of continuing fluid administration, slowing infusion, pausing fluid administration, requesting vasopressor evaluation, initiating nutritional consultation, and escalating nursing care.
- Use balanced crystalloids preferentially when prescribed and control the infusion rate with an infusion pump (B. Braun); record the volumes of crystalloids, colloids, blood products, medication diluents, and nutritional fluids administered during 0–3 h, 3–6 h, 6–24 h, and 24–72 h.
- Record urine output hourly and calculate cumulative net fluid balance at 24 h and 72 h; if signs of fluid overload appear, request physician evaluation of fluid restriction, diuretic therapy, or renal replacement therapy.
- When the circulation is becoming stable, the vasoactive medication dose is not continuing to increase, and no clear gastrointestinal contraindication is present, initiate enteral nutrition at 10–20 mL/h using a feeding pump (Fresenius Kabi), then increase the rate gradually according to gastrointestinal and circulatory tolerance.
- Include nutritional formula, tube-flushing fluid, and medication diluents in total fluid input; if the protein measurements continue to decline, review nutritional intake, progression of inflammation, hemodilution, abnormal liver function, and protein loss in sequence.
- Sepsis-related specialized nursing care
- Verify the collection times of blood cultures and specimens from the suspected infection site, and monitor for allergic reactions, hypotension, and other adverse events during antimicrobial infusion; continue temperature monitoring, and provide appropriate care for wounds, drainage tubes, and vascular catheters as part of infection-source control.
- Provide positioning, airway humidification and suctioning, prone-position ventilation care, and oxygen-therapy monitoring for patients with respiratory failure; reassess fluid burden immediately if oxygenation worsens, airway pressure rises, or pulmonary crackles increase.
- For patients with gastrointestinal bleeding, provide gastrointestinal decompression during fasting, administer acid-suppressive therapy, and monitor the characteristics of gastric contents and stool; resume enteral nutrition gradually once bleeding has been controlled and the circulation has stabilized.
- For patients with acute heart failure, intensify monitoring of fluid intake and output, positioning, electrocardiographic findings, and diuretic response; for patients with drug overdose, provide gastric lavage, observation during antidotal therapy, and blood-purification circuit care as indicated. The detailed grading criteria and corresponding interventions are summarized in Table 1.
6. Conventional management group
- Provide monitoring and fluid resuscitation according to current sepsis treatment and nursing procedures, continuously recording blood pressure, heart rate, oxygen saturation, lactate, capillary refill time, urine output, and fluid intake and output; adjust crystalloid administration, vasoactive medications, and other supportive treatments according to medical orders.
- Reassess volume status according to routine clinical judgment; if hypoxemia worsens, pulmonary crackles increase, urine output decreases, or positive fluid balance increases, promptly report the findings to the physician and assist with further management.
- Provide nutritional evaluation and enteral-nutrition care according to routine nutritional risk screening, without using the dynamic protein-stratification interface, composite score, or phenotype-driven reassessment pathway.
7. Study outcomes
- Define the two primary outcomes as cumulative intravenous fluid input during 0–24 h and time to first achievement of the resuscitation target, analyzed with follow-up administratively censored at 24 h.
- Define the resuscitation target as MAP ≥65 mmHg without an increase in vasoactive medication during the preceding 2 h, capillary refill time ≤3 s, urine output ≥0.5 mL/kg/h for 2 consecutive h, and either a lactate reduction of ≥20% or a lactate concentration <2 mmol/L.
- Compare albumin, prealbumin, transferrin, composite score, risk category, and phenotype distribution at T0, T6, T24, and T72.
- Record fluid input during each period, the number and timing of fluid-responsiveness assessments, and the distribution of decisions to continue, slow, or pause fluid administration or request vasopressor evaluation.
- Record the rate of nutritional consultation, time to enteral-nutrition initiation, and the proportions of patients meeting energy and protein targets at 24 h and 72 h.
- Extract MAP, lactate, lactate clearance, capillary refill time, hourly urine output, net fluid balance at 24 h and 72 h, and SOFA score.
- Record fluid overload, pulmonary edema, worsening hypoxemia, acute kidney injury, duration of mechanical ventilation, ICU length of stay, and 28 d mortality; define marked fluid overload as a cumulative positive fluid balance at 72 h equivalent to ≥10% of baseline body weight.
- Evaluate protocol implementation quality
- Calculate the completion rate of testing for the three proteins within the predefined time windows, the time from blood collection to reporting, the time from reporting to completion of stratification, classification accuracy, and the manual-review rate.
- Calculate the completion rate of nursing interventions, protocol adherence, and the protocol-deviation rate. Record reasons for deviation, including delayed testing, missing data, interface malfunction, clinical urgency, and individualized medical decisions.
- Randomly select 20% of cases and ask two nurses to independently evaluate the composite score, dynamic phenotype, and nursing response. Record disagreements and the final adjudication.
8. Statistical analysis
- Perform the original analyses using IBM SPSS Statistics 27 and reproduce the revised analyses using Python with NumPy and SciPy; retain a complete list of the statistical hypotheses and multiplicity adjustments.
- Use Welch's t test for normally distributed continuous variables and for SOFA scores analyzed on a continuous scale; use the two-sided Mann–Whitney U test with tie and continuity corrections for the remaining skewed or ordinal variables, reporting its standardized Z value.
- Accompany mean differences with Welch 95% confidence intervals and median differences with percentile 95% confidence intervals from 20,000 within-group patient bootstrap samples.
- Compare categorical variables using Pearson's χ2 test; use the Fisher–Freeman–Halton exact test when expected cell counts are insufficient, and report absolute risk differences with Newcombe 95% confidence intervals for binary outcomes. The present specimen-level testing process measures descriptively.
- Analyze repeated measurements of albumin, prealbumin, transferrin, MAP, lactate, capillary refill time, hourly urine output, and SOFA score using Gaussian identity-link generalized estimating equations (GEEs) with an exchangeable working correlation structure and patient-clustered sandwich standard errors, using available observations without imputation or weighting for missingness.
- Include group, categorical time, and the group-by-time interaction in each model; log-transform prealbumin, lactate, and urine output before analysis, evaluate the interaction with an omnibus Wald test, and summarize group and time effects using marginal contrasts.
- Compare directional concordance using Pearson's χ2 test, defining T24–T72 changes as concordant in the reanalysis when all three protein changes are non-negative, or all three are non-positive; withhold interpretation of risk-category distributions, phenotype composition, and risk migration until the scores and classifications have been reconciled with the stated rules.
- Analyze repeated resuscitation-decision events using multinomial logistic regression with patient clusters defined by group and the within-group patient identifier, applying a finite-sample correction to the sandwich covariance; analyze time to the resuscitation target using an unadjusted Cox proportional hazards model with Efron handling of ties, model-based standard errors, and administrative censoring at 24 h, and assess a group-by-log-time interaction within event-time risk sets using a one-degree-of-freedom likelihood-ratio test as a proportional-hazards diagnostic.
Compare fluid overload, pulmonary edema, hypoxemia, acute kidney injury, renal replacement therapy, mechanical ventilation, and mortality using Pearson's χ2 test or an exact test, as appropriate. - Analyze the duration of mechanical ventilation and ICU length of stay using the Mann-Whitney U test.
- Apply Bonferroni correction to the two primary-outcome tests at a familywise two-sided α of 0.05, and conduct a revision-stage Bonferroni sensitivity analysis across 95 secondary hypotheses, including all longitudinal time-point contrasts and retaining the original score-related hypotheses in the multiplicity count without interpreting unverified score effects; duplicate complementary tests, specimen-workflow comparisons, and the uncensored time-to-target rank test are excluded.
NOTE: The 95% confidence intervals describe precision without multiplicity adjustment, and the patient-level comparisons do not account for matched-pair dependence because pair identifiers were unavailable for the reproducibility analysis.
结果
Nutrition-related protein testing process
Valid protein results were obtained within the planned time windows for 193/200 (96.50%) and 189/200 (94.50%) scheduled measurements, respectively; the median intervals from blood collection to centrifugation, initiation of analysis, and result reporting were 24.00, 56.00, and 78.00 min in both groups. Results were reported within 90 min for 186/193 (96.37%) and 180/189 (95.24%) specimens, while valid results were obtained on the first analysis for 189/193 (97.93%) and 185/189 (97.88%), respectively; these specimen-level measures are presented descriptively (Table 2).
Protein trajectories and risk stratification
The group-by-time interactions for albumin, prealbumin, and transferrin were not statistically significant in the conservative 95-comparison Bonferroni sensitivity analysis. At T72, median prealbumin was 106.50 mg/L in the visual management group and 86.00 mg/L in the conventional management group, a descriptive difference that did not remain statistically significant after multiplicity adjustment. Composite-score and risk-category comparisons are not interpreted as valid inferential findings because the recorded scores could not be fully reconciled with the stated scoring rules. No significant between-group difference was observed in directional concordance from T24 to T72 (33/46 [71.74%] versus 30/44 [68.18%]; adjusted p = 1.000), while phenotype and risk-migration comparisons were not interpreted because the underlying classifications remained unreconciled (Figure 2).
Fluid input and resuscitation decisions
Crystalloid input during 0–3 h was similar between groups (29.40 ± 10.60 versus 30.10 ± 11.00 mL/kg; mean difference −0.70 mL/kg, 95% CI −4.99 to 3.59); the visual management group had numerically lower additional crystalloid input during 3–6 h (median difference −2.75 mL/kg, 95% CI −5.60 to −0.40) and total intravenous input during 0–24 h (median difference −6.70 mL/kg, 95% CI −18.20 to 2.30), but neither difference remained statistically significant under the relevant multiplicity correction (Supplementary Table 2). Fluid responsiveness was assessed more often within 24 h in the visual management group (median difference 1.00 assessment, 95% CI 0.00–2.00), and the first assessment occurred earlier (median difference −23.00 min, 95% CI −42.50 to −7.00), although neither comparison remained statistically significant after multiplicity adjustment (adjusted p = 0.293 and 0.363, respectively). Reassessment within 30 min after a fluid challenge was completed in 42/50 (84.00%) and 31/50 (62.00%) patients, respectively (risk difference 22.00 percentage points, 95% CI 4.57–37.83; Bonferroni-adjusted p = 1.000); the patient-clustered distribution of resuscitation decisions was also not statistically different after adjustment (unadjusted Wald χ2 = 6.838, p = 0.077; adjusted p = 1.000) (Figure 3).
Implementation of the nursing pathway
In the visual management group, pathway initiation within 1 h and clinical response within 30 min after an alert were recorded for 43/50 (86.00%) and 41/50 (82.00%) patients, respectively; agreement with expert risk-category review was recorded for 47/50 (94.00%), while 13/50 (26.00%) underwent at least one manual review, but these process records do not establish reproducible scoring or prognostic validity. Completion rates for the required reassessment after a fluid challenge and for the standardized nutritional evaluation within 24 h were numerically higher under visual management, but neither comparison remained statistically significant after adjustment for multiple testing. Fluid intake and output records were complete in 46/50 (92.00%) and 41/50 (82.00%) patients, respectively (risk difference 10.00 percentage points, 95% CI −3.61 to 23.68; Bonferroni-adjusted p = 1.000) (Table 3).
Perfusion indicators, fluid balance, and the resuscitation target
The group-by-time interactions for MAP, lactate, and hourly urine output were not statistically significant after multiplicity adjustment; lactate clearance at 24 h was 56.05% and 45.30%, respectively (median difference 10.75 percentage points, 95% CI 1.65–19.25; Bonferroni-adjusted p = 0.040). Capillary refill time at T24 was 2.50 s and 2.90 s, respectively, but neither the time-point comparison nor its group-by-time interaction remained statistically significant after multiplicity adjustment. The group-by-time interaction for the SOFA score was not statistically significant after multiplicity adjustment. In the Cox model with administrative censoring at 24 h, 39 and 33 patients achieved the target and 11 and 17 were censored, respectively; the difference was not statistically significant (hazard ratio [HR] = 1.509, 95% confidence interval [CI] 0.948–2.403; unadjusted p = 0.083, Bonferroni-adjusted p = 0.166), and the group-by-log-time likelihood-ratio diagnostic did not detect departure from proportional hazards (χ2 = 1.007, df = 1, p = 0.316) (Figure 4).
Safety and clinical outcomes
No statistically significant between-group differences were observed in marked fluid overload, new or worsening pulmonary edema, new or worsening hypoxemia, acute kidney injury, organ-support requirements, ICU length of stay, or mortality (Table 4). For 28-day mortality, the absolute risk difference was −6.00 percentage points (95% CI −21.74 to 10.06); the wide interval does not exclude clinically important benefit or harm.
DATA AVAILABILITY:
The raw data used in this study have been uploaded as Supplementary Table 3.
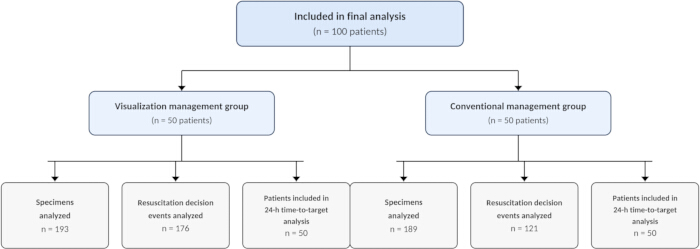
Figure 1: Flow diagram of the study groups and analytical datasets. The diagram summarizes the final 100-patient cohort, with 50 patients per group, together with 193 and 189 specimens and 176 and 121 resuscitation-decision events. It presents the final analytical datasets rather than a complete pre-matching screening flow. Please click here to view a larger version of this figure.
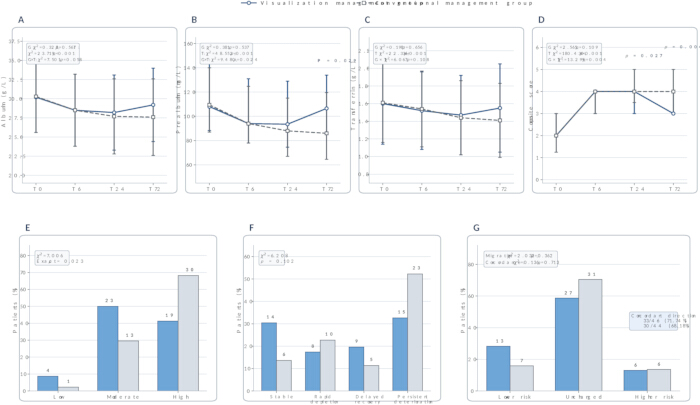
Figure 2: Longitudinal trajectories of nutritional protein biomarkers, composite scores, risk strata, and dynamic phenotypes. (A) Serum albumin levels from T0 to T72 (g/L); (B) serum prealbumin levels from T0 to T72 (mg/L); (C) serum transferrin levels from T0 to T72 (g/L); (D) composite nutritional protein scores from T0 to T72 (points); (E) distribution of nutritional protein risk strata at T72; (F) distribution of dynamic nutritional protein phenotypes; (G) transition in nutritional protein risk strata from T24 to T72 and directional concordance among the three nutritional proteins. Albumin and transferrin are shown as mean ± standard deviation, and prealbumin as median with first and third quartiles; available patient numbers (visual/conventional) are 50/50, 49/48, 48/47, and 46/44 at T0, T6, T24, and T72, respectively. Panels D–F and the risk-transition component of G show unreconciled recorded classifications and cannot establish scoring validity; directional concordance is independently reproducible when the three T24–T72 changes are all non-negative or all non-positive. Please click here to view a larger version of this figure.
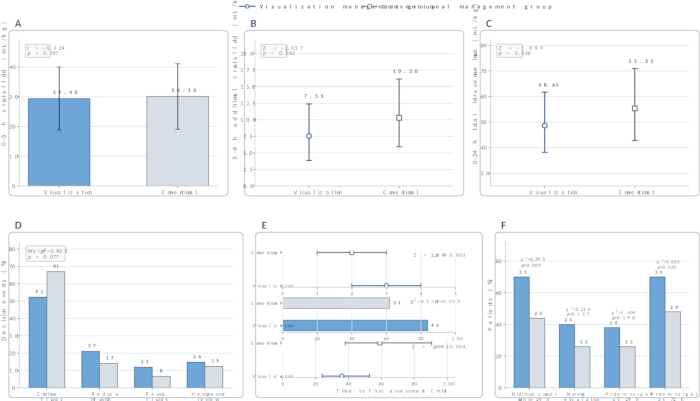
Figure 3: Fluid administration, resuscitation decision-making, volume-responsiveness assessment, and nutritional care. (A) Crystalloid volume administered from 0 to 3 h (mL/kg; mean ± standard deviation); (B) additional crystalloid volume administered from 3 to 6 h (mL/kg; median and first and third quartiles); (C) total intravenous fluid input from 0 to 24 h (mL/kg; median and first and third quartiles); (D) distribution of resuscitation decision events, with percentages calculated from 176 and 121 events, respectively; (E) number of volume-responsiveness assessments within 24 h (count), completion of reassessment within 30 min after a fluid challenge (%), and time to the first volume-responsiveness assessment (min), displayed on separate labeled axes; (F) nutrition consultation within 24 h, nursing escalation, and achievement of protein intake targets at 24 and 72 h, with percentages based on 50 patients per group. Bonferroni correction for the two primary outcomes applies to panel C; the other inferential comparisons use the secondary sensitivity analysis. Please click here to view a larger version of this figure.
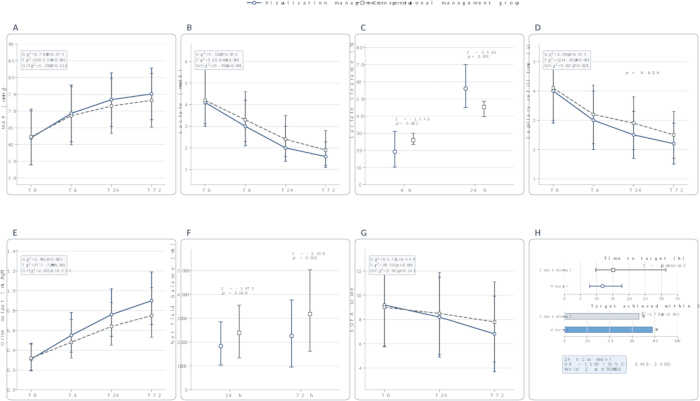
Figure 4: Longitudinal changes in perfusion, fluid balance, organ dysfunction, and resuscitation target attainment. (A) Mean arterial pressure from T0 to T72 (mmHg); (B) serum lactate levels from T0 to T72 (mmol/L); (C) lactate clearance at 6 and 24 h (%); (D) capillary refill time from T0 to T72 (s); (E) hourly urine output from T0 to T72 (mL/kg/h); (F) net fluid balance at 24 and 72 h (mL); (G) Sequential Organ Failure Assessment scores at T0, T24, and T72 (points); (H) time to achievement of the resuscitation target (h), analyzed with administrative censoring at 24 h, and proportion of patients achieving the target within 24 h. MAP, capillary refill time, and SOFA are summarized as mean ± standard deviation; lactate, lactate clearance, urine output, and fluid balance are summarized as medians with first and third quartiles. The time-to-event analysis includes 39 and 33 events among 50 patients per group, with 11 and 17 patients censored at 24 h, respectively. Please click here to view a larger version of this figure.
| Module | Final classification criteria | Nursing implications |
| Albumin dynamic score | A measured value/lower reference limit ratio ≥ 0.80 and a decrease from T0 of < 5% is scored 0; a ratio of 0.60 to < 0.80 or a decrease of 5%–15% is scored 1; a ratio < 0.60 or a decrease > 15% is scored 2. If the level and change criteria differ, use the higher score. | Interpret in conjunction with fluid volume, liver function, hemodilution, and capillary leakage. |
| Prealbumin dynamic score | Apply the same 0–2 point criteria, focusing on short-term changes at T6 and T24. | May provide additional information on acute-phase reprogramming of protein synthesis and changes in nutritional risk. |
| Transferrin dynamic score | Apply the same 0–2 point criteria and interpret the results in the context of inflammation, liver function, and iron metabolism. | May provide a complementary view of the acute-phase response and changes in protein distribution. |
| Composite risk category | A total score of 0–1 indicates low risk, 2–3 indicates moderate risk, and 4–6 indicates high risk. | Guides the frequency of reassessment, timing of nutrition consultation, and intensity of nursing monitoring alongside hemodynamic and perfusion findings. |
| Dynamic phenotype | Classify persistent deterioration first, followed sequentially by delayed recovery, rapid depletion, and stable phenotype, to ensure that the categories are mutually exclusive; apply the final classification only when the measurements required for the full precedence order are available. | Prevents a patient from being assigned to more than one dynamic phenotype; incomplete or unclassified patterns require manual review. |
| Manual review | Initiate when the change in any individual marker is > 30%, the directions of change in the three markers are discordant, or the results are inconsistent with fluid exposure and the clinical presentation. | Verify blood sampling time, assay quality, exogenous protein administration, liver function, and fluid input. |
Table 1: Dynamic scoring of the three nutritional proteins, phenotype classification, and nursing response rules. The table specifies study-specific individual protein scores, composite categories, phenotype precedence, and manual review rules. These rules guide reassessment alongside hemodynamic and perfusion findings and are not validated prognostic or treatment thresholds; the table does not establish that the recorded classifications were calculated correctly.
| Indicator | Visual management | Conventional management |
| Valid nutritional protein results obtained within the scheduled time windows | 193/200 (96.50%) | 189/200 (94.50%) |
| Time from blood collection to centrifugation, min | 24.00 (18.00, 33.00) | 24.00 (18.00, 33.00) |
| Time from blood collection to initiation of analysis, min | 56.00 (44.00, 72.00) | 56.00 (44.00, 72.00) |
| Time from blood collection to result reporting, min | 78.00 (61.00, 86.00) | 78.00 (61.00, 86.00) |
| Result reported within 90 min | 186/193 (96.37%) | 180/189 (95.24%) |
| Valid result obtained on initial analysis | 189/193 (97.93%) | 185/189 (97.88%) |
| Retesting required | 4/193 (2.07%) | 4/189 (2.12%) |
| Final valid result after retesting | 193/193 (100.00%) | 189/189 (100.00%) |
| Analytical batches involved | 18 | 18 |
Table 2: Testing workflow and data quality. The table summarizes the completeness of scheduled testing, processing, and reporting intervals, initial analysis validity, and retesting. Values are n/N (%) or median (first quartile, third quartile); denominators are 200 planned measurements per group and 193 and 189 processed specimens in the visual and conventional management groups, respectively. Specimen-level workflow measures are presented descriptively because repeated specimens could not be reliably linked to individual patients.
| Indicator | Visual management | Conventional management | Difference (95% CI) | Adjusted p |
| Complete dynamic phenotype classification available | 46/50 (92.00%) | 44/50 (88.00%) | Descriptive availability | 1 |
| Supportive pathway initiated within 1 h after risk result generation | 43/50 (86.00%) | N/A | Not applicable | Not applicable |
| Clinical response completed within 30 min after an alert | 41/50 (82.00%) | N/A | Not applicable | Not applicable |
| Recorded agreement between automated risk category and expert review | 47/50 (94.00%) | N/A | Not applicable | Not applicable |
| At least one manual review initiated | 13/50 (26.00%) | N/A | Not applicable | Not applicable |
| Required reassessment completed after a fluid challenge | 42/50 (84.00%) | 33/50 (66.00%) | 18.00 (0.96 to 33.83) pp | 1 |
| Complete fluid intake and output records | 46/50 (92.00%) | 41/50 (82.00%) | 10.00 (−3.61 to 23.68) pp | 1 |
| Standardized nutritional assessment completed within 24 h | 38/50 (76.00%) | 27/50 (54.00%) | 22.00 (3.30 to 38.71) pp | 1 |
| Adherence to the visualization nursing pathway, % | 83.90 (73.68, 96.38) | N/A | Not applicable | Not applicable |
Table 3: Protocol implementation quality, safety, and clinical translation evaluation. The table summarizes pathway implementation, recorded classification review, and nursing processes. Values are n/N (%) or median (first quartile, third quartile); between-group differences for binary outcomes are risk differences in percentage points (pp), with Newcombe 95% confidence intervals unadjusted for multiplicity and matched-pair dependence, and adjusted p values use the 95-comparison sensitivity analysis. Measures specific to the visual pathway are not applicable to conventional management; recorded expert agreement and classification completeness do not establish the validity of scoring.
| Outcome | Visual management | Conventional management | Difference (95% CI) | Adjusted p |
| Marked fluid overload | 7 (14.00%) | 13 (26.00%) | −12.00 (−27.28 to 3.85) pp | 1 |
| New or worsening pulmonary edema | 6 (12.00%) | 10 (20.00%) | −8.00 (−22.52 to 6.70) pp | 1 |
| New or worsening hypoxemia | 8 (16.00%) | 13 (26.00%) | −10.00 (−25.57 to 6.10) pp | 1 |
| Acute kidney injury | 15 (30.00%) | 20 (40.00%) | −10.00 (−27.60 to 8.51) pp | 1 |
| Received renal replacement therapy | 5 (10.00%) | 7 (14.00%) | −4.00 (−17.43 to 9.37) pp | 1 |
| Received invasive mechanical ventilation | 31 (62.00%) | 32 (64.00%) | −2.00 (−20.23 to 16.42) pp | 1 |
| Duration of mechanical ventilation, d | 5.50 (3.00, 8.50), n = 31 | 6.50 (4.03, 10.00), n = 32 | −1.00 (−4.70 to 1.55) d | 1 |
| ICU length of stay, d | 7.50 (4.95, 11.00) | 9.00 (6.00, 12.95) | −1.50 (−4.50 to 1.45) d | 1 |
| In-hospital mortality | 8 (16.00%) | 11 (22.00%) | −6.00 (−21.30 to 9.56) pp | 1 |
| 28-day mortality | 9 (18.00%) | 12 (24.00%) | −6.00 (−21.74 to 10.06) pp | 1 |
Table 4: Safety outcomes and clinical outcomes. The table reports fluid-related complications, organ-support requirements, ICU length of stay, and mortality. Values are n (%) or median (first quartile, third quartile); each group includes 50 patients, except ventilation duration, which includes 31 and 32 ventilated patients. Effects are risk differences in percentage points for binary outcomes and median differences in days for durations, with Newcombe and percentile-bootstrap 95% confidence intervals, respectively; intervals are unadjusted for multiplicity and matched-pair dependence, and adjusted p values use the 95-comparison sensitivity analysis. Non-significance does not demonstrate equivalence or safety.
Supplementary Table 1: Available baseline measurements in the retained post-matching cohort.Please click here to download this file.
Supplementary Table 2: Primary outcomes and selected exploratory effect estimates.Please click here to download this file.
Supplementary Table 3: Raw data for this study. The workbook contains 100 patient-level records, 382 specimen-level testing records, and 297 resuscitation-decision events. Patient-level analyses use available observations; specimen linkage and score derivations require reconciliation before they can support the affected analyses.Please click here to download this file.
讨论
This study developed a visual management protocol based on serial changes in albumin, prealbumin, and transferrin and incorporated dynamic protein stratification into nursing reassessment after early fluid resuscitation for sepsis. Crystalloid input during the first 3 h was similar between groups; later, numerical differences in fluid input, net fluid balance, and reassessment measures did not remain statistically significant under the conservative multiplicity analysis. The prealbumin interaction did not remain statistically significant after multiplicity adjustment, and the unresolved score-derivation discrepancies preclude claims that the composite score or risk categories provide validated additional information. Nevertheless, the overall distribution of resuscitation decisions, achievement of the resuscitation target within 24 h, the Cox model, organ-support requirements, and mortality outcomes showed no statistically significant between-group differences. Given the single-center retrospective design, these findings indicate associations between visual management, the reassessment process, and selected intermediate outcomes; they do not establish that the protocol improves long-term prognosis.
Reliable use of the protocol depends on a consistent testing timeline and adequate documentation of the clinical context preceding each measurement. T0 must correspond to the first recognition of sepsis and the initiation of resuscitation monitoring, while T6, T24, and T72 should remain within the predefined windows. A shift in blood collection time, or failure to document recent fluid, albumin, and blood-product administration, can alter both the measured protein concentration and the apparent magnitude of change. Albumin and prealbumin are strongly influenced by inflammation and acute-phase changes in hepatic protein synthesis, and increased capillary permeability may further redistribute them into the extravascular compartment; transferrin is likewise a negative acute-phase protein whose concentration may fall during inflammation6,12,13. None of the three should therefore be used alone to diagnose malnutrition6,12,13,14. Risk stratification must take account of relative change, fluid exposure, hepatic and renal function, and other inflammatory indicators rather than relying on a low value at a single time point. The protein results are intended to guide reassessment intensity and the timing of nutritional evaluation; they do not replace measures of fluid responsiveness or tissue perfusion and should not, by themselves, trigger fluid administration, fluid restriction, or albumin infusion.
Several practical problems may complicate interpretation, particularly missing planned time points, blood collection immediately after a fluid challenge, exposure to exogenous proteins, and discordant trends among the three measurements. Testing completion, reporting time, and the rate of valid results on first analysis were similar in the two groups, suggesting that the workflow can be incorporated into an existing laboratory system, but automated scoring cannot resolve every clinical situation. An unusually large change in one protein, opposing trends across the three indicators, or a score that is inconsistent with fluid exposure and the patient's clinical condition, should prompt manual review rather than direct application of the automated classification. The review should begin with the pre-analytical process, including specimen collection, handling, and processing, to confirm compliance with laboratory quality requirements15; recent transfusions, the analytical platform, liver function, and possible protein loss should then be considered when judging clinical plausibility. Different albumin assays and analytical platforms may produce clinically meaningful systematic bias16, so absolute thresholds need to be calibrated against the local method and reference interval. Interpretation is particularly difficult in patients with decompensated liver disease, nephrotic syndrome, or severe burns, because these conditions involve systemic inflammation and metabolic disturbance, urinary protein loss, or capillary leakage and wound-related protein loss, respectively17,18,19. Such patients require broader manual review, and dynamic phenotype classification may not be appropriate in some cases.
Previous studies of sepsis have generally relied on a single nutrition-related marker or nutritional index measured at admission for risk assessment; a baseline value, however, may largely reflect the severity of the acute illness, whereas serial trajectories can provide information beyond the initial measurement20. Following the direction, magnitude, and recovery of change may also provide additional context for interpreting pre-existing nutritional deficiency, acute-phase reorganization of protein synthesis, hemodilution, and extravascular leakage. In the present study, numerical between-group differences emerged mainly in fluid administration after initial resuscitation, performance of reassessment, and selected perfusion measures rather than in fluid input during the first 3 h. This pattern is consistent with current approaches that use dynamic fluid-responsiveness indices to guide additional fluid administration and avoid repeated fluid challenges in patients who are unlikely to respond21,22. The SSC 2021 guidelines support initial resuscitation for sepsis-induced hypoperfusion or septic shock followed by repeated assessment using dynamic measures and perfusion indicators23. CLOVERS and CLASSIC did not establish a mortality benefit from restrictive fluid strategies after initial fluid administration24,25, and ANDROMEDA-SHOCK did not demonstrate a statistically significant reduction in its primary 28 d mortality outcome with capillary-refill-targeted resuscitation26. Closer review of repeated boluses, maintenance fluids, and medication diluents may contribute to the later numerical divergence, and REDUSE supports the feasibility of reducing non-resuscitation fluid exposure through a dedicated protocol27; however, the present analysis did not isolate these fluid components or test mediation, so reduced fluid creep remains a possible explanation. T24 and T72 trajectories cannot account for decisions during 3–6 h, and T6 results may become available only after that interval; any earlier association should therefore be attributed cautiously to information available at the time and to the reassessment workflow. Lactate clearance, capillary refill time, and fluid balance remain intermediate outcomes, however, and favorable changes in these measures cannot be equated with improved organ function or survival. The principal contribution of the protocol lies in bringing dispersed laboratory findings, fluid exposure, and nursing observations into a traceable reassessment pathway, not in defining a new independent treatment target.
This study has several limitations. Its retrospective design and exposure definition based on documented interface use leave room for indication, selection, and documentation bias, because clinicians may have used the interface preferentially in patients with more complex fluid dynamics; additional attention associated with the visual workflow may also have produced a Hawthorne effect, while physician preference, vasopressor titration, and other unmeasured co-interventions could have affected lactate clearance and other intermediate outcomes, despite propensity score matching. The sample was also small (50 matched pairs), and the numbers of pulmonary edema, marked fluid overload, acute kidney injury, and death events were limited, reducing the precision of estimates for safety outcomes and hard clinical endpoints. Accordingly, a non-significant result should not be interpreted as evidence of equivalence between the two management approaches. In addition, the scoring thresholds and phenotype rules remain study-specific and have not been externally validated in independent cohorts or across different analytical platforms; discrepancies between recorded scores and protein changes prevent reliable prognostic or incremental-value interpretation, while missing later measurements may have biased the longitudinal and available-case secondary analyses. Prospective, multicenter studies are needed to examine threshold stability, interobserver agreement, discrimination, calibration, implementation cost, and clinical net benefit, as well as to compare the full three-protein model with prealbumin alone and simpler alternatives. Until such evidence is available, the method should be used as an adjunct to standard hemodynamic monitoring and nutritional assessment, not as a replacement for current sepsis-resuscitation practice.
In conclusion, visual management based on dynamic stratification of three nutrition-related proteins may help integrate information on perfusion, fluid exposure, and nutritional status. In this retrospective cohort, the protocol showed descriptive associations with reassessment processes, while neither primary outcome was statistically significant after multiplicity adjustment; its scoring validity and effects on organ function and longer-term outcomes require prospective evaluation.
披露
The authors have no conflicts of interest to declare.
致谢
Not applicable.
材料
| 姓名 | 公司 | 目录编号 | 评论 |
|---|---|---|---|
| Albumin Gen.2 (ALB2) Reagent | Roche Diagnostics GmbH, Mannheim, Germany | ALB2; Cat. No. 05166861190 (cobas c 701/702) | Bromocresol green colorimetric reagent for quantitative serum or plasma albumin measurement. |
| Amika Enteral Feeding Pump | Fresenius Kabi AG, Bad Homburg, Germany | Amika | Used to initiate enteral feeding at 10–20 mL/h and titrate delivery according to gastrointestinal and circulatory tolerance. |
| cobas c 702 Clinical Chemistry Module | Roche Diagnostics GmbH, Mannheim, Germany | cobas c 702; Cat. No. 06473245001 | Automated photometric clinical chemistry analyzer used to measure serum albumin, prealbumin, and transferrin. |
| IBM SPSS Statistics | IBM Corporation, Armonk, NY, USA | Version 27.0 | Used for descriptive statistics, group comparisons, mixed models, GEE, regression, survival analysis, and agreement testing. |
| Infusomat Space Volumetric Infusion Pump | B. Braun Melsungen AG, Melsungen, Germany | Infusomat Space | Used to control balanced crystalloid infusion rates during early fluid resuscitation. |
| Prealbumin (PREA) Reagent | Roche Diagnostics GmbH, Mannheim, Germany | PREA; Cat. No. 05950902190 (cobas c 701/702) | Immunoturbidimetric reagent for quantitative serum or plasma prealbumin measurement. |
| Tina-quant Transferrin ver.2 (TRSF2) Reagent | Roche Diagnostics GmbH, Mannheim, Germany | TRSF2; Cat. No. 05588855190 (cobas c 701/702) | Immunoturbidimetric reagent for quantitative serum or plasma transferrin measurement. |
参考文献
- Zampieri FG, Bagshaw SM, Semler MW. Fluid therapy for critically ill adults with sepsis: a review. JAMA. 2023;329(22):1967-1980.
- Pfortmueller CA, Dabrowski W, Wise R, van Regenmortel N, Malbrain MLNG. Fluid accumulation syndrome in sepsis and septic shock: pathophysiology, relevance and treatment - a comprehensive review. Ann Intensive Care. 2024;14(1):115.
- Graham JD, Lanspa MJ, Peltan ID. Resuscitation targets, fluids, and vasoactives in septic shock. Clin Chest Med. 2026;47(1):33-43.
- Qinyuan D et al. Protein nutritional support in critically ill patients: pathophysiological basis, clinical evidence, and areas of uncertainty - a narrative review. Front Med (Lausanne). 2026;13:1770345.
- Belinskaia DA, Voronina PA, Goncharov NV. Integrative role of albumin: evolutionary, biochemical and pathophysiological aspects. J Evol Biochem Physiol. 2021;57(6):1419-1448.
- Keller U. Nutritional laboratory markers in malnutrition. J Clin Med. 2019;8(6):775.
- Yu Y et al. Hepatic transferrin plays a role in systemic iron homeostasis and liver ferroptosis. Blood. 2020;136(6):726-739.
- Cao Y, Su Y, Guo C, He L, Ding N. Albumin level is associated with short-term and long-term outcomes in sepsis patients admitted in the ICU: a large public database retrospective research. Clin Epidemiol. 2023;15:263-273.
- Wu H, Zhou C, Kong W, Zhang Y, Pan D. Prognostic nutrition index is associated with the all-cause mortality in sepsis patients: a retrospective cohort study. J Clin Lab Anal. 2022;36(4):e24297.
- Zhang Y, Luo H, Wang H, Zheng Z, Ooi OC. Validation of prognostic accuracy of the SOFA score, SIRS criteria, and qSOFA score for in-hospital mortality among cardiac-, thoracic-, and vascular-surgery patients admitted to a cardiothoracic intensive care unit. J Card Surg. 2020;35(1):118-127.
- Purnama YI et al. Prognostic performance of prognostic nutritional index, subjective global assessment, and nutritional risk screening 2002 as predictors of inpatient sepsis mortality: a prospective cohort study. Acta Med Indones. 2026;58(2):164-173.
- Evans DC et al. The use of visceral proteins as nutrition markers: an ASPEN position paper. Nutr Clin Pract. 2021;36(1):22-28.
- Soeters PB, Wolfe RR, Shenkin A. Hypoalbuminemia: pathogenesis and clinical significance. JPEN J Parenter Enteral Nutr. 2019;43(2):181-193.
- Doherty JL, Larvie DY, Shivappa N, Hebert JR, Armah SM. Inflammatory diets are associated with lower total iron binding capacity in sera of young adults. Int J Vitam Nutr Res. 2023;93(1):9-17.
- Vermeersch P et al. How to meet ISO15189:2012 pre-analytical requirements in clinical laboratories? A consensus document by the EFLM WG-PRE. Clin Chem Lab Med. 2021;59(6):1047-1061.
- Garcia Moreira V et al. Overestimation of albumin measured by bromocresol green vs bromocresol purple method: influence of acute-phase globulins. Lab Med. 2018;49(4):355-361.
- Bernardi M et al. Albumin in decompensated cirrhosis: new concepts and perspectives. Gut. 2020;69(6):1127-1138.
- Mizdrak M et al. Endocrine disorders in nephrotic syndrome - a comprehensive review. Biomedicines. 2024;12(8):1860.
- Chen YF et al. Albumin supplementation may have limited effects on prolonged hypoalbuminemia in major burn patients: an outcome and prognostic factor analysis. J Chin Med Assoc. 2020;83(2):206-210.
- Xu F, Li J, Zhao W, Ding S, Cao J. Dynamic prognostic nutritional index and 28-day mortality in sepsis: a joint modeling analysis. Nutr Metab (Lond). 2026;23(1):83.
- Wang J et al. Dynamic measures of fluid responsiveness to guide resuscitation in patients with sepsis and septic shock: a systematic review and meta-analysis. Crit Care Explor. 2025;7(9):e1303.
- Weigl W, Adamski J, Onichimowski D, Nowakowski P, Wagner B. Methods of assessing fluid responsiveness in septic shock patients: a narrative review. Anaesthesiol Intensive Ther. 2022;54(2):175-183.
- Evans L et al. Surviving sepsis campaign: international guidelines for management of sepsis and septic shock 2021. Intensive Care Med. 2021;47(11):1181-1247.
- Shapiro NI et al. Early restrictive or liberal fluid management for sepsis-induced hypotension. N Engl J Med. 2023;388(6):499-510.
- Meyhoff TS et al. Restriction of intravenous fluid in ICU patients with septic shock. N Engl J Med. 2022;386(26):2459-2470.
- Hernández G et al. Effect of a resuscitation strategy targeting peripheral perfusion status vs serum lactate levels on 28-day mortality among patients with septic shock: the ANDROMEDA-SHOCK randomized clinical trial. JAMA. 2019;321(7):654-664.
- Lindén A et al. Protocolized reduction of non-resuscitation fluids versus usual care in septic shock patients (REDUSE): a randomized multicentre feasibility trial. Crit Care. 2024;28(1):166.