This protocol describes the implementation and descriptive pilot evaluation of a 16-week situational task-driven course that connects authentic tourism scenarios with staged task production, feedback, revision, presentation, process monitoring, performance assessment, questionnaires, and student interviews.
方法文章
A Situational Task-Driven Teaching Protocol for Undergraduate Tourism Management Education
本文内容
摘要
摘要
This article presents a 16-week situational, task-driven teaching protocol for undergraduate tourism management education, evaluated in four intact classes at Xi’an FanYi University. Two administratively assigned classes received situational task-driven teaching, and two received conventional lecture- and case-based instruction. The protocol connected visitor analysis, resource matching, route design, market analysis, budgeting, digital promotion, and bilingual presentation through staged production, feedback, revision, and reflection. Evaluation combined baseline and post-course assessments, implementation records, team and individual task scores, questionnaires, and semi-structured interviews. Of 112 enrolled students, 110 initially consented and one withdrew consent, leaving 109 eligible for outcome-specific data use; 102 formed the complete-record subset. Paired tourism-planning measurements were available for 53 situational task-driven and 52 conventional students, with mean gains of 19.03 and 10.69 points, respectively. Professional-knowledge gains in the complete-record subset averaged 18.61 and 11.72 points. Interviews with 20 students identified authentic scenarios, feedback, collaboration, and digital-tool use as valued features, alongside time pressure and bilingual-expression difficulties. Several questionnaire reliability coefficients were below 0.70. The protocol provides a structured approach to course delivery and assessment, but the four-class nonrandomized design, shared team scores, incomplete observations, and measurement limitations restrict the findings to descriptive evidence. Comparative efficacy and causality were not established.
引言
Tourism management graduates enter a sector in which professional decisions increasingly combine destination knowledge with digital communication, market interpretation, visitor-service design, cross-cultural interaction, and rapid adaptation to changing operating conditions. Recent discussion of tourism and hospitality education has therefore emphasized the need to move beyond the transmission of stable technical content and prepare students for technology-mediated, collaborative, and uncertain professional environments1. Evidence from tourism organizations similarly identifies continuing gaps between the digital competencies required in practice and those available in the workforce2. Undergraduate curricula must consequently preserve systematic disciplinary instruction while creating repeated opportunities for students to analyze realistic problems, coordinate decisions, produce professional outputs, and explain the reasoning supporting those outputs.
Contemporary experiential-learning research describes learning as an iterative process in which learners act in a concrete situation, reflect on the consequences of that action, develop or revise conceptual understanding, and test that understanding in a subsequent task3. Project-based learning operationalizes this process through extended problems and products that require inquiry, collaboration, decision-making, and presentation; a review of higher-education studies found that its reported outcomes span knowledge, cognitive strategies, skills, engagement, and students’ perceptions of learning4. Authentic assessment extends the same logic to evaluation by asking students to apply knowledge in tasks resembling the situations, standards, and judgments encountered beyond the classroom. Recent systematic evidence indicates that realism alone is insufficient: authentic assessment also requires transparent criteria, cognitive challenge, actionable feedback, and opportunities for students to evaluate and improve the quality of their work5. For tourism management education, these principles support the use of visitor profiles, route plans, market analyses, feasibility budgets, promotional products, bilingual presentations, and oral defenses rather than reliance on written examinations or unrevised case responses alone.
Recent tourism and hospitality education studies illustrate several ways of applying these principles. Authentic collaboration with international tourism partners has been used to connect course concepts with external problems and reflective practice6. Nature-based experiential learning has combined field experience, project development, observation, and reflection to prepare students for responsible tourism practice7. Design-based and value-based learning has been used to develop innovation competencies, while research-based learning has involved tourism students in investigating real territorial problems8,9. More recent studies have applied design thinking to tourism education and Living Lab projects to hospitality and tourism courses, emphasizing iterative problem framing, stakeholder interaction, collaborative production, adaptability, and professional development10,11. Taken together, these studies show a clear movement toward authentic, participatory, and professionally situated tourism education. They also reveal a methodological need for protocols that document not only a final product or student perception but also the sequence of task delivery, feedback, revision, participation, assessment, and implementation across a complete semester.
The present study addressed this need by developing a reproducible 16-week situational task-driven teaching protocol for four intact undergraduate Tourism Management classes at Xi’an FanYi University. The protocol organized learning around a connected sequence of visitor analysis, tourism-resource matching, route design, market analysis, budget feasibility, new-media promotion, bilingual presentation, feedback, revision, and reflection. It aligned implementation records with professional-knowledge tests, individual tourism-planning assessments, team and individual task scores, questionnaire measures, final course performance, and semi-structured interviews. Classes 2301 and 2302 received situational task-driven teaching, whereas Classes 2303 and 2304 continued conventional lecture- and case-based instruction. Because the four administrative classes were not individually randomized and only two classes received each condition, the accompanying evaluation was designed and interpreted as a descriptive pilot. Its purpose was to document protocol feasibility, implementation exposure, outcome distributions, and practical challenges rather than to establish that one teaching condition was causally superior.
方案
The Scientific Ethics Committee of Xi’an FanYi University approved the protocol (XY Ethics [2026] No. 011). Written informed consent was obtained before research data were collected. Nonconsenting students continued the course without inclusion in the dataset. Consent forms were stored separately, records were linked by anonymized identifiers, interview transcripts were de-identified, and results were reported in aggregate.
1. Prepare the course-based protocol
- Select a 16-week undergraduate Tourism Management course covering tourism project planning, digital route design, new-media marketing, tourism business English, or integrated tourism practice.
- Implement situational task-driven teaching through scenario entry, task analysis, team production, teacher feedback, revision, presentation, and reflection12.
- Designate individual tourism-planning performance as the principal descriptive outcome. This designation was made during revision and was not prospectively prespecified.
- Treat professional knowledge, task performance, learning engagement, self-efficacy, employability perception, course satisfaction, final course performance, and process indicators as secondary or exploratory outcomes.
- Develop scenarios involving Xi’an cultural tourism, Silk Road inbound tourism, museum study tours, university-area micro-vacation products, and cultural-tourism livestream promotion. Require an observable product, feedback-based revision, reflection, and stakeholder-style defense.
- Use Figure 1 to align consent, class assignment, baseline assessment, teaching, process tracking, post-course assessment, task scoring, interview sampling, data cleaning, and class-level reporting.
NOTE: Keep the instructor, course objectives, teaching hours, assessment week, task instructions, and scoring scales consistent across conditions. Record the class, instructor, teaching period, protocol version, instrument version, and workbook version.
2. Establish the quasi-experimental pilot design
- Use a nonequivalent-group pretest–posttest design with intact administrative classes13. Classes 2301–2302 received situational task-driven teaching, and Classes 2303–2304 received conventional teaching through administrative assignment. Retain existing class membership and document assignment.
- Treat the class as the allocation unit and retain student–team–class identifiers. The four available classes determined the study size, with two per condition.
NOTE: The study was not preregistered and had no a priori efficacy power calculation. Interpret findings descriptively because teaching conditions could not be separated reliably from class-specific influences. - Obtain consent and baseline assessments in week 1, track teaching in weeks 2–15, and conduct post-course assessments and interviews in week 16.
- Record consent, withdrawal, assessment availability, attendance, and analysis status in the Enrollment Log, including noninclusion reasons and timing.
- Exclude research outcomes from students who declined or withdrew consent, retaining only participant-flow information permitted by the approved ethics procedures.
- For tourism-planning performance, include available scores from students with continuing consent regardless of low attendance or missing questionnaires.
- Calculate changes only from paired measurements. Report baseline, post-course, and paired denominators and missing counts separately by class and condition.
- Define the complete-record subset by baseline and post-course assessment availability, questionnaire-completion thresholds, and attendance of at least 60%.
- Use this subset for the reported baseline characteristics, process indicators, and other student outcomes, alongside the available-case tourism-planning analysis.
- Identify this restriction explicitly because exclusions after teaching began may introduce selection bias.
- Reconcile enrollment, consent, withdrawal, complete-record membership, and outcome availability within each class.
- Distinguish baseline missingness from subsequent events and count each student once in participant-flow totals.
- Correct duplicate identifiers without excluding verified participants, preserving the original entry, correction, reason, date, and verifier.
3. Construct the study workbook
- Lock the workbook before recruitment. Include README, Evidence Chain, Enrollment Log, Class-Level Summary, Student Baseline, Item-Level Raw Data, Pretest-Posttest Outcomes, Process Data, Raw Rating Records, Team Task Scores, Interview Coder Records, Interview Coding, Codebook, Analysis Summary, Exploratory Analyses, and Dashboard.
- Link records through stable student, team, class, evaluator, and interview identifiers. Do not renumber records after attrition or exclusion.
- Store questionnaire responses before calculating scale means, one row per team-evaluator combination before calculating rating summaries, and independent interview codes before consensus.
- Store class-specific participant flow, baseline characteristics, outcomes, process indicators, missingness, and denominators in Class-Level Summary.
- Place principal descriptive results in Analysis Summary and Dashboard. Restrict unclustered comparisons to Exploratory Analyses and label them accordingly.
- Use Table 1 and Supplementary File 1 to define fields, coding rules, missing-value rules, formulas, and reporting functions. List study resources in the alphabetized Table of Materials.
4. Form teams and collect baseline data
- Assign each consenting student a stable anonymized identifier at enrollment. Form 26 teams within the existing classes: seven in Class 2301, six in Class 2302, seven in Class 2303, and six in Class 2304. Teams may contain three to five students. Do not move students between classes.
- Within each class, rank students by previous-semester grade point average (GPA) and distribute them among teams by alternating assignment.
- Avoid concentrating students with the highest or lowest English self-rating, digital skill, or tourism interest in one team. Record roles, role changes, and individual contributions.
- Code binary variables as 1 for yes and 0 for no. Use 1-5 scales for English self-rating, digital skill, tourism interest, learning motivation, learning engagement, self-efficacy, employability perception, course satisfaction, and teaching-process perception. Score professional knowledge and tourism-planning performance from 0 to 100.
- Describe age, gender, GPA, tourism experience, English self-rating, digital skill, tourism interest, learning motivation, baseline knowledge, tourism planning, engagement, self-efficacy, and employability perception separately by class. Do not use nonsignificant student-level tests as evidence of class equivalence.
5. Administer the measurement instruments
- In week 1, administer the individual professional-knowledge test within 45 minutes and the individual tourism-planning task within 60 minutes.
- Score both from 0 to 100 using their respective scoring guides in Supplementary File 2.
- Keep instructions, supervision, time limits, and scoring criteria identical across classes. Prohibit discussion and access to textbooks, online searches, or other external materials.
- After the baseline assessments, administer the six-item learning-engagement, self-efficacy, and employability-perception questionnaires14,15,16.
- Repeat these course-specific measures in week 16 and administer the five-item course-satisfaction and six-item teaching-process-perception questionnaires.
NOTE: Employability perception measures perceived preparedness, not demonstrated workplace competence or employment outcomes. - Administer the Chinese questionnaires using identical wording, item order, and response anchors: 1, strongly disagree, to 5, strongly agree. No items are reverse scored.
- Calculate the mean of observed responses when at least five of six items, or four of five satisfaction items, are completed; otherwise, record the composite as missing. Do not impute missing responses.
- Calculate Cronbach’s alpha separately for each questionnaire and occasion using complete item responses17.
- Report the item count, analysis denominator, coefficient, and corrected item–total correlation range. Distinguish reliability-analysis denominators from composite-score denominators.
- Interpret composites with alpha below 0.70 as exploratory, and do not delete items after examining outcomes to increase reliability.
CRUCIAL STEP: Preserve original item responses, missingness indicators, assessment ratings, and scoring records. Verify completion thresholds before calculating composite scores.
6. Deliver the situational task-driven intervention
- Deliver six connected modules: visitor-profile analysis in weeks 2–3, tourism-resource matching in weeks 4–5, digital route design in weeks 6–8, budget and feasibility analysis in weeks 9–10, new-media promotion in weeks 11–12, and an integrated bilingual roadshow defense in weeks 13–15.
- Require each output to address the target visitors, scenario requirements, feasibility, operational constraints, and risks.
- Provide written feedback after each module and require one traceable revision. Retain the original submission, feedback, revision decision, and final version. After modules 3, 5, and 6, require an individual reflection linking task problems, course concepts, feedback, revision, and transfer to subsequent tasks.
- Record attendance, submissions, discussions, feedback episodes, revisions, reflections, classroom interactions, presentations, late assignments, completion rates, contribution ratings, workload, and digital-access problems using predefined rules.
- In future implementations, introduce bilingual terminology and brief bilingual explanations during the resource-matching, route-design, feasibility, and new-media modules. Identify this as a recommended modification rather than part of the evaluated pilot.
- Address free-riding through named roles, contribution logs, confidential peer ratings, individual reflections, and instructor verification. Reduce feedback fatigue by prioritizing revisions and staggering deadlines.
- Check digital access before relevant modules and provide offline or shared-access alternatives. Reduce nonessential deliverables when repeated workload pressure is documented.
PAUSE POINT: After week 8, pause a team that has completed fewer than three modules, lacks assessable individual contributions, or cannot access the required tools. Provide a documented make-up workshop, role adjustment, workload modification, or access accommodation before week 10.
7. Deliver the conventional course
- Teach the conventional classes through lectures, textbook explanation, teacher-led case analysis, and ordinary case assignments. Keep the instructor, objectives, teaching hours, assessment week, task instructions, and scoring scale consistent across conditions. Do not provide the connected six-module sequence, mandatory feedback cycles, required resubmissions, or intervention roadshow practice.
- Record attendance, submissions, discussions, routine feedback, revisions, reflections, classroom interactions, presentations, late assignments, completion rates, contribution ratings, workload, and digital-access problems using compatible definitions. Classify ordinary comments and voluntary revisions as routine course activities.
- Administer the same common tourism-product task and presentation assessment to both conditions in week 16. Keep this assessment separate from the repeated intervention tasks and roadshow practice.
8. Score task performance
- Assess the common week-16 task using identical requirements for both conditions and the rubrics in Table 2 and Supplementary File 2. Remove names and class labels from written products and record evaluator awareness of the condition.
- Have two course-related teachers and one practice-oriented evaluator independently assign five domain scores and one holistic score, each from 0 to 100.
- Record product and evaluator identifiers, scores, date, and condition awareness. Lock ratings before evaluators view one another’s scores or other study outcomes.
- Average the three ratings for each domain and, separately, the three holistic ratings for the evaluator-panel score.
- Estimate holistic-rating agreement using a two-way mixed-effects, absolute-agreement intraclass correlation coefficient for the three-rater mean, ICC(A,3), with a 95% confidence interval18.
- Calculate the weighted team total as route design × 0.25 + market analysis × 0.20 + budget feasibility × 0.15 + new-media promotion × 0.20 + bilingual presentation × 0.20.
- Use peer-panel ratings only for formative feedback, excluding them from task scores and inferential comparisons. Keep them separate from confidential teammate ratings of individual contribution.
- Calculate individual contribution as (mean valid teammate rating − 1) × 25, excluding self-ratings.
- Divide this score by the team mean and bound the coefficient at 0.85–1.15. Apply it to route design, new-media promotion, and bilingual presentation, bounding adjusted scores at 0–100.
- Leave market analysis and budget feasibility unchanged and combine the domains using the weights in Step 8.3.
- Score individual reflection, presentation evidence, and documentation from 0 to 100 using only the common final assessment.
- Calculate the overall task score as adjusted task-product score × 0.70 + individual contribution × 0.10 + individual reflection × 0.10 + presentation evidence × 0.05 + task documentation × 0.05.
- Exclude earlier instructional reflections and intervention-specific revisions. Record the score as missing if a required component is unavailable or the team's mean contribution is zero; do not reweight components. Round only after calculation.
- Report team and student scores descriptively within class. Retain student–team–class identifiers because individual scores contain shared team components.
9. Administer the post-course assessment
- In week 16, administer parallel professional-knowledge and individual tourism-planning assessments using the baseline time limits, instructions, supervision, and scoring procedures.
- Administer post-course questionnaires after the assessments and common presentation.
- Calculate changes in professional knowledge, tourism planning, learning engagement, self-efficacy, and employability perception as post-course minus baseline scores for students with both measurements.
- Preserve component scores and missingness indicators. Enter final course scores after the institutional gradebook is finalized.
- Record assessment noncompletion and questionnaire missingness by class, condition, outcome, week, and reason. Distinguish a missed assessment from an unscorable questionnaire and retain other valid outcomes from the same consenting student.
10. Clean, summarize, and analyze the quantitative data
- Verify student–team–class links, evaluator identifiers, score ranges, questionnaire-completion thresholds, contribution coefficients, and calculated scores.
- Document corrections with the original value, replacement, reason, date, and verifier.
- Identify tourism-planning performance as the principal descriptive outcome designated after data collection.
- Report secondary and exploratory outcomes without selection by statistical significance. No confirmatory primary outcome or multiplicity-adjustment strategy was prospectively specified.
- Present participant flow, baseline characteristics, outcomes, changes, process indicators, and missingness by class before combining conditions.
- Report continuous variables as valid numbers, mean, and standard deviation, and categorical variables as counts and percentages with explicit denominators.
- Calculate condition summaries from individual records or class-size-weighted means and combined variances.
- Report available-case tourism-planning scores with separate baseline, post-course, and paired denominators. Use the 102-student complete-record subset for baseline characteristics, process indicators, and other reported student outcomes.
- Distinguish these populations and retain valid tourism-planning scores despite low attendance or missing questionnaires.
- Interpret student and team outcomes descriptively, preserving class membership and shared team-score links.
NOTE: Two nonrandomized classes per condition cannot support reliable confirmatory comparisons; multilevel or cluster-robust methods do not remove confounding between condition and class19. - Restrict unclustered comparisons to Supplementary Table 1. Use two-sided Welch’s t-tests for continuous variables, Fisher’s exact tests for categorical variables, and pooled within-condition standard deviations for Cohen’s d.
- Identify p-values, confidence intervals, and effect sizes as exploratory estimates that ignore class and team dependence.
- Exclude adjusted regression models, coefficient plots, and peer-panel inferential comparisons. Do not use these estimates to establish comparative efficacy.
- Store descriptive results in Analysis Summary and Dashboard and unclustered comparisons in Exploratory Analyses. Reconcile identifiers, participant counts, denominators, missingness, scoring, reliability outputs, and table–figures values. Resolve and document discrepancies before locking outputs.
11. Conduct interview sampling and coding
- After post-course assessment, select 20 consenting students through maximum-variation sampling, including 10 per condition and five per class.
- Construct the sampling frame using class, gender, overall task score, post-course professional knowledge, and employability-perception change.
- Calculate the 33.3rd and 66.7th percentiles within each condition for each sampling measure using available values.
- Classify values below the first threshold as low, values from the first to below the second as medium, and values at or above the second as high.
- Keep tied values together and record missing measures separately. Retain the numerical thresholds and each candidate’s sampling profile.
- Select students representing varied gender and performance profiles within each class. Order candidates with equivalent profiles by anonymized identifier.
- Replace students who decline with consenting candidates from the same class and the closest available profile. Record invitations, responses, selection reasons, and replacements.
- Use the same semi-structured guide across conditions to address learning, task difficulty, teamwork, feedback, revision, digital access, bilingual presentation, workload, career relevance, and suggested improvements.
- Record interviewer role, date, duration, and mode. Obtain separate consent for recording or note-taking, remove identifying details from transcripts, and retain linkage through interview identifiers.
- Conduct codebook thematic analysis through familiarization, preliminary coding, codebook development, and theme review20.
- Define each theme and its inclusion and exclusion criteria before full independent coding.
- Have two coders independently assess every transcript using the same codebook. If the codebook changes, independently recode all affected transcripts before calculating agreement.
- Use each interview–theme pair as a binary coding unit: present or absent. Preserve both coders’ pre-consensus decisions in Interview Coder Records.
- Exclude pairs missing either decision from agreement calculations without treating missing codes as absence.
- Calculate percentage agreement and Cohen’s κ from the same paired decisions and report the denominator and underlying 2 × 2 count table. For theme-specific calculations, report κ as undefined when expected agreement equals one.
- Resolve disagreements through discussion while preserving the original decisions.
- Store one consensus record per interview–theme pair, including interview identifier, theme, supporting evidence code, class, condition, sampling profile, and resolution status.
NOTE: Theme frequencies describe the purposively selected interview sample, not population prevalence or independent teaching-condition effects. Present de-identified supporting evidence.
结果
Participant flow and baseline characteristics
Of 112 enrolled students, 110 initially consented and one withdrew consent, leaving 109 eligible for outcome-specific data use. Enrollment, initial consent, and complete-record counts were 30, 29, and 28 in Class 2301; 27, 26, and 24 in Class 2302; 29, 29, and 27 in Class 2303; and 26, 26, and 23 in Class 2304. One student in each intervention class declined consent, and the withdrawal occurred in Class 2304. Among students with continuing consent, seven lacked complete records: three missed post-course assessments, two had attendance below 60%, one lacked baseline data, and one exceeded the questionnaire-missingness threshold. A duplicate identifier in Class 2303 was corrected without excluding the participant. The complete-record subset comprised 52 situational task-driven and 50 conventional students. Figure 2 presents participant flow and the assessment schedule.
Baseline professional-knowledge scores in the complete-record subset were 64.10 ± 6.50, 64.49 ± 6.90, 62.20 ± 5.70, and 62.63 ± 6.10 in Classes 2301–2304, respectively. Corresponding tourism-planning scores were 64.50 ± 5.60, 65.09 ± 5.80, 63.60 ± 5.40, and 64.12 ± 5.60. Condition-level mean age was 20.65 ± 0.82 versus 20.40 ± 0.94 years, and previous-semester grade point average was 3.00 ± 0.31 versus 3.03 ± 0.31. Table 3 reports baseline characteristics by class and condition.
Teaching-process indicators
Complete-record attendance averaged 90.8% ± 5.3%, 92.1% ± 5.5%, 85.6% ± 7.1%, and 86.9% ± 7.6% across Classes 2301–2304. Condition-level attendance was 91.4% ± 5.4% in the situational task-driven subset and 86.2% ± 7.3% in the conventional subset. Task submissions averaged 5.08 ± 0.86 versus 3.86 ± 0.76, with completion rates of 84.6% ± 14.3% versus 77.2% ± 15.1%, based on six and five required assignments, respectively. Teacher-feedback episodes averaged 6.54 ± 1.41 versus 3.30 ± 1.31, revision rounds 4.96 ± 1.08 versus 1.88 ± 0.92, and reflection length 1,562 ± 330 versus 889 ± 219 words. These summaries excluded students outside the complete-record subset, including the two with attendance below 60%. All 13 intervention teams completed the six modules and instructional bilingual roadshow; none met the week-8 pause criterion. Figure 3 displays the process indicators, and Table 4 provides class- and condition-specific summaries.
Professional knowledge and tourism-planning outcomes
Within the complete-record subset, post-course professional-knowledge scores were 82.50 ± 9.50, 83.35 ± 10.00, 73.80 ± 9.20, and 74.50 ± 9.50 across Classes 2301–2304. Condition-level means were 82.89 ± 9.65 in the situational task-driven subset and 74.12 ± 9.25 in the conventional subset, with gains of 18.61 ± 7.56 and 11.72 ± 7.17 points. Figure 4A displays baseline and post-course scores for the same 52 and 50 students.
Among 109 students with continuing consent, tourism-planning scores were available for 108 at baseline and 106 post-course; 105 had paired measurements. Baseline counts were 29, 25, 29, and 25 across Classes 2301–2304; post-course counts were 28, 26, 28, and 24; and paired counts were 28, 25, 28, and 24. Valid measurements from students with low attendance or missing questionnaires were retained. Available-case baseline tourism-planning means were 64.61 ± 5.60 and 63.59 ± 5.32, with 54 students per condition. Post-course means were 83.63 ± 8.09 and 74.42 ± 8.94, based on 54 and 52 students. Among the 53 situational task-driven and 52 conventional paired participants, baseline means were 64.70 ± 5.61 and 63.73 ± 5.37, post-course means were 83.74 ± 8.13 and 74.42 ± 8.94, and gains were 19.03 ± 6.88 and 10.69 ± 7.19 points. Class-specific gains were 19.10 ± 6.80, 18.96 ± 7.10, 10.69 ± 7.08, and 10.70 ± 7.47 points. Figure 4B displays the paired scores, and Table 5A reports available-case and paired summaries.
Task performance and questionnaire outcomes
Within the complete-record subset, overall task scores were 79.20 ± 6.10, 80.15 ± 6.60, 74.50 ± 7.00, and 75.37 ± 7.50 across Classes 2301–2304. Condition-level means were 79.64 ± 6.29 versus 74.90 ± 7.17. Contribution-adjusted individual scores were 76.40 ± 5.64 versus 70.94 ± 5.84 for route design, 79.52 ± 7.57 versus 73.65 ± 8.75 for new-media promotion, and 78.88 ± 6.33 versus 75.01 ± 8.45 for bilingual presentation. Final course scores were 80.81 ± 5.25 versus 74.59 ± 5.00. Tourism-planning gains in this subset were 19.17 ± 6.87 versus 10.72 ± 7.31 points.
Post-course questionnaire means were 3.77 ± 0.41 versus 3.43 ± 0.48 for engagement, 3.70 ± 0.47 versus 3.35 ± 0.42 for self-efficacy, 3.76 ± 0.48 versus 3.43 ± 0.44 for employability perception, 4.02 ± 0.47 versus 3.71 ± 0.45 for satisfaction, and 3.93 ± 0.46 versus 3.61 ± 0.47 for teaching-process perception. Engagement, self-efficacy, and employability-perception gains were 0.56 ± 0.38 versus 0.20 ± 0.37, 0.65 ± 0.46 versus 0.24 ± 0.43, and 0.62 ± 0.45 versus 0.28 ± 0.42, respectively. Figure 4C displays post-course engagement, self-efficacy, employability perception, and satisfaction; Table 5B reports the complete-record learning and task outcomes.
Questionnaire reliability and exploratory comparisons
Baseline and post-course Cronbach’s alpha coefficients were 0.63 and 0.73 for engagement, 0.58 and 0.68 for self-efficacy, and 0.56 and 0.67 for employability perception. Post-course coefficients were 0.68 for satisfaction and 0.65 for teaching-process perception. Questionnaire findings were interpreted as exploratory because several coefficients were below 0.70.
Supplementary Table 1 reports unclustered differences, 95% confidence intervals, p values, and Cohen’s d for complete-record student outcomes and 13 teams per condition. These estimates lacked clustering, covariate, and multiplicity adjustment and did not establish comparative efficacy. Peer-panel scores were excluded from inferential comparisons.
Interview findings and mixed-methods integration
Twenty students completed interviews, with ten per condition and five per class. In the situational task-driven condition, eight described authentic-scenario immersion, seven iterative teacher feedback, six team collaboration, and four improved digital-tool use. Four reported time pressure, and one reported continuing bilingual-expression difficulty. In the conventional condition, eight valued conceptual clarity, five reported limited digital-skill practice, four requested more authentic projects, three described participation as dependent on individual initiative, and three reported insufficient repeated practice.
Across 220 interview–theme pairs, coders agreed on 186 decisions (84.5%) and disagreed on 34, yielding Cohen’s κ = 0.656 before consensus. Table 6 integrates the interview findings with the quantitative summaries. Theme counts describe the purposively selected interview participants.
Team-level task performance
The 26 teams comprised seven, six, seven, and six teams in Classes 2301–2304. Weighted team totals were 78.28 ± 1.85, 78.84 ± 2.00, 72.42 ± 3.30, and 73.18 ± 3.60, respectively. Condition-level totals were 78.54 ± 1.86 versus 72.77 ± 3.32. Domain means were 77.58 ± 2.58 versus 70.02 ± 3.53 for route design, 77.65 ± 4.26 versus 75.43 ± 4.72 for market analysis, 78.88 ± 3.45 versus 71.74 ± 5.36 for budget feasibility, 80.54 ± 3.49 versus 72.68 ± 6.34 for new-media promotion, and 78.35 ± 3.26 versus 74.39 ± 6.15 for bilingual presentation.
Evaluator-panel scores averaged 79.38 ± 3.78 versus 72.88 ± 3.68, and formative peer-panel scores averaged 80.02 ± 3.16 versus 72.36 ± 4.62. Agreement for the three-rater mean holistic score was ICC(A,3) = 0.82 (95% confidence interval, 0.70–0.90). Table 7 presents team-level results by class and condition. Team and contribution-adjusted student scores remained nested within four classes and were summarized descriptively.
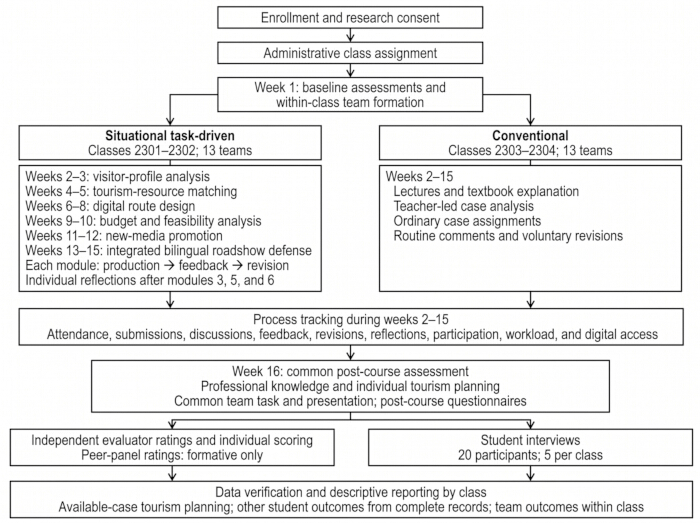
Figure 1: Situational task-driven teaching protocol workflow. The 16-week protocol covered enrollment, consent, administrative class assignment, baseline assessment, team formation, teaching, process tracking, post-course assessment, scoring, interviews, and descriptive analysis. Classes 2301–2302 received six connected task modules with feedback and revision; Classes 2303–2304 received conventional lecture- and case-based teaching. Please click here to view a larger version of this figure.
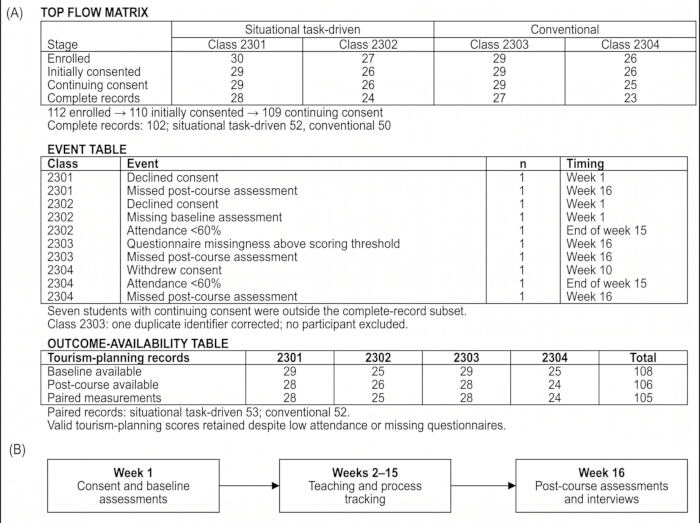
Figure 2: Participant flow and assessment timeline. (A) Class-specific flow from 112 enrolled students to 110 initially consenting, 109 with continuing consent, and 102 complete records, including 52 situational task-driven and 50 conventional students. Tourism-planning availability comprised 108 baseline, 106 post-course, and 105 paired measurements. (B) Baseline assessment in week 1, teaching and process tracking in weeks 2–15, and post-course assessment and interviews in week 16. Please click here to view a larger version of this figure.
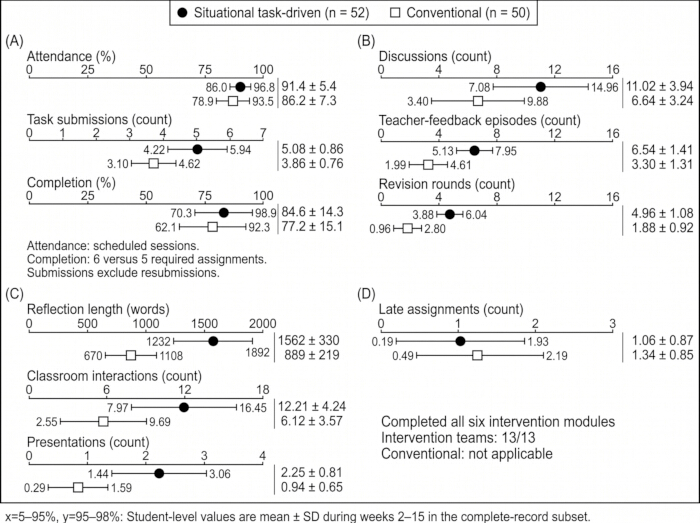
Figure 3: Teaching-process indicators by teaching condition. (A) Attendance, task submissions, and completion rate. (B) Discussions, feedback episodes, and revision rounds. (C) Reflection length, classroom interactions, and presentations. (D) Late assignments and module completion. Student values are the mean ± SD for 52 situational, task-driven, and 50 conventional complete records. Attendance used scheduled sessions as the denominator; completion used six and five required assignments, respectively. All 13 intervention teams completed all six modules; this team-level measure was not applicable to conventional teams and has no error bars. SD, standard deviation. Please click here to view a larger version of this figure.
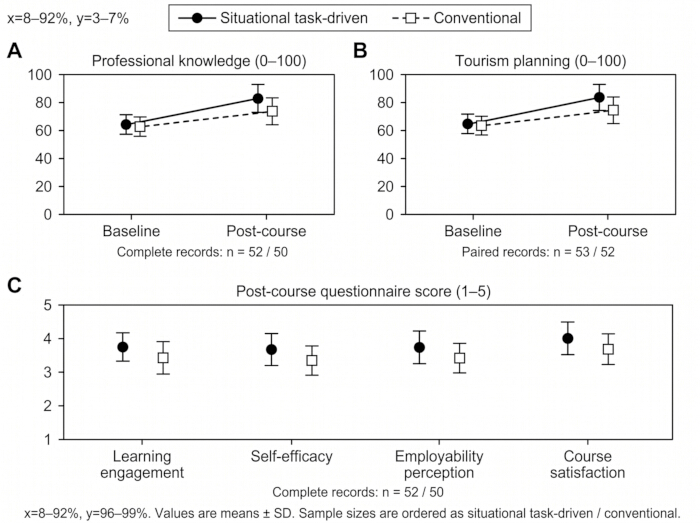
Figure 4: Professional knowledge, tourism planning, and post-course questionnaire outcomes. (A) Professional knowledge in 52 situational task-driven and 50 conventional complete records. (B) Tourism planning in 53 and 52 paired available case records, respectively. (C) Post-course engagement, self-efficacy, employability perception, and satisfaction in the complete-record subsets. Values are means with SD error bars. Panels A and B use the same participants at both occasions within each condition. Knowledge and planning scores range from 0 to 100; questionnaire scores range from 1 to 5. SD = standard deviation. Please click here to view a larger version of this figure.
Table 1: Study workbook structure and reproducibility materials. The 16 worksheets are organized by record unit, core fields, and function. README denotes workbook instructions. Please click here to download this Table.
Table 2: Task-performance scoring structure and student-level score derivation. Domain and individual component scores range from 0 to 100. Contribution coefficients of 0.85–1.15 adjust route design, new-media promotion, and bilingual presentation. Overall scores combine the adjusted product score (70%), contribution (10%), reflection (10%), presentation evidence (5%), and documentation (5%). Reflection and documentation use only the common final assessment. Peer-panel ratings are formative and excluded from task scores. —, not a separately weighted team domain. Please click here to download this Table.
Table 3: Baseline characteristics of the complete-record subset by class and teaching condition. Values are mean ± SD or n (%) for 52 situational task-driven and 50 conventional students. Percentages use column-specific denominators. GPA, grade point average; n, number of students; SD, standard deviation. Please click here to download this Table.
Table 4: Teaching-process indicators in the complete-record subset by class and teaching condition. Values are student-level mean ± SD during weeks 2–15 for 52 situational task-driven and 50 conventional students. Attendance uses scheduled sessions; completion uses six and five required assignments, respectively. Submissions exclude resubmissions. Students with attendance below 60% were excluded from this subset. n, number of students; SD, standard deviation. Please click here to download this Table.
Table 5: Available-case tourism-planning outcomes and complete-record learning outcomes by class and teaching condition. (A) Tourism planning among 109 students with continuing consent: 108 baseline, 106 post-course, and 105 paired measurements. (B) Post-course outcomes and gains among 102 complete records. Values are mean ± SD unless reported as n. Gains equal post-course minus baseline within paired records. Individual task scores contain shared team components. n, number of students; SD, standard deviation. Please click here to download this Table.
Table 6: Quantitative–qualitative joint display. Quantitative values are ordered as situational task-driven versus conventional. Tourism-planning gains use 53 and 52 paired records; other summaries use 52 and 50 complete records. Interviews included ten students per condition and five per class. Convergent findings indicate corresponding patterns; complementary findings provide additional context. Theme counts describe the purposive interview sample. n, number of interview participants. Please click here to download this Table.
Table 7: Team-level task performance by class and teaching condition. Values are mean ± SD for 26 teams nested within four classes, with 13 teams per condition. Domain and evaluator-panel scores average three independent domain ratings and a holistic rating, respectively. Peer-panel scores are formative. ICC(A,3) denotes the two-way mixed-effects, absolute-agreement intraclass correlation coefficient for the three-rater mean holistic score. CI, confidence interval; SD, standard deviation. Please click here to download this Table.
Supplementary Table 1: Unclustered exploratory comparisons. (A–C) include 52 situational task-driven and 50 conventional complete records; Panel D includes 13 teams per condition. Panel A reports mean ± SD or n (%) with column-specific denominators. Differences are situational, task-driven, and minus conventional. Continuous comparisons use two-sided Welch’s t-tests and 95% CIs; categorical comparisons use two-sided Fisher’s exact tests. Cohen’s d uses the pooled within-condition SD. No clustering, covariate, or multiplicity adjustment was applied; estimates ignore class and team dependence and cannot establish comparative efficacy. CI, confidence interval; GPA, grade point average; n, number of students; SD, standard deviation. Please click here to download this file.
Supplementary File 1: Study workbook structure, variable definitions, and calculation rules. Workbook organization, participant flow, analysis populations, scoring, reliability, interview sampling, statistical calculations, and data verification. Please click here to download this file.
Supplementary File 2: Measurement instruments, task prompts, scoring rubrics, rating forms, and interview guide. Professional-knowledge blueprint, assessment forms and answer keys, tourism-planning tasks, questionnaires, common team assessment, scoring rubrics, evaluator and peer-rating forms, interview questions, and coding framework. Please click here to download this file.
讨论
This four-class, nonrandomized pilot examined the delivery of a 16-week situational task-driven protocol in undergraduate tourism-management education. Its instructional contribution was the connection of visitor analysis, resource selection, route design, budgeting, promotion, and presentation through successive feedback and revision. This organization is consistent with hospitality-education research examining design thinking and collaborative problem solving21. Professional-knowledge gains in the complete-record subset averaged 18.61 points in the situational task-driven classes and 11.72 points in the conventional classes. These descriptive differences accompanied contrasting instructional experiences but did not identify which component contributed to learning or establish a teaching-condition effect.
The outcome pattern supports examining competencies separately. Route design and new-media promotion showed larger numerical differences than market analysis and bilingual presentation. A smaller market-analysis difference does not demonstrate equivalence or establish that conventional teaching adequately develops this competency. Research on structured Direct Instruction curricula supports the educational value of explicit instruction, although those curricula differ from the lecture-based comparison used here22. For bilingual delivery, brief explanations of visitor needs, route choices, and service arrangements could be introduced before the final roadshow. Topic familiarity is relevant to oral-task performance, providing a rationale for connecting language practice with content already encountered in the course23. The effect of this modification remains to be evaluated.
Measurement quality limits interpretation of the questionnaire and task outcomes. Baseline alpha coefficients ranged from 0.56 to 0.63, and several post-course coefficients remained below 0.70. These course-specific composites therefore provided limited measurement precision and require further validation. Questionnaire responses were self-reported, process records depended on teacher documentation, and task scores incorporated peer contribution ratings and shared team products. Masked written identifiers could reduce identity-related influence, but product characteristics and live presentations could reveal teaching condition. Employability perception represented perceived preparedness, not employer-rated competence, internship performance, or employment attainment. This distinction is consistent with accounts of graduate employability that incorporate individual resources and contextual opportunities beyond perceived skill development24.
The interviews identified practical considerations for implementation. Four intervention participants reported time pressure, while conventional-class participants valued conceptual clarity and requested additional practical opportunities. These accounts support testing staggered deadlines, shorter feedback priorities, and protected revision time. Named responsibilities, contribution logs, and individual questioning can make participation more visible, while shared equipment and offline materials can address access difficulties. The common final assessment should provide equivalent preparation conditions and assessable individual activities across conditions. Peer-panel ratings can support reflection and audience awareness but should remain separate from scored outcomes. Because the interview sample was purposively selected, its theme counts cannot establish how frequently these experiences occurred across the course population.
The principal analytical limitation was administrative allocation to only four classes. Class culture, timetable, peer relationships, and other class-specific influences could not be separated reliably from teaching conditions. The 26 teams remained nested within those classes, and students sharing team-derived scores were not independent replications. Cluster-aware methods address dependence under suitable designs, but they do not remove confounding created by nonrandom allocation25. The unclustered comparisons in Supplementary Table 1, therefore, cannot establish comparative efficacy. Attendance was measured during teaching and could have been affected by condition; treating it as a baseline covariate could introduce post-treatment adjustment bias26. Outcome-specific denominators make missingness explicit but do not eliminate selection bias. Process and secondary-outcome summaries remained restricted to complete records, including the exclusion of students with attendance below 60%.
The single-institution, single-semester setting restricts transferability. The evaluation was not preregistered, tourism planning was designated post hoc as the principal descriptive outcome, and no prospective efficacy power calculation or multiplicity strategy supported confirmatory interpretation. Further evaluation should prespecify feasibility criteria, primary outcomes, retention procedures, and the required number of independently allocated classes. Pilot-study guidance emphasizes using preliminary studies to assess feasibility and inform subsequent evaluation, whereas randomized-trial recommendations do not directly establish compliance with this nonrandomized design27. Multisite replication, masked external scoring, stronger measurement instruments, and follow-up of internship or workplace performance would extend the evidence. The present protocol provides a structured basis for implementation and refinement; comparative effectiveness remains unresolved.
披露
The authors have no competing financial interests or other conflicts of interest to disclose. OpenAI ChatGPT was used during manuscript preparation to assist with English-language editing, text organization, and wording refinement, including figure and table legend wording. It was not used to generate, fabricate, modify, or analyze research data, calculate statistical results, or determine the study’s interpretations or conclusions. All AI-assisted content was critically reviewed, verified, and revised by the authors, who take full responsibility for the accuracy, originality, and integrity of the work.
致谢
The authors thank all students who participated in the study and the instructors and evaluators who assisted with course implementation, performance assessment, and data collection. The authors also acknowledge Xi’an FanYi University for providing the institutional and administrative support required to conduct the study. This research received no external funding.
材料
| 姓名 | 公司 | 目录编号 | 评论 |
|---|---|---|---|
| IBM SPSS Statistics | IBM | 30.0.0 | Descriptive statistics, reliability, evaluator agreement, and exploratory comparisons |
| Informed consent form | Study team | 1 | Consent for research participation |
| Interview coding framework | Study team | Supplementary File 2, Section 8 | Independent coding and consensus |
| Microsoft Excel | Microsoft | Microsoft 365, 2606 | Data management and score calculations |
| Microsoft Word | Microsoft | Microsoft 365, 2606 | Assessment documents and transcripts |
| NVivo | Lumivero | 15.3 | Qualitative-data management |
| Peer-panel rating form | Study team | Supplementary File 2, Section 6 | Formative team feedback |
| Professional-knowledge assessments | Study team | Supplementary File 2, Section 1 | Baseline and post-course assessments; 45 minutes, 100 points each |
| Questionnaire instruments | Study team | Supplementary File 2, Section 3 | Engagement, self-efficacy, employability perception, satisfaction, and teaching-process perception |
| Semi-structured interview guide | Study team | Supplementary File 2, Section 7 | Common questions for both conditions |
| Task-performance evaluator rating form | Study team | Supplementary File 2, Section 5 | Five domain ratings and one holistic rating |
| Tourism-planning assessments | Study team | Supplementary File 2, Section 2 | Baseline and post-course assessments; 60 minutes, 100 points each |
| Wenjuanxing online questionnaire platform | Wenjuanxing | www.wjx.cn; accessed June 14, 2026 | Questionnaire administration and export |
| Windows 11 | Microsoft | 24H2 | Operating system |
参考文献
- Sigala M. Rethinking tourism and hospitality education when nothing is normal: restart, recover, or rebuild. J Hosp Tour Res. 2021;45(5):920-923.
- Minor K, McLoughlin E, Carlisle S. The digital skills gap—is it time to rethink the needs of tourism and hospitality organizations in the UK? J Hosp Tour Educ. 2025;37(3):301-312.
- Morris TH. Experiential learning—a systematic review and revision of Kolb’s model. Interact Learn Environ. 2020;28(8):1064-1077. doi:10.1080/10494820.2019.1570279.
- Guo P, Saab N, Post LS, Admiraal W. A review of project-based learning in higher education: student outcomes and measures. Int J Educ Res. 2020;102:101586.
- Vlachopoulos D, Makri A. A systematic literature review on authentic assessment in higher education: best practices for the development of 21st century skills and policy considerations. Stud Educ Eval. 2024;83:101425.
- Ruhanen L, Axelsen M, Bowles L. Engaging students through authentic learning: connecting with international tourism partners. J Hosp Leis Sport Tour Educ. 2021;29:100291.
- Zhang K, et al. Nature-based experiential learning as a framework for preparing responsible tourism practitioners. J Hosp Leis Sport Tour Educ. 2021;29:100297.
- Phi GT, Clausen HB. Fostering innovation competencies in tourism higher education via design-based and value-based learning. J Hosp Leis Sport Tour Educ. 2021;29:100298.
- Espinoza-Figueroa F, et al. Research-based learning (RBL): added-value in tourism education. J Hosp Leis Sport Tour Educ. 2021;28:100312.
- Doğantan E. Experiential learning through the design thinking approach in tourism education. J Hosp Leis Sport Tour Educ. 2023;33:100460.
- Choe Y, Kim N. From the classroom to the Living Lab for developing competencies in tourism higher education. J Hosp Leis Sport Tour Educ. 2024;35:100511.
- Sándorová Z, Repáňová T, Palenčíková Z, Beták N. Design thinking—a revolutionary new approach in tourism education? J Hosp Leis Sport Tour Educ. 2020;26:100238.
- Handley MA, Lyles CR, McCulloch C, Cattamanchi A. Selecting and improving quasi-experimental designs in effectiveness and implementation research. Annu Rev Public Health. 2018;39:5–25.
- Fredricks JA, Filsecker M, Lawson MA. Student engagement, context, and adjustment: addressing definitional, measurement, and methodological issues. Learn Instr. 2016;43:1–4.
- Honicke T, Broadbent J. The influence of academic self-efficacy on academic performance: a systematic review. Educ Res Rev. 2016;17:63–84.
- Vanhercke D, De Cuyper N, Peeters E, De Witte H. Defining perceived employability: a psychological approach. Pers Rev. 2014;43(4):592–605.
- Revelle W, Condon DM. Reliability from alpha to omega: a tutorial. Psychol Assess. 2019;31(12):1395–1411.
- Koo TK, Li MY. A guideline of selecting and reporting intraclass correlation coefficients for reliability research. J Chiropr Med. 2016;15(2):155–163.
- Leyrat C, Morgan KE, Leurent B, Kahan BC. Cluster randomized trials with a small number of clusters: which analyses should be used? Int J Epidemiol. 2018;47(1):321–331.
- Guest G, MacQueen KM, Namey EE. Applied Thematic Analysis. Thousand Oaks, CA: SAGE Publications; 2012.
- Assen H, Benhadda L, Losekoot E, van Diggelen M. Design thinking in hospitality education: lessons learned and future opportunities. J Hosp Leis Sport Tour Educ. 2023;32:100439.
- Stockard J, Wood TW, Coughlin C, Rasplica Khoury C. The effectiveness of Direct Instruction curricula: a meta-analysis of a half century of research. Rev Educ Res. 2018;88(4):479–507.
- Qiu X. Functions of oral monologic tasks: effects of topic familiarity on L2 speaking performance. Lang Teach Res. 2020;24(6):745–764.
- Clarke M. Rethinking graduate employability: the role of capital, individual attributes and context. Stud High Educ. 2018;43(11):1923–1937.
- Hemming K, Taljaard M. Key considerations for designing, conducting and analysing a cluster randomized trial. Int J Epidemiol. 2023;52(5):1648–1658.
- Cinelli C, Forney A, Pearl J. A crash course in good and bad controls. Sociol Methods Res. 2024;53(3):1071–1104.
- Eldridge SM, et al. CONSORT 2010 statement: extension to randomised pilot and feasibility trials. BMJ. 2016;355:i5239.