This cross-sectional study examines how system transparency, system safety, and service quality are associated with autonomous taxi use intention through perceived risk and online word-of-mouth information evaluation, with trust and conformity tendency tested as moderators.
研究文章
Dual-Path Associations Between System Operation Quality and Autonomous Taxi Use Intention in a Cross-Sectional Survey
本文内容
摘要
摘要
This cross-sectional study examines how system operation quality is associated with intention to use autonomous taxis through personal cognitive and social information pathways. Residents of Wuhan, Suzhou, and Shanghai who had heard of or been exposed to autonomous taxi services completed an anonymous 5-point Likert questionnaire. System transparency, system safety, and service quality were modeled as operation-quality dimensions; perceived risk and online word-of-mouth (OWOM) information evaluation were tested as parallel statistical mediators, with trust and conformity tendency as moderators. Of 850 submitted questionnaires, 18 failed the attention check, 9 failed the lie-detection item, and 20 met the prespecified absolute standardized Z-score screening criterion of 3, leaving 803 cases in the primary analytic sample. Confirmatory factor analysis showed acceptable reliability and validity, and the structural model showed good fit (χ2/df = 1.093, RMSEA = 0.011, CFI = 0.997). All three operation-quality dimensions were associated with lower perceived risk, more favorable OWOM information evaluation, and greater intention to use. All six indirect associations were supported by bootstrap confidence intervals. Trust weakened the negative association between perceived risk and intention to use, whereas conformity tendency strengthened the positive association between OWOM information evaluation and intention to use. Because the study used a non-probability cross-sectional sample, the findings are interpreted as associations and should not be generalized beyond comparable populations without further validation.
引言
Advances in digital technologies, industrial upgrading, and artificial intelligence computing capacity are reshaping the automotive industry and accelerating the transition from advanced driver-assistance systems to highly automated and autonomous mobility. Autonomous taxi services are a particularly visible application because they combine automated driving, platform-based service delivery, continuous data processing, and direct passenger exposure to algorithmic decisions1. Commercial deployment has expanded in several Chinese cities, yet broad adoption remains uncertain. Potential users may value travel efficiency and convenience while simultaneously remaining concerned about operational failures, accident responsibility, privacy, and the reliability of automated decision-making. Negative incidents can also spread rapidly through news and social media, increasing uncertainty among people with limited first-hand experience2,3.
Existing autonomous-driving adoption research commonly emphasizes three domains. Technology acceptance perspectives focus on usefulness, ease of use, and related utility beliefs4. Human-computer interaction and trust research emphasizes transparency, explainability, safety, and the user’s ability to understand system behavior5,6. A third stream highlights social and institutional conditions, including information disclosure, public evaluation, regulation, and social influence7. These perspectives are individually informative, but treating technical performance, personal cognition, and socially transmitted information as separate domains can obscure how they operate together when users decide whether to adopt a high-uncertainty mobility service.
This study therefore conceptualizes system operation quality as an operational-level appraisal represented by three parallel dimensions: system transparency, system safety, and service quality8,9. System transparency captures whether users can understand operating logic, decision processes, and data use. System safety captures perceived protection of passenger information, accounts, and physical safety. Service quality captures timeliness, route efficiency, personalization, comfort, convenience, and overall service dependability. These dimensions are expected to be associated with intention to use both directly and through two distinct psychological-information pathways.
The first pathway is a personal cognitive pathway through perceived risk. When users perceive greater transparency, stronger safety safeguards, and more dependable service, uncertainty concerning operational safety, privacy, and potential losses may be lower. Lower perceived risk should in turn be associated with stronger intention to use10. The second pathway is a social information pathway through evaluation of existing online word-of-mouth (OWOM) information. Because individuals may use online information to supplement or contextualize their own experience, they may rely on existing online reviews and public evaluations when evaluating the service. When operation quality is perceived favorably, these reviews may also be judged as more credible, objective, clear, and useful, and favorable OWOM information evaluation may be associated with stronger usage intention11,12.
The framework also specifies two boundary conditions. Trust is expected to buffer the negative association between perceived risk and intention to use, such that perceived risk becomes less restrictive when confidence in the autonomous taxi system is high13. Conformity tendency is expected to strengthen the positive association between OWOM information evaluation and intention to use, because users who are more susceptible to interpersonal influence are more likely to incorporate socially transmitted evaluations into their own behavioral intentions14,15. By testing the two pathways simultaneously and adding differentiated moderators, the study integrates operational attributes, personal risk appraisal, and social information processing within one model. Because the data are cross-sectional, all mediation and moderation findings are interpreted as statistical associations rather than causal mechanisms.
方案
This study was reviewed and approved by the Ethics Committee of Yancheng Polytechnic College (approval no. J202839; September 2025). Electronically informed consent was presented before the questionnaire began. Participation proceeded only after consent was indicated, participation was voluntary, and respondents could stop at any time. The details of all the instruments, methodologies, and software used are listed in the Table of Materials.
Study setting and target population
This study was conducted in Wuhan, Suzhou, and Shanghai, three Chinese cities in which autonomous taxi pilot services were operating during the study period. Recruitment was restricted to residents of these cities so that respondents were more likely to have relevant awareness or usage-related experience. The site selection was study-specific and is not intended as a requirement for replication in other regions.
Participant eligibility
Eligibility required respondents to have previously heard of or been exposed to autonomous taxi services. Respondents reporting no prior awareness or exposure did not proceed with the substantive questionnaire. Prior actual use of an autonomous taxi was not required for eligibility. The usage-frequency item did not include a 'never used' response option; consequently, the archived dataset cannot unambiguously distinguish respondents with prior actual use from respondents with awareness/exposure but no prior use.
Participant anonymity and data minimization
The questionnaire was configured so that no personally identifiable information was collected. Demographic variables were limited to gender, age, education level, occupation, monthly income, and frequency of autonomous taxi use. The de-identified response dataset is publicly deposited in figshare (see Data Availability). The retained research copy is stored on the Zhihuixing platform and will be retained for two years.
Questionnaire development and measurement configuration
Measurement instrument adaptation
Translation and cultural adaptation
Measurement items were adapted from published scales16,17,18,19,20,21 and contextualized to autonomous taxi use. Trust and intention items were derived from automated-vehicle or automated-shuttle research, whereas several transparencies, perceived-risk, OWOM, and social-influence items originated in broader digital-service, algorithmic-information, eWOM, or interpersonal-influence contexts. The Chinese questionnaire was prepared using back-translation and expert review, with wording changes limited to contextual fit while preserving the intended construct meaning and measurement structure.
Response scale
All substantive measurement items were rated on a 5-point Likert scale from 1 (strongly disagree) to 5 (strongly agree), using the same response anchors across the eight latent variables. No items were reverse-coded; this design choice is acknowledged when evaluating potential common-method bias.
Questionnaire structure
Demographic section
The first questionnaire section recorded gender, age, education level, occupation, monthly income, and autonomous taxi usage frequency. The usage-frequency item offered three response categories (1–2 times/month, 1–2 times/week, and ≥3 times/week) and did not include a 'never used' category.
Construct-measurement section
The second section measured system transparency (ST), system safety (SS), service quality (SQ), perceived risk (PR), OWOM information evaluation (OWOM), trust (TR), conformity tendency (CT), and intention to use (IU).
Measurement items
System Transparency (ST; 3 items)
System transparency was measured with three items: ST1, I believe that autonomous taxis can clearly explain ride-related information to passengers; ST2, I think that autonomous taxis transparently display their decision-making and operational processes during operation; and ST3, I am aware of what types of personal data autonomous taxis collect and how these data are used during travel16.
System Safety (SS; 4 items)
System safety was measured with four items: SS1, I believe that autonomous taxis have adequate mechanisms to protect passengers' personal information; SS2, I believe that autonomous taxis provide reliable safeguards for payment and account security; SS3, I believe that autonomous taxis have sufficient safety protection capabilities to safeguard passengers; and SS4, I believe that safety features of autonomous taxis, such as audio recording, one-touch emergency alerts, and trip-sharing functions, provide effective passenger protection.
Service Quality (SQ; 4 items)
Service quality was measured with four items: SQ1, I believe that autonomous taxis can deliver passengers to their destinations on time; SQ2, I believe that autonomous taxi systems can follow optimal routes without unnecessary detours; SQ3, I believe that autonomous taxis can provide personalized travel services that meet my needs; and SQ4, I believe that autonomous taxis can offer a comfortable and convenient riding experience.
Perceived Risk (PR; 3 items)
Perceived risk was measured with three items: PR1, I am concerned about potential operational safety risks when using autonomous taxis; PR2, I am concerned about potential personal information leakage when using autonomous taxis; and PR3, I am concerned that using autonomous taxis may involve privacy-related risks17.
OWOM Information Evaluation (OWOM; 5 items)
OWOM information evaluation was measured with five items: OWOM1, I believe that reviews and evaluations of autonomous taxis are reasonable; OWOM2, I believe that reviews and evaluations of autonomous taxis are objective and credible; OWOM3, I believe that reviews and evaluations of autonomous taxis are easy to understand; OWOM4, I believe that reviews and evaluations of autonomous taxis are clearly expressed; and OWOM5, overall, I believe that the quality of reviews and evaluations of autonomous taxis is high18.
Trust (TR; 4 items)
Trust was measured with four items: TR1, I trust that autonomous taxi systems can provide reliable services to passengers; TR2, I believe that autonomous taxis are trustworthy during operation; TR3, I have confidence in autonomous taxis' ability to ensure passenger safety; and TR4, overall, I trust the operational outcomes of autonomous taxis19.
Conformity Tendency (CT; 4 items)
Conformity tendency was measured with four items: CT1, if people around me believe that autonomous taxis are worth using, I would also be inclined to choose them; CT2, the opinions of people around me regarding the use of autonomous taxis influence my decision; CT3, when deciding whether to use autonomous taxis, I refer to the opinions of others; and CT4, I seek information about autonomous taxis from experienced users or professionals20.
Intention to Use (IU; 4 items)
Intention to use was measured with four items: IU1, I am willing to adopt autonomous taxis as a mode of transportation in the future; IU2, if given the opportunity, I would give priority to using autonomous taxi services; IU3, I plan to adopt autonomous taxis for my future travel; and IU4, overall, I have the intention to use autonomous taxi services21.
Data-quality checks
Seat-belt plausibility (lie-detection) item
The questionnaire included the statement 'Wearing a seat belt during travel helps improve passenger safety.' Responses were excluded when they met the prespecified failure threshold of responses of 1 ('strongly disagree') or 2 ('disagree') on the 5-point scale.
Attention-check item
The questionnaire also included the instruction 'To prove that you have carefully read the questionnaire, please select strongly agree for this item.' Responses that did not select 'strongly agree' were excluded.
Online recruitment and survey administration
Eligibility screening
Awareness/exposure screening question
An eligibility question at the beginning of the online survey asked whether the participant had previously heard of or been exposed to autonomous taxi services. Only respondents selecting 'Yes' continued; respondents selecting 'No' exited the questionnaire.
Recruitment
Survey distribution
The survey link was distributed through social media platforms, community groups, and personal networks to residents of Wuhan, Suzhou, and Shanghai. This recruitment strategy constituted a non-probability, self-selected convenience sample. The same questionnaire version and response settings were used throughout data collection. The questionnaire was hosted on the Zhihuixing online survey platform.
Data-collection period
Anonymous survey administration
Responses were collected from September 1, 2025, through September 20, 2025. Electronic informed consent preceded the substantive survey, participation was voluntary, and no personally identifiable information was collected. Because the survey link was distributed through open convenience channels, the number of individuals invited was not known; accordingly, the proportion retained after cleaning is not reported as a response rate. No formal a priori power analysis was conducted. The final primary sample (N = 803) provided approximately 25.9 participants per observed measurement item across the 31 substantive items. Sample adequacy was therefore evaluated in conjunction with model convergence, parameter standard errors, and the prespecified global fit indices rather than by a post hoc claim of statistical power.
Raw-data export
At the end of data collection, all questionnaire responses were exported into a rectangular dataset containing one row per respondent and one column per demographic variable, screening item, quality-control item, and measurement item. An unmodified raw-data copy was retained before cleaning.
Data cleaning and analytic-sample construction
Quality-check exclusions
Attention-check exclusion
Responses that did not select 'strongly agree' for the attention-check item were removed from the primary analytic dataset, and the number excluded for this reason was recorded separately.
Seat-belt plausibility-item exclusion
Responses meeting the prespecified failure threshold for the seat-belt safety item were removed from the primary analytic dataset, and the number excluded for this reason was recorded separately. The exact exclusion threshold was responses of 1 ('strongly disagree') or 2 ('disagree').
Standardized outlier screening
Observed-item Z-scores
Standardized Z-scores were computed for each observed measurement item belonging to ST, SS, SQ, PR, OWOM, TR, CT, and IU after the two quality-check exclusions.
Primary outlier rule and sensitivity analysis
For the primary analysis, a response was screened out if any observed item had an absolute standardized Z-score greater than 3; 20 cases met this rule. Because 5-point Likert responses are discrete and bounded and this criterion can remove legitimate polarized responses, the outlier rule is treated as a sensitivity-oriented screening decision rather than evidence that the respondents were invalid. A sensitivity analysis retained all 20 screened cases (N = 823) and re-estimated the composite-score regression and moderation models. The resulting coefficients were compared with those from the corresponding N = 803 analysis to assess the stability of direction, statistical significance, and effect magnitude.
Descriptive sample analysis
Demographic variables
Counts and percentages
Counts and percentages were calculated for each category of gender, age, education, occupation, monthly income, and autonomous taxi usage frequency using the final primary analytic sample as the denominator.
Measurement-model evaluation
Internal consistency and convergent validity
Item loadings and reliability indices
A confirmatory factor analysis was fitted for the eight latent constructs. Standardized factor loadings, Cronbach's α, composite reliability (CR), and average variance extracted (AVE) were estimated. Internal consistency was evaluated using α and CR values of at least 0.70, and convergent validity was evaluated using AVE values greater than 0.50. Cronbach's α was recalculated directly from the observed item responses in the N = 803 primary sample.
Measurement-model fit
Global fit indices
Measurement-model fit was summarized using χ2, degrees of freedom, χ2/df, goodness-of-fit index (GFI), incremental fit index (IFI), comparative fit index (CFI), Tucker-Lewis index (TLI), and root mean square error of approximation (RMSEA). The prespecified criteria were χ2/df between 1 and 3, GFI/IFI/CFI/TLI greater than 0.90, and RMSEA below 0.08.
Discriminant validity and common-method-bias screening
Fornell-Larcker criterion
For each construct, the square root of AVE was compared with its correlations with all other constructs. Discriminant validity was considered satisfactory when each square root of AVE exceeded the corresponding interconstruct correlations22.
HTMT ratios and Harman-style diagnostic
The heterotrait-monotrait (HTMT) ratio was calculated for every construct pair, with values below 0.85 treated as satisfactory evidence of discriminant validity23. Because all study variables were obtained from the same respondents at one time point using common Likert response anchors, common-method bias was screened using a Harman-style unrotated first-component diagnostic. All 31 substantive Likert items were entered simultaneously, and the proportion of variance accounted for by the first unrotated component was examined against a conventional 50% screening threshold. This diagnostic is treated as a preliminary screen rather than definitive evidence that common-method bias is absent. For each construct pair, HTMT was calculated from item-level Pearson correlations as the mean absolute cross-construct item correlation divided by the geometric mean of the mean absolute within-construct inter-item correlations for the two constructs.
Structural-model estimation and direct-path testing
Dual-path structural model
Personal cognitive pathway
The structural model specified paths from ST, SS, and SQ to PR and from PR to IU. Direct paths from ST, SS, and SQ to IU were retained so that indirect associations could be estimated while accounting for the corresponding direct associations.
Social information pathway
The model also specified paths from ST, SS, and SQ to OWOM information evaluation and from OWOM information evaluation to IU. The personal cognitive and social information pathways were estimated simultaneously.
Full research model
Figure 1 presents the full research model, including the three operation-quality dimensions, the two statistical mediators, the direct paths to IU, and the two moderators.
Structural-model estimation
Maximum-likelihood estimation and software
The CFA and structural model were estimated by maximum likelihood using IBM SPSS Amos version 26.0 (IBM Corp., Armonk, NY, USA). The same global fit indices were reported for the measurement and structural models.
Direct-path estimates
For each structural path, the unstandardized coefficient, standard error, Z statistic, p value, standardized coefficient, and hypothesis-support decision were reported. Interpretation was restricted to associations because the data were cross-sectional.
Statistical mediation analysis
Indirect associations through PR and OWOM
Bootstrap confidence intervals
Indirect associations for ST→PR→IU, SS→PR→IU, SQ→PR→IU, ST→OWOM→IU, SS→OWOM→IU, and SQ→OWOM→IU were estimated using 5,000 bootstrap resamples. Both bias-corrected and percentile 95% bootstrap confidence intervals were reported, and an indirect association was considered statistically supported when its 95% confidence interval excluded zero.
Interpretation of statistical mediation
Direct and indirect associations were reported together. Indirect paths are described as statistical mediation patterns or indirect associations, not causal mediation, because the cross-sectional design does not establish temporal ordering.
Moderation and Johnson–Neyman analysis
Trust as a moderator of the PR–IU association
Construct scores, centering, and interaction term
PR and TR were mean-centered and their interaction term was constructed. IU was then regressed on PR, TR, and PR × TR using Hayes' PROCESS macro version 3.5 for IBM SPSS Statistics version 26.0, Model 1. The moderation analysis used arithmetic mean scores across the items belonging to each construct. OLS moderation was used as a complementary probing approach because it provides direct Johnson-Neyman regions of significance for observed construct scores; latent-variable moderation was not estimated in the present analysis. No covariates were included in either Model 1 moderation analysis.
Conditional association and Johnson-Neyman analysis
Main effects of PR and TR and the PR × TR interaction were estimated, and the Johnson-Neyman procedure was used to identify the range of mean-centered TR values for which the conditional PR-IU association was statistically distinguishable from zero.
Conformity Tendency as a moderator of the OWOM–IU association
Construct scores, centering, and interaction term
OWOM information evaluation and CT were mean-centered and their interaction term was constructed. IU was regressed on OWOM, CT, and OWOM × CT using the same Model 1 procedure and the same construct-score derivation described above.
Conditional association and Johnson-Neyman analysis
Main effects of OWOM and CT and the OWOM × CT interaction were estimated, and the Johnson-Neyman procedure was used to identify the range of mean-centered CT values for which the conditional OWOM-IU association was statistically distinguishable from zero.
结果
Data cleaning and analytic-sample construction
A total of 850 questionnaires were submitted. Eighteen responses were excluded for failing the attention-check item, 9 were excluded for failing the lie-detection item, and 20 additional cases met the prespecified observed-item |Z| > 3 screening criterion. The primary analytic sample therefore consisted of 803 respondents, representing 94.5% of the submitted questionnaires retained after cleaning. Because the number of individuals invited was not known, 94.5% is a retention/usable-case proportion rather than a survey response rate. Retaining the 20 Z-score-screened cases (N = 823) did not alter the direction or statistical significance of the core composite-score regression paths. Across the direct PR, OWOM, and IU models and the two interaction terms, the largest absolute change in an unstandardized coefficient was 0.017. The PR × TR interaction remained positive and significant (N = 803: b = 0.103, p = 0.008; N = 823: b = 0.108, p = 0.004), and the OWOM × CT interaction also remained positive and significant (N = 803: b = 0.177, p < 0.001; N = 823: b = 0.165, p < 0.001).
Descriptive sample analysis
The final primary sample was relatively balanced by gender (51.7% male and 48.3% female) but was concentrated among younger and more highly educated respondents: 67.0% were aged 20–39 years and 58.0% held a bachelor's degree or higher (Table 1). Corporate employees were the largest occupational group (39.4%), followed by freelancers (24.0%) and self-employed individuals (16.7%). A total of 81.3% reported monthly income between CNY 3,001 and CNY 9,000. In the usage-frequency item, which did not include a 'never used' response option, the 1–2 times/week category was selected most often (56.3%). Because prior actual use was not an eligibility requirement and the item lacked a non-use category, this distribution should not be interpreted as establishing that all respondents were prior autonomous-taxi users. These characteristics should be considered when generalizing the results to broader urban populations.
Measurement-model evaluation
All constructs met the prespecified reliability and convergent-validity criteria. Cronbach's α values recalculated from the observed item responses ranged from 0.774 to 0.852, all above 0.70; CR values ranged from 0.774 to 0.852, and AVE values ranged from 0.533 to 0.571. Standardized factor loadings ranged from 0.689 to 0.791 (Table 2). The confirmatory factor analysis showed good fit: χ2 = 471.917, df = 406, χ2/df = 1.162, GFI = 0.964, IFI = 0.994, CFI = 0.994, TLI = 0.993, and RMSEA = 0.014 (Table 3). The Fornell-Larcker criterion was satisfied for every construct (Table 4), and item-level HTMT values ranged from 0.344 to 0.581, below the 0.85 threshold (Table 5). The relatively low HTMT ratios are consistent with moderate interconstruct correlations and the intended conceptual separation among operational quality, risk, social information, trust, conformity, and intention; they are reported as sample-specific measurement results rather than as evidence of measurement problems. The first unrotated component accounted for 31.07% of the total variance across the 31 substantive items, below the 50% screening threshold.
Structural-model estimation and direct-path testing
The structural model showed good fit: χ2 = 236.106, df = 216, χ2/df = 1.093, GFI = 0.975, IFI = 0.997, CFI = 0.997, TLI = 0.997, and RMSEA = 0.011 (Table 6). ST, SS, and SQ were negatively associated with PR (standardized β = −0.174, −0.273, and −0.288, respectively; all p < 0.001). PR was negatively associated with IU (β = −0.144, p = 0.003). ST, SS, and SQ were positively associated with OWOM information evaluation (β = 0.183, 0.274, and 0.336, respectively; all p < 0.001), and OWOM information evaluation was positively associated with IU (β = 0.115, p = 0.019). Direct associations from ST, SS, and SQ to IU were also significant (β = 0.200, p < 0.001; β = 0.235, p < 0.001; and β = 0.145, p = 0.003, respectively). These results supported H1a–H5c (Table 7).
Statistical mediation analysis
All six bootstrap indirect associations had 95% confidence intervals that excluded zero. The point estimates were 0.024 for ST→PR→IU, 0.040 for SS→PR→IU, 0.041 for SQ→PR→IU, 0.020 for ST→OWOM→IU, 0.032 for SS→OWOM→IU, and 0.039 for SQ→OWOM→IU. The corresponding direct associations remained statistically significant: ST→IU = 0.195, bias-corrected 95% CI [0.105, 0.284]; SS→IU = 0.238, bias-corrected 95% CI [0.143, 0.327]; and SQ→IU = 0.145, bias-corrected 95% CI [0.053, 0.240]. These intervals were obtained from 5,000 bootstrap resamples (Table 8). Thus, H6a–H6c and H7a–H7c were supported as statistical mediation patterns. Because the data were cross-sectional, these estimates do not establish causal mediation.
Moderation and Johnson–Neyman analysis
For H8, PR was negatively associated with IU (coefficient = −0.172, p < 0.001), TR was positively associated with IU (coefficient = 0.364, p < 0.001), and the PR × TR interaction was positive (coefficient = 0.103, 95% CI [0.027, 0.179], p = 0.008; Table 9). The model explained 25.42% of the variance in IU (R2 = 0.2542; F(3, 799) = 90.767, p < 0.001). The Johnson–Neyman threshold was mean-centered TR = 0.822; within the observed moderator range, the PR–IU association was significantly negative below this threshold, whereas at or above the threshold the 95% confidence interval included zero (Figure 2). For H9, OWOM information evaluation was positively associated with IU (coefficient = 0.271, p < 0.001), CT was positively associated with IU (coefficient = 0.273, p < 0.001), and the OWOM × CT interaction was positive (coefficient = 0.177, 95% CI [0.083, 0.271], p < 0.001; Table 10). This model explained 22.37% of the variance in IU (R2 = 0.2237; F(3, 799) = 76.751, p < 0.001). The Johnson–Neyman threshold was mean-centered CT = −0.931; within the observed moderator range, the positive OWOM–IU association was significant above this threshold and not statistically distinguishable from zero at or below it (Figure 3). H8 and H9 were therefore supported. The R2 values indicate that substantial variance in IU remained unexplained by the tested moderation models.
Summary of findings
The combined results are consistent with a dual-path account of autonomous taxi use intention. System transparency, system safety, and service quality were associated with intention to use directly and indirectly through lower perceived risk and more favorable evaluation of existing OWOM information. Trust attenuated the negative PR-IU association, whereas conformity tendency strengthened the positive OWOM-IU association. These findings describe associations in this cross-sectional convenience sample and do not establish causal ordering or population-wide effects.
DATA AVAILABILITY:
The dataset is deposited in figshare: Liu, Tingyu; Zhou, Ronghu; Chen, Min; Yu, Shangchun (2026). Dual-path associations between system operation quality and autonomous taxi use intention in a cross-sectional survey. figshare. Dataset. https://doi.org/10.6084/m9.figshare.34050912.v1
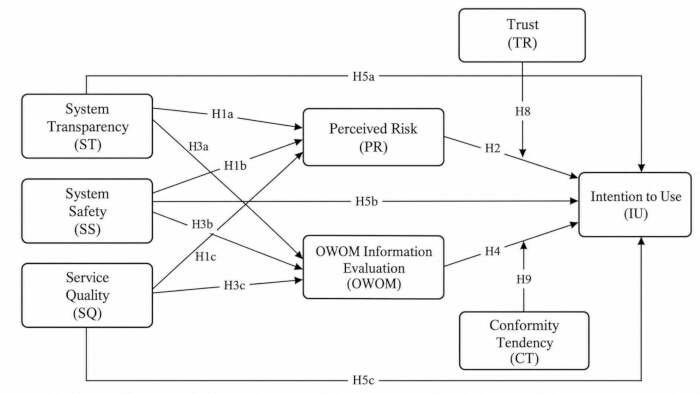
Figure 1: Research model. Conceptual dual-path model linking system transparency (ST), system safety (SS), and service quality (SQ) to intention to use (IU) through perceived risk (PR) and online word-of-mouth (OWOM) information evaluation. Trust (TR) moderates the PR–IU association, and conformity tendency (CT) moderates the OWOM–IU association. Please click here to view a larger version of this figure.
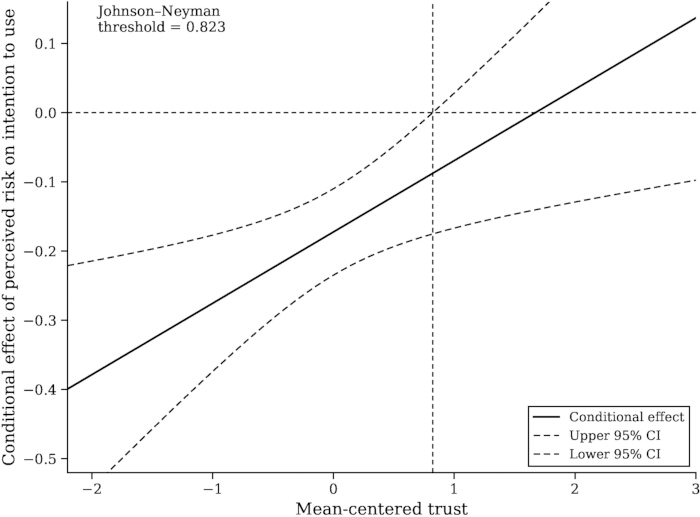
Figure 2: Johnson–Neyman plot for Trust. Conditional unstandardized association between perceived risk and intention to use across mean-centered levels of Trust (N = 803). The x-axis is the mean-centered Trust composite score in 5-point Likert-scale units, and the y-axis is the conditional PR–IU slope in intention-score units per one-unit increase in perceived risk. The Johnson–Neyman threshold is 0.823; within the observed moderator range, the region of statistical significance is mean-centered TR < 0.822, where the PR–IU association is significantly negative; at or above 0.822, the 95% confidence interval includes zero. Please click here to view a larger version of this figure.
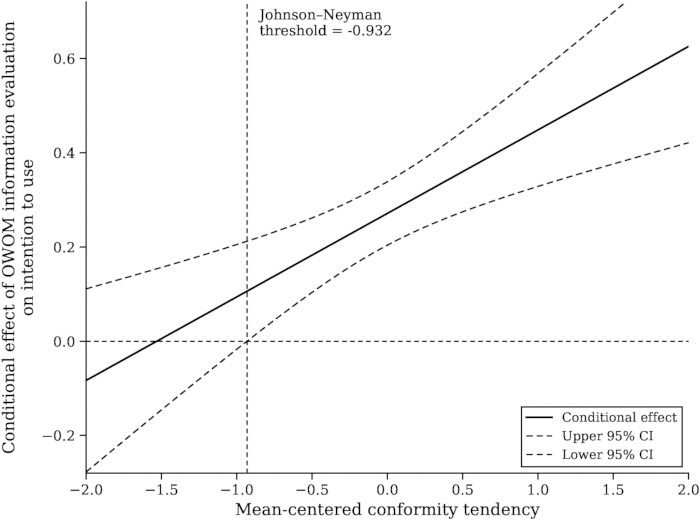
Figure 3: Johnson–Neyman plot for Conformity Tendency. Conditional unstandardized association between OWOM information evaluation and intention to use across mean-centered levels of Conformity Tendency (N = 803). The x-axis is the mean-centered CT composite score in 5-point Likert-scale units, and the y-axis is the conditional OWOM–IU slope in intention-score units per one-unit increase in OWOM information evaluation. The Johnson–Neyman threshold is −0.932; within the observed moderator range, the region of statistical significance is mean-centered CT > −0.931, where the OWOM–IU association is significantly positive; at or below −0.931, the 95% confidence interval includes zero. Please click here to view a larger version of this figure.
| Characteristic | Category | Number (N = 803) | Percentage (%) |
| Gender | Male | 415 | 51.7 |
| Gender | Female | 388 | 48.3 |
| Age | Under 20 | 65 | 8.1 |
| Age | 20–29 | 292 | 36.4 |
| Age | 30–39 | 246 | 30.6 |
| Age | 40–49 | 135 | 16.8 |
| Age | 50 or above | 65 | 8.1 |
| Education | Junior high school or below | 118 | 14.7 |
| Education | Associate degree | 219 | 27.3 |
| Education | Bachelor's degree | 318 | 39.6 |
| Education | Master's degree | 96 | 12 |
| Education | Doctoral degree or above | 52 | 6.5 |
| Occupation | Student | 65 | 8.1 |
| Occupation | Civil servants / Public institution employees | 63 | 7.8 |
| Occupation | Corporate employees | 316 | 39.4 |
| Occupation | Freelancers | 193 | 24 |
| Occupation | Self-employed individuals | 134 | 16.7 |
| Occupation | Other | 32 | 4 |
| Monthly income | Under CNY 3,000 | 82 | 10.2 |
| Monthly income | CNY 3,001–5,000 | 194 | 24.2 |
| Monthly income | CNY 5,001–7,000 | 298 | 37.1 |
| Monthly income | CNY 7,001–9,000 | 161 | 20 |
| Monthly income | CNY 9,001–11,000 | 44 | 5.5 |
| Monthly income | More than CNY 11,001 | 24 | 3 |
| Usage frequency | Occasional use (1–2 times per month) | 198 | 24.7 |
| Usage frequency | Regular use (1–2 times per week) | 452 | 56.3 |
| Usage frequency | Frequent use (≥3 times per week) | 153 | 19.1 |
Table 1: Sample characteristics. Numbers and percentages for gender, age, education, occupation, monthly income, and autonomous taxi usage frequency among the 803 respondents in the final analytic sample. The usage-frequency item did not include a “never used” response option; therefore, these frequency categories should not be interpreted as confirming prior autonomous-taxi use for every respondent.
| Construct | Indicator | Standardized factor loading | CR | AVE | Cronbach's α |
| System Transparency | ST1 | 0.776 | 0.774 | 0.534 | 0.774 |
| ST2 | 0.689 | ||||
| ST3 | 0.725 | ||||
| System Safety | SS1 | 0.743 | 0.841 | 0.570 | 0.840 |
| SS2 | 0.729 | ||||
| SS3 | 0.755 | ||||
| SS4 | 0.791 | ||||
| Service Quality | SQ1 | 0.754 | 0.836 | 0.560 | 0.836 |
| SQ2 | 0.759 | ||||
| SQ3 | 0.732 | ||||
| SQ4 | 0.748 | ||||
| Perceived Risk | PR1 | 0.759 | 0.798 | 0.569 | 0.798 |
| PR2 | 0.738 | ||||
| PR3 | 0.766 | ||||
| OWOM Information Evaluation | OWOM1 | 0.714 | 0.852 | 0.535 | 0.852 |
| OWOM2 | 0.707 | ||||
| OWOM3 | 0.727 | ||||
| OWOM4 | 0.739 | ||||
| OWOM5 | 0.769 | ||||
| Trust | TR1 | 0.770 | 0.842 | 0.571 | 0.842 |
| TR2 | 0.774 | ||||
| TR3 | 0.735 | ||||
| TR4 | 0.744 | ||||
| Conformity Tendency | CT1 | 0.738 | 0.829 | 0.547 | 0.828 |
| CT2 | 0.716 | ||||
| CT3 | 0.759 | ||||
| CT4 | 0.746 | ||||
| Intention to Use | IU1 | 0.750 | 0.820 | 0.533 | 0.820 |
| IU2 | 0.727 | ||||
| IU3 | 0.690 | ||||
| IU4 | 0.752 |
Table 2: Confirmatory factor analysis and reliability. Standardized factor loadings, composite reliability, average variance extracted, and Cronbach’s α for ST, SS, SQ, PR, OWOM, TR, CT, and IU. Cronbach's α values were recalculated from the observed item responses in the N = 803 primary sample.
| Fit indices | χ2 | df | χ2/df | GFI | IFI | CFI | TLI | RMSEA |
| Measurement model | 471.917 | 406 | 1.162 | 0.964 | 0.994 | 0.994 | 0.993 | 0.014 |
| Recommended criteria | — | — | 1–3 | >0.90 | >0.90 | >0.90 | >0.90 | <0.08 |
Table 3: Measurement-model fit. χ2, degrees of freedom, χ2/df, GFI, IFI, CFI, TLI, and RMSEA for the confirmatory factor analysis measurement model, with recommended criteria.
| Construct | ST | SS | SQ | PR | OWOM | TR | CT | IU | AVE |
| ST | 0.731 | 0.534 | |||||||
| SS | 0.445 | 0.755 | 0.570 | ||||||
| SQ | 0.346 | 0.450 | 0.748 | 0.560 | |||||
| PR | -0.390 | -0.475 | -0.465 | 0.754 | 0.569 | ||||
| OWOM | 0.417 | 0.502 | 0.518 | -0.429 | 0.732 | 0.535 | |||
| TR | 0.445 | 0.516 | 0.422 | -0.581 | 0.505 | 0.756 | 0.571 | ||
| CT | 0.449 | 0.483 | 0.405 | -0.399 | 0.489 | 0.459 | 0.740 | 0.547 | |
| IU | 0.459 | 0.515 | 0.446 | -0.451 | 0.453 | 0.566 | 0.480 | 0.730 | 0.533 |
Table 4: Fornell–Larcker discriminant validity. Diagonal values represent the square roots of AVE, off-diagonal values represent interconstruct correlations, and AVE values are reported for all eight latent constructs.
| Construct | ST | SS | SQ | PR | OWOM | TR | CT | IU |
| ST | — | |||||||
| SS | 0.451 | — | ||||||
| SQ | 0.344 | 0.452 | — | |||||
| PR | 0.390 | 0.478 | 0.464 | — | ||||
| OWOM | 0.416 | 0.504 | 0.517 | 0.430 | — | |||
| TR | 0.437 | 0.516 | 0.421 | 0.581 | 0.506 | — | ||
| CT | 0.448 | 0.486 | 0.404 | 0.399 | 0.489 | 0.456 | — | |
| IU | 0.458 | 0.519 | 0.445 | 0.455 | 0.452 | 0.565 | 0.476 | — |
Table 5: HTMT discriminant-validity results. Heterotrait–monotrait ratios for all pairs of latent constructs. All reported HTMT ratios are below the prespecified 0.85 threshold. HTMT values were calculated from item-level correlations using the standard heterotrait–monotrait ratio described in the Methods.
| Fit indices | χ2 | df | χ2/df | GFI | IFI | CFI | TLI | RMSEA |
| Structural model | 236.106 | 216 | 1.093 | 0.975 | 0.997 | 0.997 | 0.997 | 0.011 |
| Recommended criteria | — | — | 1–3 | >0.90 | >0.90 | >0.90 | >0.90 | <0.08 |
Table 6: Structural-model fit. χ2, degrees of freedom, χ2/df, GFI, IFI, CFI, TLI, and RMSEA for the structural model, with recommended criteria.
| Hypothesis | Path | Unstandardized coefficient | S.E. | Z | p | Standardized coefficient | Result |
| H1a | ST→PR | -0.170 | 0.046 | -3.665 | <0.001 | -0.174 | Supported |
| H1b | SS→PR | -0.278 | 0.050 | -5.514 | <0.001 | -0.273 | Supported |
| H1c | SQ→PR | -0.289 | 0.047 | -6.180 | <0.001 | -0.288 | Supported |
| H2 | PR→IU | -0.143 | 0.048 | -2.967 | 0.003 | -0.144 | Supported |
| H3a | ST→OWOM | 0.169 | 0.041 | 4.132 | <0.001 | 0.183 | Supported |
| H3b | SS→OWOM | 0.264 | 0.045 | 5.910 | <0.001 | 0.274 | Supported |
| H3c | SQ→OWOM | 0.319 | 0.042 | 7.547 | <0.001 | 0.336 | Supported |
| H4 | OWOM→IU | 0.121 | 0.052 | 2.337 | 0.019 | 0.115 | Supported |
| H5a | ST→IU | 0.195 | 0.046 | 4.271 | <0.001 | 0.200 | Supported |
| H5b | SS→IU | 0.238 | 0.051 | 4.660 | <0.001 | 0.235 | Supported |
| H5c | SQ→IU | 0.145 | 0.049 | 2.980 | 0.003 | 0.145 | Supported |
Table 7: Structural path analysis. Unstandardized coefficients, standard errors, Z statistics, two-sided p values (reported as p < 0.001 when smaller than 0.001), standardized coefficients, and support decisions for H1a–H5c.
| Effect type | Hypothesis | Path | Point estimate | S.E. | Z | Bias-corrected 95% CI | Percentile 95% CI | p | ||
| Lower | Upper | Lower | Upper | |||||||
| Direct effect | H5a | ST→IU | 0.195 | 0.046 | 4.244 | 0.105 | 0.284 | 0.103 | 0.282 | <0.001 |
| Indirect effect | H6a | ST→PR→IU | 0.024 | 0.010 | 2.327 | 0.008 | 0.050 | 0.007 | 0.047 | 0.020 |
| Indirect effect | H7a | ST→OWOM→IU | 0.020 | 0.010 | 2.054 | 0.005 | 0.046 | 0.003 | 0.042 | 0.040 |
| Direct effect | H5b | SS→IU | 0.238 | 0.047 | 5.004 | 0.143 | 0.327 | 0.149 | 0.333 | <0.001 |
| Indirect effect | H6b | SS→PR→IU | 0.040 | 0.016 | 2.511 | 0.013 | 0.074 | 0.013 | 0.074 | 0.012 |
| Indirect effect | H7b | SS→OWOM→IU | 0.032 | 0.015 | 2.195 | 0.008 | 0.067 | 0.005 | 0.062 | 0.028 |
| Direct effect | H5c | SQ→IU | 0.145 | 0.048 | 3.030 | 0.053 | 0.240 | 0.048 | 0.235 | 0.002 |
| Indirect effect | H6c | SQ→PR→IU | 0.041 | 0.016 | 2.634 | 0.014 | 0.075 | 0.014 | 0.076 | 0.008 |
| Indirect effect | H7c | SQ→OWOM→IU | 0.039 | 0.017 | 2.230 | 0.009 | 0.079 | 0.006 | 0.072 | 0.026 |
Table 8: Statistical mediation analysis. Direct and indirect effect estimates, standard errors, Z statistics, two-sided p values, and bias-corrected and percentile 95% confidence intervals based on 5,000 bootstrap resamples are reported for the perceived-risk and OWOM pathways.
| DV | IV | Coefficient | S.E. | t | p | LLCI | ULCI |
| IU | Constant | 3.451 | 0.02 | 173.722 | <0.001 | 3.412 | 3.49 |
| IU | PR | -0.172 | 0.032 | -5.416 | <0.001 | -0.235 | -0.11 |
| IU | TR | 0.364 | 0.033 | 10.978 | <0.001 | 0.299 | 0.429 |
| IU | PR × TR | 0.103 | 0.039 | 2.674 | 0.008 | 0.027 | 0.179 |
Table 9: Moderating effect of Trust. Ordinary least squares coefficients, standard errors, t statistics, two-sided p values, and 95% confidence intervals are reported for PR, TR, and PR × TR predicting IU. R2 = 0.2542; F(3, 799) = 90.767, p < 0.001. The Johnson–Neyman threshold for mean-centered TR was 0.822.
| DV | IV | Coefficient | S.E. | t | p | LLCI | ULCI |
| IU | Constant | 3.404 | 0.02 | 169.187 | <0.001 | 3.365 | 3.444 |
| IU | OWOM | 0.271 | 0.034 | 7.89 | <0.001 | 0.204 | 0.339 |
| IU | CT | 0.273 | 0.033 | 8.265 | <0.001 | 0.208 | 0.338 |
| IU | OWOM × CT | 0.177 | 0.048 | 3.701 | <0.001 | 0.083 | 0.271 |
Table 10: Moderating effect of Conformity Tendency. Ordinary least squares coefficients, standard errors, t statistics, two-sided p values, and 95% confidence intervals are reported for OWOM, CT, and OWOM × CT predicting IU. R2 = 0.2237; F(3, 799) = 76.751, p < 0.001. The Johnson–Neyman threshold for mean-centered CT was −0.931.
讨论
This study integrates operational perceptions, personal risk appraisal, and socially transmitted information in a dual-path empirical model of autonomous taxi use intention. System transparency, system safety, and service quality were modeled as parallel dimensions of system operation quality, while perceived risk and OWOM information evaluation were estimated simultaneously as distinct statistical mediators. In the analyzed sample, both pathways contributed independent explanatory information after the other pathway was included, supporting the value of examining personal cognition and social information processing in the same structural framework24,25.
The findings extend research on high-uncertainty technologies in two respects. First, system operation quality is evaluated at the service-use level rather than only through general technology-acceptance beliefs such as usefulness or ease of use. Second, the model separates evaluation of existing OWOM information from the generation or sharing of OWOM. This distinction is relevant when individuals use public evaluations to supplement or contextualize their own experience with autonomous taxi services. The parallel-path specification further allows comparison of associations operating through risk appraisal and through interpretation of socially transmitted information26.
The moderation results add evidence of user heterogeneity. Trust weakened the negative association between perceived risk and intention to use, suggesting that the same reported level of risk may be less strongly associated with lower intention among respondents expressing greater trust27,28. Conformity tendency strengthened the positive association between OWOM information evaluation and intention to use, suggesting that favorable public evaluations may be more strongly associated with intention among respondents who report greater susceptibility to others' opinions29. These associations may inform future hypothesis development and communication research, but the cross-sectional design does not establish that changing trust, conformity, or OWOM evaluations would cause changes in use intention.
Several limitations should be considered. Recruitment through social media, community groups, and personal networks produced a non-probability, self-selected convenience sample from only three Chinese cities. The sample was concentrated among respondents aged 20–39 years and those with a bachelor's degree or higher, which may limit generalizability to older, less-educated, rural, or otherwise different populations. Measurement invariance across Wuhan, Suzhou, and Shanghai was not tested, so pooled-city comparisons should be interpreted cautiously. All constructs were measured by self-report at one time point using the same 5-point response format. Although the Harman-style first-component diagnostic did not indicate a dominant single factor, this screening procedure cannot rule out common-method bias; no items were reverse-coded. The item-level |Z| > 3 screening rule is also debatable for bounded Likert data. Retaining the 20 screened cases produced the same coefficient directions and significance conclusions in the sensitivity analyses, which reduces concern that the principal regression and interaction findings were driven by that exclusion rule. The moderation models explained 25.42% and 22.37% of the variance in IU, respectively, leaving substantial variance unexplained. Finally, the cross-sectional design cannot establish temporal ordering or causal mediation, and unmeasured factors such as technology anxiety, moral responsibility, ethical cognition, prior incident exposure, or local policy context may also contribute to intention to use. In addition, the autonomous-taxi usage-frequency item did not include a 'never used' response option; consequently, prior actual use cannot be confirmed for every respondent from the archived dataset, and the reported frequency distribution should be interpreted cautiously. Future surveys should include an explicit prior-use item and a 'never used' response category.
Future studies should use probability-based or more demographically balanced sampling where feasible, test measurement invariance across locations and demographic groups, and replicate the model with longitudinal panels, field experiments, or repeated measurements collected before and after direct autonomous taxi experience. Experimental manipulation of transparency, safety information, or review credibility could provide stronger evidence about causal pathways, while longitudinal data could test whether trust and risk appraisal evolve with accumulated experience. The framework may also be examined in other socially visible, high-uncertainty AI services in which technical performance, personal risk judgment, and online information jointly shape behavioral intention.
披露
The authors declare no conflicts of interest.
致谢
This research was funded by the Jiangsu University Philosophy and Social Sciences Research Project (2025SJYB1508); the Jiangsu Provincial Social Sciences Applied Research Excellence Project (25SYC-165); the Institutional Research Project of Yancheng Polytechnic College (2024xb08); the Construction Project of the Philosophy and Social Sciences Innovation Team of Yancheng Polytechnic College (YGSK202502); and the Doctoral Fund Project of Yancheng Polytechnic College (6070014/007).
材料
| 姓名 | 公司 | 目录编号 | 评论 |
|---|---|---|---|
| Measure system transparency (ST), system safety (SS), service quality (SQ), perceived risk (PR), OWOM information evaluation (OWOM), trust (TR), conformity tendency (CT), and intention to use (IU) | ST: 3 items; SS: 4; SQ: 4; PR: 3; OWOM: 5; TR: 4; CT: 4; IU: 4; response range 1 (strongly disagree) to 5 (strongly agree); back-translation and expert review | Methods: Questionnaire development and measurement configuration | |
| Obtain voluntary informed consent before participants enter the substantive questionnaire | Participation was voluntary; participants could stop at any time; questionnaire administered anonymously. Study approved by the Ethics Committee of Yancheng Polytechnic College in September 2025 (Approval No. J202839). | Methods: Study setting, population, and ethical safeguards | |
| Restrict participation to respondents who had previously heard of or been exposed to autonomous taxi services | Only respondents selecting “Yes” proceeded to the substantive questionnaire | Methods: Study setting and target population; Online recruitment and survey administration | |
| Identify respondents who did not follow the questionnaire instruction | Instruction required selection of “strongly agree”; non-compliant responses were excluded; 18 responses were removed | Methods: Data-quality checks; Data cleaning and analytic-sample construction | |
| Identify unreasonable responses for data-quality screening | Statement: “Wearing a seat belt during travel helps improve passenger safety.” Responses of 1 (strongly disagree) or 2 (disagree) met the exclusion rule; 9 responses were removed | Methods: Data-quality checks; Data cleaning and analytic-sample construction | |
| Host and distribute the online questionnaire and collect survey responses from residents of Wuhan, Suzhou, and Shanghai | The same questionnaire content and response settings were used throughout data collection; responses were collected from September 1–20, 2025. Anonymous survey data are retained on the Zhihuixing platform for two years. | Methods: Online recruitment and survey administration; Data Availability | |
| Screen extreme item-level responses after attention- and seat-belt-check exclusions | Applied to all 31 substantive items; cases with any observed-item absolute Z-score > 3 were screened from the primary analytic sample; 20 cases met the criterion | Methods: Data cleaning and analytic-sample construction | |
| Support composite-score analysis and moderation analysis | Arithmetic mean construct scores; OLS regression; used with PROCESS macro for simple moderation and Johnson–Neyman probing | Methods: Moderation and Johnson–Neyman analysis | |
| Estimate confirmatory factor analysis and structural equation models | Maximum-likelihood estimation; measurement model and structural model; standardized factor loadings, path coefficients, and global model-fit indices | Methods: Measurement-model evaluation; Structural-model estimation and direct-path testing; Statistical mediation analysis | |
| Estimate simple moderation models and Johnson–Neyman regions of significance | Predictors and moderators mean-centered; interactions PR × TR and OWOM × CT; construct scores calculated as arithmetic means of their items; no additional covariates | Methods: Moderation and Johnson–Neyman analysis | |
| Evaluate internal consistency of each construct | Criterion used in the study: α ≥ 0.70 | Methods: Measurement-model evaluation; Results: Measurement-model evaluation | |
| Evaluate construct reliability | Criterion used in the study: CR ≥ 0.70 | Methods: Measurement-model evaluation; Results: Measurement-model evaluation | |
| Evaluate convergent validity | Criterion used in the study: AVE > 0.50 | Methods: Measurement-model evaluation; Results: Measurement-model evaluation | |
| Assess discriminant validity among the eight constructs | Square root of each construct’s AVE compared with correlations involving that construct | Methods: Measurement-model evaluation; Table 4 | |
| Complement the Fornell–Larcker assessment of discriminant validity | Item-level HTMT values in the revised analysis ranged from 0.344 to 0.581; all were below the prespecified 0.85 threshold | Methods: Measurement-model evaluation; Table 5 | |
| Screen for a dominant single common-method component | Variance explained by the first unrotated component evaluated against a conventional 50% screening threshold; interpreted as a preliminary diagnostic | Methods: Measurement-model evaluation; Discussion | |
| Estimate six indirect associations through PR and OWOM | Bias-corrected and percentile 95% confidence intervals; an indirect association was considered statistically supported when the 95% CI excluded zero | Methods: Statistical mediation analysis; Results: Statistical mediation analysis; Table 8 | |
| Identify moderator values at which the focal conditional association is statistically distinguishable from zero | Revised thresholds: mean-centered TR = 0.823 and mean-centered CT = −0.932; primary moderation sample N = 803 | Methods: Moderation and Johnson–Neyman analysis; Results: Moderation and Johnson–Neyman analysis; Figures 2–3 | |
| Assess fit of the CFA measurement model and structural model | Criteria used: χ2/df = 1–3; GFI/IFI/CFI/TLI > 0.90; RMSEA < 0.08 | Methods: Measurement-model evaluation; Structural-model estimation; Tables 3 and 6 |
参考文献
- Narayanan S, Chaniotakis E, Antoniou C. Shared autonomous vehicle services: A comprehensive review. Transp Res Part C Emerg Technol. 2020;111:255–293.
- Wishart D, Weaver S, Apuli A. Autonomous vehicles: What are your intentions? Transp Res Part F Traffic Psychol Behav. 2023;99:450–459.
- Li L et al. The impact of people's subjective perception on their acceptance of automated vehicles: A meta-analysis. Transp Res Part F Traffic Psychol Behav. 2024;102:449–467.
- Yuen KF, Huyen DT, Wang X, Qi G. Factors influencing the adoption of shared autonomous vehicles. Int J Environ Res Public Health. 2020;17(13):4868.
- Querci I, Barbarossa C, Romani S. Explaining how algorithms work reduces consumers' concerns regarding the collection of personal data and promotes AI technology adoption. Psychol Mark. 2022;39:1888–1901.
- Ma J et al. Interactive output modalities design for enhancement of user trust experience in highly autonomous driving. Int J Hum Comput Interact. 2025;41(10):6172–6190.
- Liu YX, Li HX, Pan YH. Why do users trust Robotaxi? Analyzing user differences and adoption behavior from a socio-technical perspective. J Retail Consum Serv. 2025;87:104393.
- DeLone WH, McLean ER. Information systems success: The quest for the dependent variable. Inf Syst Res. 1992;3(1):60–95.
- Parasuraman A, Zeithaml VA, Berry LL. SERVQUAL: A multiple-item scale for measuring consumer perceptions of service quality. J Retail. 1988;64(1):12–40.
- Kenesei Z et al. Trust and perceived risk: How different manifestations affect the adoption of autonomous vehicles. Transp Res Part A Policy Pract. 2022;164:379–393.
- Cheung CMK, Thadani DR. The impact of electronic word-of-mouth communication: A literature analysis and integrative model. Decis Support Syst. 2012;54:461–470.
- Park DH, Lee J, Han I. The effect of on-line consumer reviews on consumer purchasing intention: The moderating role of involvement. Int J Electron Commer. 2007;11:125–148.
- Zhang T et al. The roles of initial trust and perceived risk in public's acceptance of automated vehicles. Transp Res Part C Emerg Technol. 2019;98:207–220.
- Bearden WO, Netemeyer RG, Teel JE. Measurement of consumer susceptibility to interpersonal influence. J Consum Res. 1989;15(4):473–481.
- Capuano C, Chekroun P. A systematic review of research on conformity. Int Rev Soc Psychol. 2024;37:13.
- Calderon EDV, James TL, Lowry PB. How Facebook's newsfeed algorithm shapes childhood vaccine hesitancy: An algorithmic fairness, accountability, and transparency (FAT) perspective. Data Inf Manag. 2023;7(3):100042.
- Chopdar PK, Korfiatis N, Sivakumar VJ, Lytras MD. Mobile shopping apps adoption and perceived risks: A cross-country perspective utilizing the Unified Theory of Acceptance and Use of Technology. Comput Human Behav. 2018;86:109–128.
- You Y, Vadakkepatt GG, Joshi AM. A meta-analysis of electronic word-of-mouth elasticity. J Mark. 2015;79(2):19–39.
- Nordhoff S et al. User acceptance of automated shuttles in Berlin-Schöneberg: A questionnaire study. Transp Res Part F Traffic Psychol Behav. 2018;58:843–854.
- Chen Y, Wang Q, Xie J. Online social interactions: A natural experiment on word of mouth versus observational learning. J Mark Res. 2011;48:238–254.
- Xu Z et al. What drives people to accept automated vehicles? Findings from a field experiment. Transp Res Part C Emerg Technol. 2018;95:320–334.
- Fornell C, Larcker DF. Evaluating structural equation models with unobservable variables and measurement error. J Mark Res. 1981;18(1):39–50.
- Henseler J, Ringle CM, Sarstedt M. A new criterion for assessing discriminant validity in variance-based structural equation modeling. J Acad Mark Sci. 2015;43(1):115–135.
- Yang C, Gu C, Wei W. Does Robotaxi offer a positive travel experience? A study of the key factors that influence consumers' use of the Robotaxi. Systems. 2023;11(12):559.
- Du K, Ryu MH. Use of Robotaxi services for sustainable transportation: Focusing on their perceived benefits and sacrifices as well as consumers' technology readiness. Sustainability. 2025;17(17):8020.
- Wang Y, Wu J, Gu J, Wang F. An elaboration likelihood model of perceived safety risk in ride-sharing continuance: Platform quality cues as antecedents and gender as moderator. Transp Res Part F Traffic Psychol Behav. 2025;109:367–382.
- Alam SS et al. Experience, trust, OWOM engagement and usage intention of AI enabled services in hospitality and tourism industry: Moderating mediating analysis. J Qual Assur Hosp Tour. 2024;25:1635–1663.
- Khan WA, Abideen ZU. Effects of behavioural intention on usage behaviour of digital wallet: The mediating role of perceived risk and moderating role of perceived service quality and perceived trust. Future Bus J. 2023;9:73.
- Laursen B, Faur S. What does it mean to be susceptible to influence? A brief primer on peer conformity and developmental changes that affect it. Int J Behav Dev. 2022;46(3):222–237.