This study aimed to identify genetically prioritized candidate genes influencing estimated glomerular filtration rate (eGFR) leveraging large-scale genomic datasets from tens of thousands of participants.
研究文章
Genetic Determinants of Estimated Glomerular Filtration Rate: Insights from Large-Scale Genomic Data
本文内容
摘要
摘要
Understanding the genetic factors influencing estimated glomerular filtration rate (eGFR) is crucial for developing effective prevention and treatment strategies. This study aimed to identify genetically prioritized candidate factors influencing eGFR leveraging large-scale genomic datasets. Genome-wide association study (GWAS) data from the eQTLGen Consortium (30,000+ individuals) and the CKDGen/UK Biobank (over 1.2 million individuals) were analyzed. A total of 16,987 cis-expression quantitative trait loci (cis-eQTL) genes, obtained from the eQTLGen Consortium, were utilized as the exposure traits in this study. The creatinine-based eGFR served as the outcome phenotype in this study. The enrichment analysis, two-sample Mendelian randomization (MR), and reverse MR were conducted to explore functional pathways. We identified 1,818 genes causally associated with eGFR, including 953 positively and 865 negatively correlated genes. The enrichment analysis underscored the role of adherens junction pathways and glucose metabolic processes in regulating eGFR. Further, two-sample MR and reverse MR validated 210 significant genes associated with eGFR. This study provided new insights into the genetic basis of eGFR, identifying a series of potential biomarkers. The findings suggested the roles of adherens junctions and glucose metabolism in kidney function. Further research is needed to validate these findings and explore their clinical implications.
引言
The estimated glomerular filtration rate (eGFR) serves as a critical diagnostic marker for chronic kidney disease (CKD). A diagnosis of CKD is confirmed when a patient's eGFR persistently remains below 60 mL/min/1.73 m2 for three months or longer1. CKD is a progressive condition marked by structural and functional impairment of the kidneys, impacting roughly 10% of the global population. Individuals with CKD are at significant risk of numerous severe complications, such as cardiovascular events, the necessity for kidney replacement therapy, and increased mortality2,3. Therefore, it is of great importance to explore the impacting factors of eGFR to better understand the underlying mechanisms of CKD, develop effective prevention and treatment approaches, and ultimately reduce both the prevalence and incidence of the disease4.
Mendelian randomization (MR) leverages genetic variants as instrumental variables to emulate the randomization process that establishes the causal relationships between exposure and outcome, thereby overcoming the issues of confounding that are inherent in observational studies5,6,7,8,9. Currently, studies investigating the factors influencing eGFR remain limited, and MR offers a powerful approach to address this gap. This study aimed to utilize the summary-based MR (SMR10), two-sample MR (TSMR), and reverse MR analysis to investigate the genetic underpinnings of eGFR based on the genome-wide association study (GWAS) data of tens of thousands of participants.
方案
This study leveraged the GWAS data sourced from the eQTLGen Consortium (https://www.eqtlgen.org/) and the GWAS catalog database (https://www.ebi.ac.uk/gwas/). The SMR, TSMR, and reverse MR analyses were employed to explore the causal relationship between cis-expression quantitative trait loci (cis-eQTL) genes and eGFR. The study flowchart is detailed in Figure 1.
Exposure phenotype
A total of 16,987 cis-eQTL genes, obtained from the eQTLGen Consortium, were utilized as exposure traits in this study. The eQTLGen Consortium is a large collaborative organization dedicated to systematically characterizing how genetic variants shape gene expression. The consortium has corrected and replicated the blood-derived eQTLs in other cohorts. Every cis-eQTL has been tested in at least 2 cohorts to be reported. Through the collection and analysis of comprehensive genetic and transcriptomic data from over 30,000 individuals, the consortium aims to identify genetic variants that regulate gene expression and to elucidate their roles in the genetic architecture of complex diseases11. Additional information is provided in Supplementary Table 1.
Outcome phenotype
The creatinine-based eGFR served as the outcome phenotype in this study (Supplementary Table 1). The largest GWAS dataset identified in the literature search was used12,13. The study conducted a GWAS meta-analysis for creatinine-based eGFR using data from the Chronic Kidney Disease Genetics Consortium (CKDGen) and the UK Biobank, totaling 1,201,909 individuals (Supplementary Table 1). In the UK Biobank, the eGFR was calculated using the Chronic Kidney Disease Epidemiology Collaboration (CKD-EPI) equation14,15. Within the CKDGen consortium analysis, eGFR was determined using age-specific formulas: the CKD-EPI equation was applied for participants aged > 18 years14,15, while the Schwartz formula was used for individuals aged ≤ 18 years16. The eGFR values were winsorized at 15–200 mL/min/1.73 m2. Following winsorization, the eGFR values were natural log-transformed. No sample overlap was observed between the eQTLGen and outcome datasets.
Summary-based Mendelian randomization (SMR) analysis
To elucidate the potential causal impact of the 16,987 cis-eQTL genes on eGFR, this study employed the SMR analysis10. The specific parameters used in the SMR software were: smr --bfile mydata --gwas-summary mygwas.ma --beqtl-summary myeqtl --out mysmr --thread-num10. Further details could be accessed at https://yanglab.westlake.edu.cn/software/smr/#Overview. The cis-eQTL instruments were defined as the distance from the gene with a window size of 1 Mb. Specifically, genes that exhibited a p-value below 0.05 in the SMR test, while simultaneously presenting a p-value above 0.05 in the heterogeneity in dependent instruments (HEIDI) test, were identified as having a significant causal association with the eGFR phenotype. A volcano plot was applied to visualize the significant cis-eQTL genes.
Two-sample MR (TSMR) and reverse MR analysis
For the cis-eQTL genes that exhibited significant associations in the SMR analysis, the TSMR analysis was subsequently conducted to further corroborate and validate their potential causal relationships. Single-nucleotide polymorphisms (SNPs) were subjected to clumping procedures with stringent parameters: a genome-wide significance threshold of p = 5e-08, a physical distance threshold of 10,000 kb, and a linkage disequilibrium (LD) threshold of r2 = 0.001. In the default allele harmonization step, alleles were aligned to the positive strand, and allele frequencies were used for palindromic variants. A minimum of two instruments were included. Instrument strength was assessed using F-statistics, and a threshold of F > 10 was applied to define adequately strong instruments. When a variant was unavailable in the outcome dataset, proxy SNPs were considered, with a minimum LD r2 threshold of 0.8. Similarly, the reverse MR analysis was performed to examine whether eGFR influenced gene expression. The primary causal effect estimates were derived using the inverse variance weighted (IVW) method with multiplicative random effects. Statistical significance of causal associations was determined based on a Bonferroni-corrected p-value threshold (0.05/1818 for the TSMR analysis and 0.05/213 for the reverse MR analysis) to account for multiple testing.
Sensitivity analysis
To ensure the robustness of the TSMR results, a comprehensive sensitivity analysis was performed. Causal effect estimates were calculated using four complementary methods: inverse variance weighted (IVW), MR-Egger, MR-Egger regression with bootstrap resampling, and weighted median estimation. To assess potential biases, heterogeneity and pleiotropy tests were systematically evaluated. Cochran’s Q test was employed to quantify heterogeneity among instrumental variables. In cases where significant heterogeneity was detected (p < 0.05), the IVW method with multiplicative random effects was prioritized to account for between-SNP variability. Horizontal pleiotropy was examined using MR-Egger intercept analysis, with a statistically significant intercept (p < 0.05) indicating potential bias due to unbalanced pleiotropic effects. If significant pleiotropy was observed, the MR-Egger (bootstrap) method was recommended due to its reduced sensitivity to outlier variants and enhanced robustness in the presence of directional pleiotropy.
Enrichment analysis
Those significant cis-eQTL genes were further analyzed in the enrichment analysis. Gene function annotation was conducted for those cis-eQTL genes through the gene ontology (GO) and Kyoto encyclopedia of genes and genomes (KEGG) biological functions. The GO enrichment analysis was employed to elucidate the biological significance of the candidate genes, covering three main aspects: biological process, cellular component, and molecular function.
Statistical analysis
The R version 4.4.0, the SMR software v1.3.1, and the Hiplot Pro platform (https://hiplot.com.cn/) were utilized as the main tools in this study. The main R package was TwoSampleMR v0.7.517. Statistical tests were conducted in a two-tailed manner.
结果
Significant cis-eQTL genes associated with eGFR using SMR analysis
SMR analysis was performed to investigate the causal roles of 16,987 cis-eQTL genes in impacting eGFR. After the SMR and HEIDI tests, 1,818 genes were identified as genetically prioritized candidate genes of eGFR (Figure 1). More comprehensive results can be reviewed in Supplementary Table 2.
The volcano plot of significant cis-eQTL genes associated with eGFR was depicted (Figure 2). Several genes exhibited extremely low p-values or high beta-effect sizes, including MED1 (beta_SMR: 0.034, p_SMR: 2.52e-39), SIN3A (beta_SMR: 0.052, p_SMR: 2.74e-06), IMP3 (beta_SMR: 0.021, p_SMR: 2.95e-19), COL7A1 (beta_SMR: 0.039, p_SMR: 9.41e-08), PSRC1 (beta_SMR: -0.0067, p_SMR: 5.00e-27), FBXO22 (beta_SMR: -0.032, p_SMR: 1.06e-14), DUSP11 (beta_SMR: -0.069, p_SMR: 2.20e-10), and FXN (beta_SMR: -0.047, p_SMR: 1.01e-05). In total, there were 953 genes positively associated with eGFR and 865 genes negatively associated with eGFR.
Potential of adherens junction and glucose metabolic process in regulating eGFR
We further conducted the enrichment analysis to annotate the function of those significant cis-eQTL genes (Figure 3). We identified the terms related to adherens junction were positively associated with eGFR (Figure 3A), including the adherens junction organization (p_value: 0.001, 8 genes included: CDHR3/PLEKHA7/DLG5/DCHS1/VEGFA/PLEC/PAK2/CDH1), cell-cell junction organization (p_value: 0.012, 16 genes included: CDHR3/PLEKHA7/ESAM/PDCD6IP/ROCK2/TJP2/DLG5/DCHS1/GNPAT/WNT11/VEGFA/PLEC/PAK2/CLDN4/CDH1/CAV1), and negative regulation of cell adhesion (p_value: 0.033, 20 genes included: AKNA/EPB41L5/METTL3/IL20RB/PLXNB2/PLXND1/SWAP70/GPNMB/LPXN/DLG5/SEMA5A/VEGFA/TNFSF4/PTPN11/SERPINE2/JAK2/GCNT2/CDH1/BMP4/ACVRL1). On the other hand, we noticed the terms related to glucose metabolic process were negatively associated with eGFR (Figure 3B), including the cellular response to glucose starvation (p_value: 0.0001, 9 genes included: NIM1K/SESN2/SIRT1/SIK2/NUAK1/UPP1/SLC2A1/PRKAA1/IFI16), regulation of glucose metabolic process (p_value: 0.0009, 13 genes included: SLC45A3/SESN2/NLN/ZNF692/SIRT1/ZMPSTE24/RORA/PTPN2/PPP1R3D/PPP1CB/PHKG2/PFKFB2/LEPR), glucose metabolic process (p_value: 0.002, 17 genes included: SLC45A3/SESN2/NLN/ZNF692/SIRT1/ZMPSTE24/SLC25A13/TPI1/RORA/PTPN2/PRKAA1/PPP1R3D/PPP1CB/PHKG2/PFKFB2/LEPR/DLAT), gluconeogenesis (p_value: 0.011, 8 genes included: SESN2/NLN/ZNF692/SIRT1/SLC25A13/TPI1/PTPN2/LEPR), regulation of gluconeogenesis (p_value: 0.013, 6 genes included: SESN2/NLN/ZNF692/SIRT1/PTPN2/LEPR), glucose homeostasis (p_value: 0.014, 17 genes included: SESN2/RMI1/NUCKS1/LRRC8D/SIRT6/CYB5R4/SIRT1/PARK7/SOX4/PTPN2/PRKCE/PRKAA1/NPTX1/NMB/LEPR/ENDOG/CRY2), glucagon signaling pathway (p_value: 0.013, 10 genes included: CREB3L2/SIRT1/SIK2/SLC2A1/PYGB/PRKAA1/PHKG2/LDHB/ITPR2/CAMK2G), insulin resistance (p_value: 0.014, 10 genes included: CREB3L2/TRIB3/SREBF1/SLC2A1/PYGB/PRKCE/PRKAA1/PPP1R3D/PPP1CC/PPP1CB), and insulin signaling pathway (p_value: 0.027, 11 genes included: RPTOR/SHC2/TRIP10/SREBF1/PYGB/PRKAA1/PPP1R3D/PPP1CC/PPP1CB/PHKG2/FASN).
After FDR correction, no GO/KEGG term remained significant at p.adjust < 0.05 (Supplementary File 1). These findings were considered exploratory and hypothesis-generating.
TSMR and reverse MR validation
For the cis-eQTL genes that exhibited significant associations in the SMR analysis, subsequent TSMR and reverse MR validations were conducted to further corroborate and validate their potential causal relationships. The results of TSMR validation and sensitivity analysis were detailed in Supplementary File 2, which identified 213 significant cis-eQTL genes associated with eGFR. Further reverse MR validation was applied, and the results were shown in Supplementary File 3. Three genes were excluded after the reverse MR validation because eGFR itself could influence the expression of those genes. They were HSD17B7, EIF3C, and EIF3CL. Eventually, we identified 210 significant cis-eQTL genes associated with eGFR (Supplementary Table 3).
Data Availability
Summary statistics of estimated glomerular filtration rate were downloaded from the NHGRI-EBI GWAS Catalog (https://www.ebi.ac.uk/gwas/home) with the accession number GCST90103634. The SMR-formatted cis-eQTLs GWAS data were downloaded from https://eqtlgen.org/phase1.html with the accession link https://download.gcc.rug.nl/downloads/eqtlgen/cis-eqtl/SMR_formatted/cis-eQTL-SMR_20191212.tar.gz. The TSMR-formatted cis-eQTLs GWAS data were downloaded from https://opengwas.io/datasets/ with the accession number eqtl-a-ENSG.
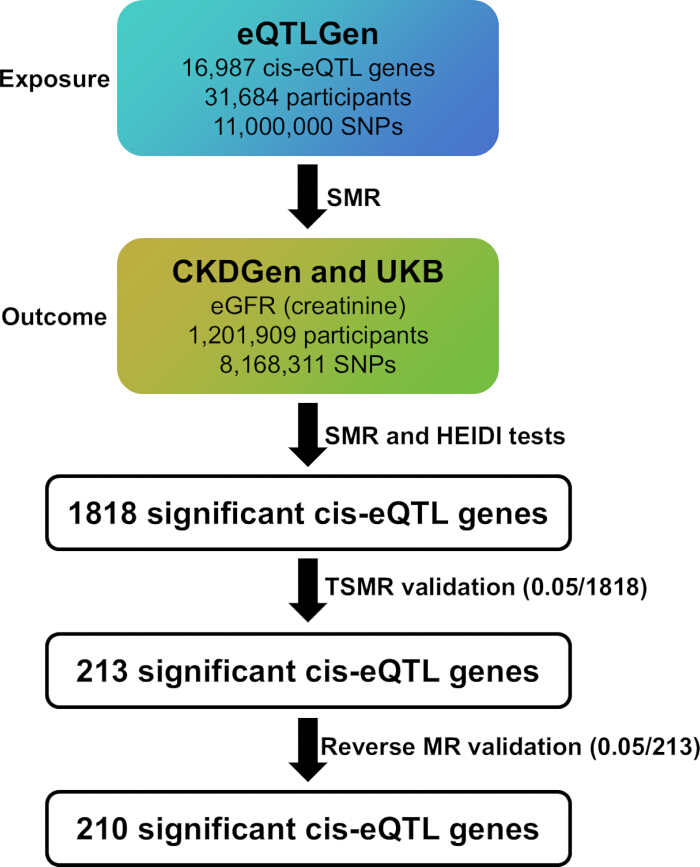
Figure 1: The study flowchart. cis-eQTL: cis-expression quantitative trait locus; SNP: single-nucleotide polymorphism; eGFR: estimated glomerular filtration rate; SMR: summary-based Mendelian randomization; HEIDI: heterogeneity in dependent instruments; eQTLGen: expression quantitative trait loci genetics consortium; CKDGen: Chronic Kidney Disease Genetics Consortium; UKB: UK Biobank; TSMR: two-sample Mendelian randomization. Please click here to view a larger version of this figure.
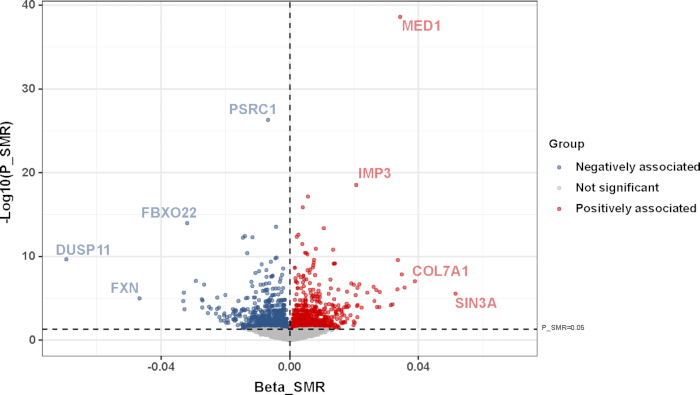
Figure 2: The volcano plot of significant cis-eQTL genes associated with eGFR from the SMR results. The red color indicates genes positively associated with eGFR. The blue color indicates genes negatively associated with eGFR. The grey color indicated genes that were not significantly associated with eGFR. The dashed threshold lines indicated P_SMR = 0.05 and Beta_SMR = 0 respectively. cis-eQTL: cis-expression quantitative trait locus; eGFR: estimated glomerular filtration rate; SMR: summary-based Mendelian randomization. Please click here to view a larger version of this figure.

Figure 3: The enrichment analysis of cis-eQTL genes associated with eGFR from the SMR results. (A) Positive and (B) negative cis-eQTL genes. The bubble size indicated the gene count. The color scale indicated -log10(P Value). cis-eQTL: cis-expression quantitative trait locus; eGFR: estimated glomerular filtration rate. Please click here to view a larger version of this figure.
Supplementary Table 1: Details of the GWAS data incorporated into the analysis. Please click here to download this file.
Supplementary Table 2: Comprehensive summary statistics derived from the SMR analysis. Please click here to download this file.
Supplementary Table 3: The TSMR and reverse MR validation yielded 210 significant cis-eQTL genes associated with eGFR. Please click here to download this file.
Supplementary File 1: The enrichment analysis of positive and negative cis-eQTL genes associated with eGFR from the SMR results. Please click here to download this file.
Supplementary File 2: The TSMR, heterogeneity, and pleiotropy effects of cis-eQTL genes on eGFR. Please click here to download this file.
Supplementary File 3: The reverse MR, heterogeneity, and pleiotropy effects of eGFR on cis-eQTL genes. Please click here to download this file.
讨论
This study employed the SMR analysis to explore the genetic basis of eGFR, leveraging 16,987 cis-eQTL GWAS data from over 30,000 participants and the largest GWAS data with over 1.2 million participants. We discovered 1,818 significant cis-eQTL genes associated with eGFR, most of which were novel biomarkers and had never been linked with eGFR. The enrichment analysis highlighted the potential of adherens junctions and glucose metabolic processes in modulating eGFR. These findings collectively contributed to a better understanding of kidney function and further validation is still needed.
The volcano plot showed several genetically prioritized candidate genes associated with eGFR in Figure 2 (MED1, SIN3A, COL7A1, and IMP3 positively associated with eGFR; PSRC1, FBXO22, DUSP11, and FXN negatively associated with eGFR). Limited evidence has illustrated their relationship with kidney disease. The MED1 gene encodes a subunit of the Mediator complex and plays a crucial role in regulating various metabolic processes in the kidney and liver. In renal clear cell carcinoma, MED1 and other MED genes were associated with tumor progression and patient prognosis18,19. In the liver, MED1 regulated autophagy, mitochondrial function, and lipid metabolism, with its knockdown impairing these processes20. The relationship between MED1 and kidney function remains unexplored. As for the SIN3A gene, it plays diverse roles in kidney development. It exhibited sexually dimorphic expression in mouse kidneys, with higher levels in males, influenced by gonadal secretions in adulthood21. SIN3A functions as a scaffold protein, interacting with transcriptional epigenetic partners and DNA-binding transcription factors to modulate gene expression. Its role has been extensively studied, and recent research suggests its potential implications in pulmonary arterial hypertension22. Nevertheless, the association between SIN3A and kidney function has yet to be investigated. Recent studies have also highlighted the complex relationship between collagen and kidney disease. COL7A1 expression has been identified as a prognostic marker for clear cell renal cell carcinoma, with higher expression associated with poorer survival outcomes23. Other types of collagen, including COL1A124, COL1A225, COL3A125, and COL4A126,27, were also reported to be associated with CKD. However, the association of COL7A1 with kidney function has not been explored. IMP3 has emerged as a significant prognostic marker in renal cell carcinoma. Studies have shown that elevated IMP3 levels in both tissue and plasma were associated with poor survival outcomes in renal cell carcinoma patients28,29. IMP3 expression correlated with higher tumor grade, advanced stage, and increased risk of metastasis29,30. The association between IMP3 and kidney function has yet to be elucidated.
For those genes negatively associated with eGFR (PSRC1, FBXO22, DUSP11, and FXN), few studies have elucidated the relationship between these factors and kidney disease. PSRC1 plays a crucial role in atherosclerosis. Overexpression of PSRC1 attenuated atherosclerosis progression by modulating cholesterol transport and inflammation in apoE-/- mice31. Conversely, PSRC1 deficiency accelerated atherosclerosis by increasing TMAO production through gut microbiota manipulation and upregulation of flavin monooxygenase 332. So far, there have been no studies investigating the role of PSRC1 in kidney disease. FBXO22, an F-box protein involved in ubiquitination, plays diverse roles in cancer progression. In renal cell carcinoma, FBXO22 acted as a tumor suppressor by inhibiting metastasis through suppression of MMP-9-mediated migration and VEGF-mediated angiogenesis33. Conversely, in hepatocellular carcinoma, FBXO22 promoted tumor progression by mediating the degradation of tumor suppressors KLF4 and p2134,35. The role of FBXO22 in kidney function remained unexplored. DUSP11, a dual-specificity phosphatase, plays a crucial role in immune responses. In macrophages, DUSP11 inhibited LPS-induced activation by dephosphorylating TAK1, reducing cytokine production and susceptibility to endotoxic shock36. DUSP11 was essential for innate immunity, regulating cytokine production in antigen-presenting cells and T-cell responses37. Other dual-specificity phosphatases (DUSPs, including DUSP1, DUSP2, and others) have also been implicated in various kidney diseases, like acute kidney injury, hypertensive nephropathy, lupus nephritis, diabetic nephropathy, and CKD38. Nevertheless, the impact of DUSP11 on kidney disease remained unknown. FXN is a mitochondrial protein crucial for iron-sulfur cluster biosynthesis. The gene played a vital role in regulating oxidative stress and insulin release, and resistance in pancreatic islets39,40. No research on the relationship between FXN and kidney disease was reported.
The eQTLGen Consortium did not include eGFR-related genes that have established clinical or functional relevance (for example, UMOD and SHROOM3) for context. The situation might be due to the use of blood eQTLs data rather than kidney-specific eQTLs. Future GWAS data reporting more cis-eQTL genes would be needed.
The enrichment analysis suggested the potential of adherens junctions and glucose metabolic processes in modulating eGFR. These findings were considered hypothesis-generating. The adherens junction played a protective role in maintaining kidney function. The relationship between adherens junctions and kidney function is crucial for maintaining renal epithelial cell polarity and proper kidney function. Adherens junctions, along with tight junctions, were essential components of the apicobasal polarity complex in kidney epithelial cells41. The glomerular slit diaphragm, a modified adherens junction, was composed of P-cadherin, catenins, and ZO-1, and played a vital role in glomerular filtration42. Disruption of adherens junctions, as seen in polycystic kidney disease, led to abnormal tubulogenesis and cyst formation through Wnt, protein kinase C, cAMP, JAK-STAT, and G protein–coupled signaling pathways, as well as possible Ca2+ signaling regulation43. In primary cells from patients diagnosed with autosomal dominant polycystic kidney disease, the polycystin-1/E-cadherin complex was disrupted, resulting in altered cell adhesion and polarity44. Furthermore, epithelial-mesenchymal transformation, characterized by loss of cell-cell contact and apicobasal polarity, contributed to renal fibrosis and kidney dysfunction through the β-catenin and TGF-β signaling pathways43. Understanding these relationships is crucial for developing targeted therapies for kidney function and kidney diseases.
The findings suggested that the glucose metabolic process might influence the maintenance of kidney function. Glucose homeostasis plays a crucial role in the development, progression, and prognosis of kidney diseases through the insulin signaling pathway45,46. Recent research has focused on the role of glycogen accumulation in diabetic kidney disease and the effects of SGLT2 inhibitors on renal and cardiovascular outcomes6,47. During acute and chronic kidney injuries, proximal tubular cells underwent a metabolic shift from fatty acid oxidation and gluconeogenesis to glycolysis through the activation of IL-β and c-myc pathways and the regulation of extracellular signal-regulated kinase (ERK) signaling48,49. Understanding these glucose metabolism shifts might lead to new therapeutic strategies for kidney diseases.
The study offered a comprehensive elucidation of the genetic basis underlying eGFR. We provided a series of novel biomarkers regulating eGFR and suggested the potential of adherens junctions and glucose metabolic processes in modulating eGFR. However, several limitations should be acknowledged. The source of GWAS data was from European individuals, thereby limiting the applicability of our results to other ethnic populations. Also, the enrichment analysis might be underpowered. These results would guide future investigations into the relationship between those biomarkers and kidney function. We would also look forward to future GWAS data reporting the measured glomerular filtration rate (mGFR) results or a subgrouped eGFR phenotype (for example, eGFR phenotype in participants without diabetes, hypertension, glomerulonephritis, or other comorbidities). Future GWAS data should also focus on the kidney cortex, tubule, glomerular, and single-cell kidney eQTL data. Experimental validation in animal models and other database analyses would further strengthen these findings.
In conclusion, this study investigated the genetic architecture of eGFR and identified a series of novel biomarkers involved in regulating eGFR. Additional research is required to validate these findings.
披露
All authors have no conflicts of interest or financial ties to disclose.
致谢
Summary statistics of estimated glomerular filtration rate were downloaded from the NHGRI-EBI GWAS Catalog (Cerezo et al., 2025, https://www.ebi.ac.uk/gwas/home) for study GCST90103634 (Stanzick et al., 2021, https://www.ebi.ac.uk/gwas/studies/GCST90103634). Additionally, we want to acknowledge the participants and investigators of the eQTLGen consortium. We thank Shanghai Tengyun Biotechnology Co., Ltd. for developing the Hiplot Pro platform (https://hiplot.com.cn/) and providing technical assistance and valuable tools for data analysis and visualization.
材料
| 姓名 | 公司 | 目录编号 | 评论 |
|---|---|---|---|
| cis-eQTLs GWAS | eQTLGen | 10.1038/s41588-021-00913-z | A total of 16,987 cis-eQTL genes, obtained from the eQTLGen Consortium, were utilized as exposure traits in this study. |
| eGFR GWAS | CKDGen and UKB | 10.1038/s41467-021-24491-0 | The creatinine-based eGFR served as the outcome phenotype in this study. |
| R software | RStudio | NA | v4.4.0 |
| SMR software | Yang Lab | https://yanglab.westlake.edu.cn/software/smr/#Overview | The SMR software tool was originally developed to implement the SMR & HEIDI methods to test for pleiotropic association between the expression level of a gene and a complex trait of interest using summary-level data from GWAS and expression quantitative trait loci (eQTL) studies. |
| TwoSampleMR | MRC Integrative Epidemiology Unit | NA | v0.7.5 |
| Hiplot Pro | Shanghai Tengyun Biotechnology Co., Ltd. | https://hiplot.com.cn/ | A platform providing technical assistance and valuable tools for data analysis and visualization. |
参考文献
- Chen TK, Hoenig MP, Nitsch D, Grams ME. Advances in the management of chronic kidney disease. BMJ. 2023;383:e074216.
- GBD Chronic Kidney Disease Collaboration. Global, regional, and national burden of chronic kidney disease, 1990-2017: a systematic analysis for the Global Burden of Disease Study 2017. Lancet. 2020;395(10225):709-33.
- Lyu Y et al. Estimated glomerular filtration rate decline is causally associated with acute pulmonary embolism: a nested case-control and Mendelian randomization study. Thromb Haemost. 2025;125(7):686-96.
- Bai Y et al. Adiponectin affects estimated glomerular filtration rate: a two-sample bidirectional Mendelian randomization study. Nephrology (Carlton). 2021;26(3):227-33.
- Lin L et al. Multi-omics analysis unveiled fibroblast-mediated pathogenesis in male genital lichen sclerosus. Cell Biosci. 2025;15(1):113.
- Lin L et al. SGLT2 inhibition and three urological cancers: up-to-date results. Diabetes Metab Res Rev. 2024;40(3):e3797.
- Lin L et al. Uncovering somatic genetic drivers in prostate cancer through comprehensive genome-wide analysis. Geroscience. 2025;47(3):5039-56.
- Lin L et al. Investigating the causal associations between metabolic biomarkers and the risk of kidney cancer. Commun Biol. 2024;7(1):398.
- Lin L et al. Genetic susceptibility of urolithiasis: comprehensive results from genome-wide analysis. World J Urol. 2024;42(1):230.
- Zhu Z et al. Integration of summary data from GWAS and eQTL studies predicts complex trait gene targets. Nat Genet. 2016;48(5):481-7.
- Võsa U et al. Large-scale cis- and trans-eQTL analyses identify thousands of genetic loci and polygenic scores that regulate blood gene expression. Nat Genet. 2021;53(9):1300-10.
- Stanzick KJ et al. Discovery and prioritization of variants and genes for kidney function in >1.2 million individuals. Nat Commun. 2021;12(1):4350.
- Cerezo M et al. The NHGRI-EBI GWAS Catalog: standards for reusability, sustainability and diversity. Nucleic Acids Res. 2025;53(D1):D998-D1005.
- Pattaro C et al. Estimating the glomerular filtration rate in the general population using different equations: effects on classification and association. Nephron Clin Pract. 2013;123(1-2):102-11.
- Inker LA et al. Estimating glomerular filtration rate from serum creatinine and cystatin C. N Engl J Med. 2012;367(1):20-9.
- Schwartz GJ et al. Improved equations estimating GFR in children with chronic kidney disease using an immunonephelometric determination of cystatin C. Kidney Int. 2012;82(4):445-53.
- Hemani G et al. The MR-Base platform supports systematic causal inference across the human phenome. eLife. 2018;7:e34408.
- Wang M, Min M, Mai J, Liu X. Systematic analysis of the expression profiles and prognostic significance of the MED gene family in renal clear cell carcinoma. Oncol Lett. 2024;28(2):398.
- Weiten R et al. The Mediator complex subunit MED15, a promoter of tumour progression and metastatic spread in renal cell carcinoma. Cancer Biomark. 2018;21(4):839-47.
- Zhou J et al. MED1 mediator subunit is a key regulator of hepatic autophagy and lipid metabolism. Autophagy. 2021;17(12):4043-61.
- Xu J, Arnold AP. Sexually dimorphic expression of co-repressor Sin3A in mouse kidneys. Endocr Res. 2005;31(2):111-9.
- Jankowski K, Jagana V, Bisserier M, Hadri L. Switch-independent 3A: an epigenetic regulator in cancer with new implications for pulmonary arterial hypertension. Biomedicines. 2023;12(1):10.
- Koca D et al. COL7A1 expression improves prognosis prediction for patients with clear cell renal cell carcinoma atop of stage. Cancers (Basel). 2023;15(10):2701.
- Mavrogeorgis E et al. Collagen-derived peptides in CKD: a link to fibrosis. Toxins (Basel). 2021;14(1):10.
- Oelusarz A et al. Overexpression of MMP-7 increases collagen 1A2 in the aging kidney. Physiol Rep. 2013;1(5):e00090.
- Jones FE et al. ER stress and basement membrane defects combine to cause glomerular and tubular renal disease resulting from Col4a1 mutations in mice. Dis Model Mech. 2016;9(2):165-76.
- Gulati A et al. Collagen IV gene mutations in adults with bilateral renal cysts and CKD. Kidney Int Rep. 2019;5(1):103-8.
- Tschirdewahn S et al. Circulating and tissue IMP3 levels are correlated with poor survival in renal cell carcinoma. Int J Cancer. 2019;145(2):531-9.
- Park JY, Choe M, Kang Y, Lee SS. IMP3, a promising prognostic marker in clear cell renal cell carcinoma. Korean J Pathol. 2014;48(2):108-16.
- Pei X et al. Enhanced IMP3 expression activates NF-κB pathway and promotes renal cell carcinoma progression. PLoS One. 2015;10(4):e0124338.
- Guo K et al. PSRC1 overexpression attenuates atherosclerosis progression in apoE-/- mice by modulating cholesterol transportation and inflammation. J Mol Cell Cardiol. 2018;116:69-80.
- Luo T et al. Deficiency of PSRC1 accelerates atherosclerosis by increasing TMAO production via manipulating gut microbiota and flavin monooxygenase 3. Gut Microbes. 2022;14(1):2077602.
- Guo F et al. FBXO22 suppresses metastasis in human renal cell carcinoma via inhibiting MMP-9-mediated migration and invasion and VEGF-mediated angiogenesis. Int J Biol Sci. 2019;15(3):647-56.
- Tian X et al. F-box protein FBXO22 mediates polyubiquitination and degradation of KLF4 to promote hepatocellular carcinoma progression. Oncotarget. 2015;6(26):22767-75.
- Zhang L et al. FBXO22 promotes the development of hepatocellular carcinoma by regulating the ubiquitination and degradation of p21. J Exp Clin Cancer Res. 2019;38(1):101.
- Yang CY et al. DUSP11 attenuates lipopolysaccharide-induced macrophage activation by targeting TAK1. J Immunol. 2020;205(6):1644-52.
- Nallaparaju K et al. DUSP11 is required for innate immunity (167.4). J Immunol. 2012;188(1 Suppl):167.4.
- Li H et al. Dual-specificity phosphatases and kidney diseases. Kidney Dis (Basel). 2021;8(1):13-25.
- Del Guerra S et al. Evidence for a role of frataxin in pancreatic islets isolated from multi-organ donors with and without type 2 diabetes mellitus. Horm Metab Res. 2012;44(6):471-5.
- Wu L et al. Interplay of FXN expression and lipolysis in white adipocytes plays a critical role in insulin sensitivity in Friedreich's ataxia mouse model. Sci Rep. 2024;14(1):19876.
- Schlüter MA, Margolis B. Apicobasal polarity in the kidney. Exp Cell Res. 2012;318(9):1033-9.
- Reiser J, Kriz W, Kretzler M, Mundel P. The glomerular slit diaphragm is a modified adherens junction. J Am Soc Nephrol. 2000;11(1):1-8.
- Lee DB, Huang E, Ward HJ. Tight junction biology and kidney dysfunction. Am J Physiol Renal Physiol. 2006;290(1):F20-34.
- Roitbak T et al. A polycystin-1 multiprotein complex is disrupted in polycystic kidney disease cells. Mol Biol Cell. 2004;15(3):1334-46.
- Wen L et al. Glucose metabolism in acute kidney injury and kidney repair. Front Med (Lausanne). 2021;8:744122.
- Alsahli M, Gerich JE. Renal glucose metabolism in normal physiological conditions and in diabetes. Diabetes Res Clin Pract. 2017;133:1-9.
- Fernandes R. The controversial role of glucose in the diabetic kidney. Porto Biomed J. 2021;6(1):e113.
- Faivre A et al. Tubular cell glucose metabolism shift during acute and chronic injuries. Front Med (Lausanne). 2021;8:742072.
- Rowe I et al. Defective glucose metabolism in polycystic kidney disease identifies a new therapeutic strategy. Nat Med. 2013;19(4):488-93.
重印与许可
本文已发表
视频即将推出