This study compared immediate post-treatment cephalometric and patient-reported outcomes of multiloop edgewise archwire (MEAW) therapy using mandibular mini-implant-supported modified Class II elastics with those of MEAW therapy using conventional long Class II elastics in patients with skeletal Class II malocclusion and deep overbite.
研究文章
Mandibular Mini-Implant-Supported Multiloop Edgewise Archwire Therapy for Skeletal Class II Malocclusion: A Comparative Cohort Study
本文内容
摘要
摘要
Skeletal Class II malocclusion with deep overbite can be treated using multiloop edgewise archwire (MEAW) therapy combined with Class II elastics. However, conventional dental anchorage may cause undesirable dentoalveolar effects, particularly mandibular incisor proclination. This study compared immediate post-treatment cephalometric and patient-reported outcomes of MEAW therapy using mandibular mini-implant-supported modified Class II elastics versus conventional long Class II elastics. This non-randomized bidirectional cohort study included 20 patients (10 per group) who underwent cephalometric assessment before and after treatment and completed a study-specific questionnaire. Between-group differences were primarily evaluated using analysis of covariance (ANCOVA), adjusting for pretreatment measurements. Bonferroni and false discovery rate (FDR) corrections were applied to account for multiple comparisons. All patients achieved the predefined clinical finishing criteria. After baseline adjustment and Bonferroni correction, significant between-group differences remained only for mandibular incisor inclination, with adjusted differences of +29.35° for FMIA (95% CI, 19.37–39.33; p < 0.001) and −25.28° for IMPA (95% CI, −35.88 to −14.68; p < 0.001). Differences in vertical and sagittal skeletal measurements were not statistically significant after adjustment, while doctor behavior and treatment knowledge differed significantly between groups after FDR correction. These preliminary findings suggest that mini-implant-supported MEAW therapy may improve mandibular incisor control, although larger controlled studies are needed to establish its long-term benefits.
引言
Skeletal Class II malocclusion accompanied by deep overbite is a common dentofacial developmental abnormality, typically characterized by mandibular retrusion, maxillary protrusion, or a combination of both1. Clinical manifestations often include excessive overjet, deep overbite, and sagittal disharmony of the dental arches. In addition to functional impairment, Class II malocclusion may adversely affect facial appearance, psychosocial well-being, and oral health-related quality of life2.
For adult patients with skeletal Class II malocclusion, treatment options generally include orthognathic surgery and orthodontic camouflage. Orthognathic surgery is usually indicated for severe skeletal discrepancies because it can more comprehensively correct both skeletal and dental disharmony. By contrast, orthodontic camouflage may be a reasonable alternative for selected borderline or mild-to-moderate cases when treatment goals focus on dentoalveolar compensation and acceptable facial improvement3.
The multiloop edgewise archwire (MEAW) technique is one camouflage approach used in Class II malocclusion, particularly in patients with deep overbite1. When combined with Class II elastics, MEAW may help reconstruct the occlusal plane, improve sagittal and vertical intermaxillary relationships, and provide individualized three-dimensional tooth control. However, the current evidence base for MEAW remains limited, and most reported effects are primarily dentoalveolar rather than truly skeletal4.
A major concern with conventional long Class II elastics is that, when the mandibular dentition serves as the anchorage unit, treatment may be accompanied by undesirable side effects such as proclination of the mandibular incisors and unfavorable dentoalveolar compensation. A randomized clinical trial showed that mandibular mini-implants could reduce these adverse effects compared with conventional anchorage during Class II elastic therapy5.
To mitigate the limitations of conventional dental anchorage, temporary skeletal anchorage has become increasingly important in orthodontic treatment. Mini-implants can reduce reciprocal dental anchorage effects and may improve control of incisor inclination and vertical side effects during Class II mechanics5,6,7. However, mini-implant-supported protocols that require daily Class II elastic wear remain dependent on patient adherence despite the use of skeletal anchorage.
Direct comparative evidence remains limited regarding the immediate dentoalveolar and cephalometric effects of MEAW combined with mandibular mini-implant-supported modified Class II elastics versus MEAW combined with conventional long Class II elastics. Therefore, the present study compared the two protocols in patients with skeletal Class II malocclusion, with particular attention to deep-overbite-related variables, lower-incisor control, and patient-reported outcomes. Given the non-randomized design, the study was intended to identify associations rather than establish a causal skeletal effect of mini-implant anchorage.
方案
This study was approved by the Ethics Committee of Longhu People's Hospital, Shantou City (Approval No.: LHLL2024-004). All procedures adhered to the Declaration of Helsinki. Written informed consent was obtained from all adult participants. For participants younger than 18 years, written informed consent was obtained from a parent or legal guardian, together with assent from the participant. All participants and/or their legal guardians also consented to the use of anonymized clinical data for research purposes.
Study design
This was a non-randomized bidirectional cohort study involving 20 patients with skeletal Class II malocclusion, including 12 retrospective and 8 prospective cases. Cases were classified according to the availability of outcome data at the time of study inclusion rather than solely according to calendar dates. In the retrospective component, both pretreatment (T1) and post-treatment (T2) records had already been generated during routine clinical care before study inclusion, and the relevant data were subsequently extracted from the existing clinical records. In the prospective component, eligible patients were enrolled before the post-treatment assessment was available and were followed forward until completion of orthodontic treatment, when the T2 records and patient-reported outcomes were collected. Consequently, the calendar periods of the two components partially overlapped. Treatment allocation was not randomized. Both treatment approaches were considered clinically acceptable camouflage options for the included patients, and the final treatment plan was determined after comprehensive clinical assessment and discussion between the orthodontist and the patient. Factors considered in treatment selection included the severity of the deep overbite and sagittal discrepancy, pretreatment mandibular-incisor inclination, the anticipated need for additional mandibular anchorage and vertical control, anatomical suitability for mini-implant placement, and the patient's willingness to receive temporary skeletal anchorage. The mini-implant-supported protocol was preferentially considered when stronger mandibular anchorage and greater control of mandibular-incisor proclination were clinically desirable and the patient accepted mini-implant placement. Conventional MEAW with long Class II elastics was used when conventional dental anchorage was considered clinically acceptable or when temporary skeletal anchorage was not selected. No random allocation procedure was used. Therefore, treatment-selection bias and confounding by indication cannot be excluded.
Participants
A total of 20 patients with skeletal Class II malocclusion (10 males and 10 females; age range, 14–35 years; mean age, 22.4 ± 4.1 years) were enrolled. All patients were treated by the same orthodontist (C.G.X.). Participants younger than 18 years were more frequent in the experimental group (6/10) than in the control group (1/10), indicating a potentially important difference in growth potential. Because the age range included both adolescents and adults, growth status is a potential confounder for skeletal cephalometric variables. Skeletal maturity was not systematically assessed using cervical vertebral maturation or another standardized growth-status indicator; this limitation was therefore considered when interpreting skeletal cephalometric changes.
Inclusion criteria
Patients were eligible if they met all of the following criteria: (1) Mild-to-moderate skeletal Class II relationship (5° ≤ ANB ≤ 10°); (2) Bilateral Angle Class II molar relationship; (3) No history of dental trauma, bruxism, or temporomandibular disorders; (4) No tooth morphology or structural abnormalities, and no systemic diseases affecting alveolar bone growth or tooth movement; (5) Generally healthy, with no craniofacial deformities or tooth loss.
Exclusion criteria
Patients were excluded if they met any of the following criteria: (1) Previous orthodontic treatment; (2) Systemic diseases affecting bone metabolism, such as thyroid dysfunction or multiple myeloma; (3) Long-term use of medications affecting bone metabolism, such as bisphosphonates or glucocorticoids; (4) Craniofacial syndromes or cleft lip and palate; (5) Severe periodontitis or extremely poor oral hygiene.
Sample size calculation
The sample size calculation was based on the expected between-group difference in change in ANB angle, which was prespecified as the primary outcome for sample-size planning. The calculation was performed before recruitment. According to Zhou et al. (2013)8, the experimental protocol was expected to produce an ANB reduction of 2.82 ± 0.96 degrees. For the control condition, an expected reduction of 1.3 ± 0.9 degrees was taken from Yaoyu et al. (2023)9, which used a different Class II treatment protocol. Accordingly, the calculation should be interpreted as an approximation for the ANB-based primary comparison rather than as evidence that the study was powered for all 17 cephalometric variables, questionnaire domains, or exploratory multivariable analyses. Pediatric orthodontic decision‑making should also consider growth‑related factors and potential temporomandibular joint risks for patients with skeletal malocclusion10,11.

With µ1 = 2.82 degrees, µ2 = 1.3 degrees, δ = 1.52 degrees, σ = 0.96 degrees, α = 0.05 (two-sided), and 1-β = 0.80, the calculated minimum sample size was 7 participants per group. Ten participants per group were ultimately included. This calculation applies only to the assumed ANB effect and does not establish adequate power for the multiple secondary cephalometric and patient-reported outcomes examined in this small cohort.
Orthodontic treatment protocols
All patients received fixed orthodontic treatment using McLaughlin-Bennett-Trevisi (MBT) preadjusted edgewise appliances. Brackets or bands were bonded to the full dentition, including the second molars.
Experimental group
In the experimental group, nickel-titanium archwires were sequentially changed from smaller to larger dimensions and from round to rectangular forms according to the conventional alignment and leveling sequence. After initial alignment and leveling, the maxillary archwire was replaced with a 0.016 x 0.022 inch stainless steel multiloop edgewise archwire (MEAW), and the mandibular archwire was replaced with a 0.019 x 0.022 inch stainless steel straight wire. The maxillary MEAW incorporated four loops on each side and was activated with approximately 3–5 degrees of posterior tip-back as clinically indicated. Patients were reviewed at approximately 5 week intervals, at which time archwire activation and occlusal relationships were reassessed and adjusted when necessary. The MEAW/Class II elastic phase lasted approximately 10 months: 9.8 ± 2.4 months (range, 6–14 months) in the experimental group and 10.2 ± 2.6 months (range, 6–15 months) in the control group.
In the experimental group, each patient received two mandibular mini-implants, placed bilaterally (20 mini-implants in 10 patients). Each mini-implant (diameter, 2.0 mm; length, 10.0 mm) was placed in the buccal apical region between the mandibular second premolar and first molar under local infiltration anesthesia and loaded immediately after insertion. Modified Class II elastics (5/16 inch, 3.5 oz; nominal force approximately 100 g per side) extended from the mandibular skeletal anchorage point to the first loop of the maxillary MEAW. Patients were instructed to wear the elastics for approximately 20–22 h/day, removing them only for eating and oral hygiene, and to replace them daily. Elastic wear continued until Class I canine and molar relationships were achieved and was then maintained for one additional month for stabilization. The mean MEAW/Class II elastic duration was 9.8 ± 2.4 months (range, 6–14 months). No mini-implant loosening or failure, replacement, or clinically significant soft-tissue complication was recorded. Figure 1 shows the intraoral configuration used in the experimental group.
Control group
In the control group, mini-implants were not used. After initial alignment and leveling, the same archwire protocol as that used in the experimental group was applied, with a 0.016 × 0.022 inch stainless steel MEAW wire in the maxilla and a 0.019 × 0.022 inch stainless steel straight wire in the mandible. In the control group, conventional long Class II elastics of the same nominal specification (5/16 inch, 3.5 oz; approximately 100 g per side) were applied from the mandibular second-molar hook to the first loop of the maxillary MEAW. Patients were instructed to wear the elastics for approximately 20–22 h/day, removing them only for eating and oral hygiene, and to replace them daily. The mean MEAW/Class II elastic duration was 10.2 ± 2.6 months (range, 6–15 months). No electronic or other objective compliance-monitoring device was used; adherence was assessed through patient report and clinical evaluation at follow-up visits. The delivered force was not serially instrument-measured during treatment. Thus, the two protocols differed not only in anchorage source but also in the mandibular point of force application and the resulting force vector/moment system.
Treatment completion
In both groups, fixed appliances were removed after the predefined clinical finishing criteria had been achieved: normal overjet and overbite and bilateral Class I canine and molar relationships. Hawley retainers were then provided. These criteria represent a clinical assessment rather than an independent standardized occlusal index. An American Board of Orthodontics (ABO) Objective Grading System assessment and independent blinded post-treatment occlusal grading were not performed.
Cephalometric assessment
All patients underwent lateral cephalometric radiography before and after treatment using the same panoramic and cephalometric X-ray unit (ORTHOPHOS XG5, Dentsply Sirona, USA). In the experimental group, pretreatment and posttreatment records were defined as T1 and T2, respectively, whereas in the control group they were defined as T1′ and T2′, respectively. Radiographic conditions were standardized as follows: tube voltage, 70 kV; tube current, 10 mA; focus-to-film distance, 150 cm; and the midsagittal plane positioned parallel to the film.
All lateral cephalograms were randomly coded, and both patient identity and group allocation were concealed during measurement. Digital cephalometric analysis was performed using WinCeph software (version 8.0 for Windows; Rise Corporation, Sendai, Japan). A total of 17 cephalometric measurements were analyzed, including angular and linear variables. The cephalometric landmarks, reference planes, and variables are shown in Figure 2.
All measurements were performed by the same investigator (C.G.X.). To assess intra-observer reliability, 10 radiographs were randomly selected and remeasured after a 2 week interval. The intraclass correlation coefficient ranged from 0.94 to 0.98, indicating excellent intra-observer agreement.
Patient-reported outcomes
After completion of treatment, participants were invited to complete a self-administered questionnaire under the guidance of a researcher (Z.Z.T.) who was not involved in clinical treatment. The questionnaire comprised eight dimensions corresponding to Sections (1)-(8) of Supplementary File 1: daily life impact (9 items), doctor behavior (24 items), treatment knowledge (8 items), treatment feeling (2 items), reason for treatment choice (3 items), treatment motivation (4 items), treatment concern (4 items), and level of care (7 items). Item responses were coded on 5-point scales according to the response anchors specified in the questionnaire. For each dimension, the participant-level dimension score was calculated as the arithmetic mean of the constituent item scores, retaining the original 1-5 metric. Overall satisfaction was assessed separately using the single 5-point item 'Are you satisfied with the treatment provided by the physician?' and was not included in any of the eight dimension scores. The complete questionnaire and item-to-dimension structure are provided in Supplementary File 1. The instrument was study-specific and was developed with reference to established instruments such as the Oral Health Impact Profile (OHIP) and the Malocclusion Impact Questionnaire (MIQ), together with clinical experience and the objectives of the present study. It was not a previously validated standalone questionnaire; accordingly, these patient-reported findings should be interpreted as exploratory. The response rate was 100%.
Statistical analysis
Statistical analyses were performed using R software (version 4.2.2). Continuous cephalometric variables were summarized as mean ± standard deviation (SD). Normality assumptions were assessed using the Shapiro-Wilk test. Effect estimates were reported with 95% confidence intervals, where applicable, to provide information on the precision of the estimates.
Within-group pre- and post-treatment comparisons were performed using paired t-tests when paired differences were approximately normally distributed and Wilcoxon signed-rank tests otherwise. Unadjusted between-group comparisons of treatment-related change scores (post-treatment minus pretreatment) were retained as secondary descriptive analyses. The primary comparative analysis used a parsimonious ANCOVA model for each cephalometric outcome, with the post-treatment value as the dependent variable, treatment group as the main predictor, and the corresponding pretreatment value as the covariate. Given the sample size of 20, no additional covariates were entered into these outcome-specific models. Adjusted between-group effects are reported with 95% confidence intervals and two-sided P values.
Because the questionnaire consisted of Likert-type responses and the sample size was small, dimension scores were summarized using mean ± SD and median (interquartile range [IQR]). Between-group comparisons for all eight dimensions were performed consistently using two-sided Mann-Whitney U tests. Internal consistency was assessed using Cronbach's alpha for multi-item dimensions and Pearson correlation for the two-item treatment-feeling dimension. Overall satisfaction was analyzed separately as a single ordinal item using a two-sided Mann-Whitney U test; because it was not one of the eight prespecified dimension scores, it was not included in the FDR adjustment applied across the eight dimensions.
To account for multiplicity across the 17 cephalometric outcomes, Bonferroni correction and the Benjamini-Hochberg FDR procedure were applied to the between-group analyses. The principal interpretation emphasized the baseline-adjusted ANCOVA results and findings that remained significant after correction. For the eight questionnaire domains, Benjamini-Hochberg FDR-adjusted P values were calculated from the Mann-Whitney U tests. All tests were two-sided, with p < 0.05 considered statistically significant.
结果
Clinical effectiveness
All 20 patients completed treatment and met the predefined clinical finishing criteria. The total treatment duration, defined as the complete fixed-appliance treatment course, was 22.1 ± 8.7 months in the experimental group and 22.1 ± 8.7 months in the control group, with a range of 10.5–36.0 months in each group. The MEAW/Class II elastic phase lasted 9.8 ± 2.4 months (range, 6–14 months) in the experimental group and 10.2 ± 2.6 months (range, 6–15 months) in the control group. Facial contour was not evaluated using a predefined quantitative or blinded outcome measure; the facial photographs in Figure 3 are therefore presented only as a representative clinical illustration. No new temporomandibular-joint symptoms or diagnoses were documented in the available clinical records, but no standardized temporomandibular-disorder instrument or protocol was used, and temporomandibular-joint status was not treated as a formal study outcome. In the experimental group, no mini-implant loosening or failure, replacement, clinically significant soft-tissue complication, or other mini-implant-related adverse event was recorded. Figure 3 shows a representative patient from the experimental group.
Baseline characteristics of the study subjects
Twenty patients were included, with 10 in each treatment group. Pretreatment cephalometric measurements differed significantly between groups for several variables, including FH-Npog, PP-FH, AB-MP, U1-L1, U1-SN, FMIA, IMPA, and ODI (p < 0.05), indicating important baseline imbalance. The age distribution was also uneven, with 6/10 experimental-group participants but only 1/10 control-group participants younger than 18 years. Because treatment allocation was non-randomized, these differences may reflect treatment-selection factors, growth-related confounding, and regression to the mean. Accordingly, the baseline-adjusted ANCOVA was used for the principal between-group inference, while change-score comparisons were retained as secondary descriptive analyses. Baseline characteristics are presented in Table 1.
Within-group pre- and post-treatment comparisons
Within the experimental group, the reported pre-post change-score analysis showed decreases in PP-FH and ODI and marked changes in mandibular incisor inclination (increased FMIA and decreased IMPA), together with an increased interincisal angle. ANB and Wits also decreased within the group. These findings describe cephalometric changes over treatment but, particularly in a mixed adolescent/adult sample, should not by themselves be interpreted as proof of maxillary rotation, mandibular advancement, or true skeletal remodeling. Detailed within-group results are presented in Table 2.
Within the control group, the reported pre-post analysis showed an increase in PP-FH, substantial proclination of the mandibular incisors (increased IMPA/decreased FMIA), and greater lingual inclination of the maxillary incisors. ANB and Wits also decreased within the group. These observations are most appropriately interpreted as a combination of dentoalveolar compensation and changes in cephalometric relationships; they do not establish posterior mandibular movement, maxillary rotation, or skeletal remodeling. Detailed values are presented in Table 2.
Comparison of inter-group variation and effect size
In the secondary unadjusted change-score comparison (Table 3), PP-FH, U1-L1, FMIA, IMPA, and ODI remained significant after Bonferroni correction. However, the baseline-adjusted ANCOVA materially changed the interpretation. The adjusted experimental-versus-control difference was +29.35 degrees for FMIA (95% CI, 19.37 to 39.33; p < 0.001) and -25.28 degrees for IMPA (95% CI, -35.88 to -14.68; p < 0.001); both remained significant after Bonferroni correction across 17 outcomes. U1-L1 showed a nominal adjusted difference of +15.05 degrees (95% CI, 1.69 to 28.41; p = 0.029) but did not remain significant after multiplicity correction. In contrast, the adjusted differences in PP-FH (-1.73 degrees; 95% CI, -5.24 to 1.78; p = 0.312), ODI (-3.20 degrees; 95% CI, -9.28 to 2.87; p = 0.282), ANB (-1.68 degrees; 95% CI, -4.06 to 0.70; p = 0.154), and Wits (-1.81 mm; 95% CI, -5.02 to 1.40; p = 0.251) were not statistically significant. Thus, the most robust comparative evidence supports improved mandibular-incisor control rather than a generalized skeletal or vertical treatment effect.
Figure 4 displays descriptive pre- and post-treatment distributions for the 17 cephalometric variables in the experimental and control groups, allowing the baseline imbalance and within-group distributional changes to be visualized. It is not used for the principal between-group inference. Table 3 presents the baseline-adjusted ANCOVA group effects with 95% confidence intervals. The adjusted estimates show that the strongest effects concern FMIA and IMPA, whereas PP-FH, ODI, ANB, and Wits have confidence intervals that include the null.
Multiple comparison correction
In the secondary unadjusted change-score analyses, PP-FH, U1-L1, FMIA, IMPA, and ODI remained significant after Bonferroni correction. In the primary baseline-adjusted ANCOVA, only FMIA and IMPA remained significant after Bonferroni correction; U1-L1 was nominally significant (p = 0.029) but did not survive multiplicity correction. No additional ANCOVA outcome met the FDR threshold. The main interpretation therefore centers on mandibular-incisor control, with the other unadjusted signals treated as exploratory.
Patient-reported outcomes
Internal-consistency estimates for the questionnaire dimensions are shown in Table 4. Mann-Whitney U testing showed unadjusted between-group differences for doctor behavior (p = 0.003), treatment knowledge (p < 0.001), treatment feeling (p = 0.028), and level of care (p = 0.028). After Benjamini-Hochberg FDR correction across the eight domains, doctor behavior (FDR-adjusted p = 0.013) and treatment knowledge (FDR-adjusted p = 0.006) remained statistically significant, whereas treatment feeling and level of care did not (both FDR-adjusted p = 0.057). The separate overall-satisfaction item was also higher in the experimental group (mean ± SD, 4.70 ± 0.48; median [IQR], 5.00 [4.25–5.00]) than in the control group (3.70 ± 0.48; 4.00 [3.25–4.00]); Mann-Whitney U = 89.5, p = 0.0012. This single-item comparison was not included in the eight-domain FDR correction. Because the questionnaire was study-specific and all patients were treated by the same orthodontist, these findings should be interpreted as exploratory differences in patient-reported experience rather than as direct effects of the orthodontic mechanics.
The radar chart in Figure 5 provides a descriptive visualization of questionnaire dimension scores and is not used for inferential interpretation.
Data Availability:
The de-identified study data are available on figshare: Cai Guoxin, Zhang Zitong, Lin Ruini, (2026). Comparative immediate post-treatment outcomes of mandibular mini-implant-supported multiloop edgewise archwire therapy in skeletal Class II malocclusion: a non-randomized bidirectional cohort study. figshare. Dataset. https://doi.org/10.6084/m9.figshare.34069407.v1
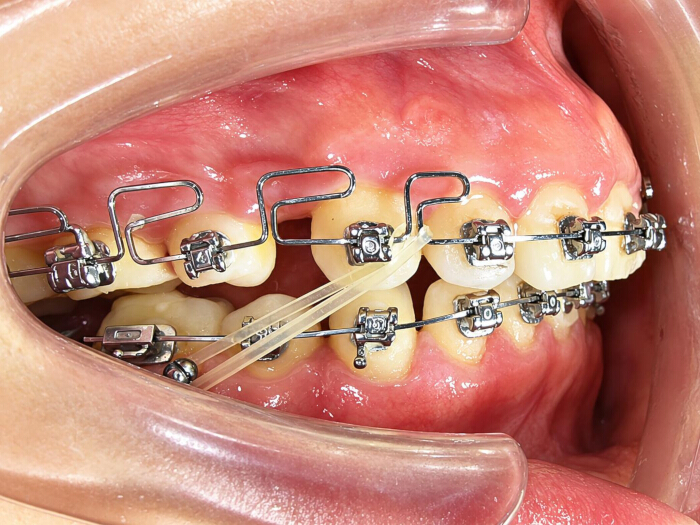
Figure 1: Intraoral photographs during treatment in the experimental group. Please click here to view a larger version of this figure.
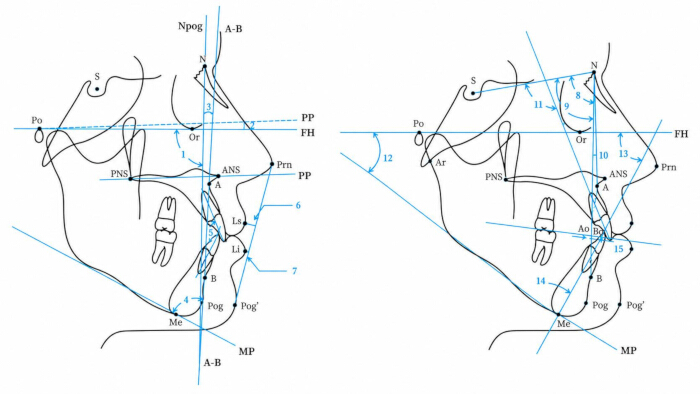
Figure 2: Cephalometric angular and linear measurements. 1. Facial angle (°), Facial plane (Na-Pog) to Frankfort horizontal angle; 2. PP-FH (°), Frankfort Horizontal Plane to Palatal Plane angle; 3. AB-NPog (°), Facial plane to AB plane angle; 4. AB-MP (°), Mandibular Plane to AB Plane angle; 5. Interincisal angle(°), Maxillary incisor axis to mandibular incisor axis angle; 6. UL-EP (mm), Upper Lip to E-Plane; 7. LL-EP (mm), Lower Lip to E-Plane; 8. SNA (°), Sella-nasion-A point; 9. SNB (°), Sella-nasion-B point; 10. ANB (°), A point-nasion-B point; 11. U1-SN angle (°), Maxillary incisor axis to sella-nasion plane angle; 12. FMA (°), Frankfurt Horizontal - mandibular plane angle; 13. FMIA(°), Frankfort Horizontal - mandibular incisor axis angle; 14. IMPA (°), Mandibular incisor axis - mandibular plane angle; 15. Wits (mm), distance from A point to B point at the occlusal plane; 16. ODI, overbite depth indicator; 17. APDI, anteroposterior dysplasia indicator. Please click here to view a larger version of this figure.
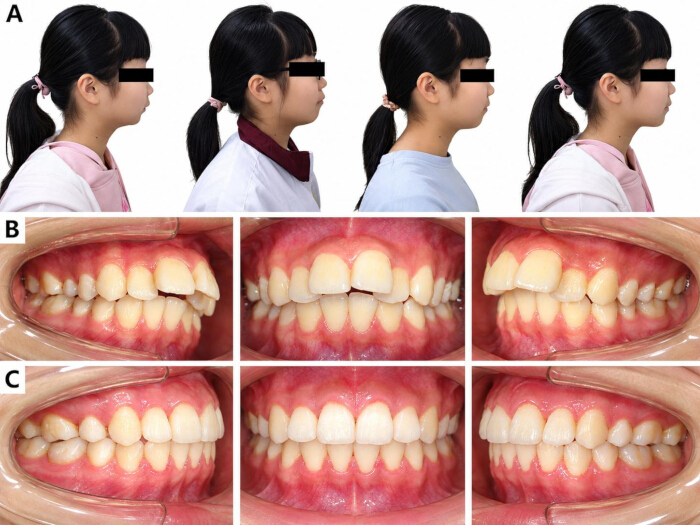
Figure 3: Clinical photographs of a representative patient in the experimental group. (A) Pretreatment and posttreatment lateral facial photographs showing profile changes. (B) Pretreatment intraoral photographs. (C) Posttreatment intraoral photographs. Please click here to view a larger version of this figure.
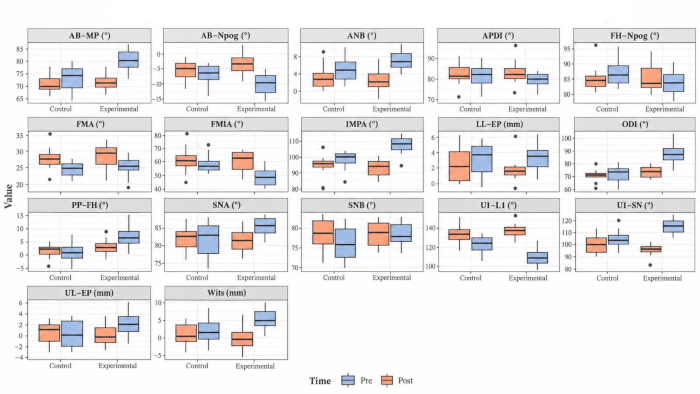
Figure 4: Box plots of pre- and post-treatment cephalometric values in the experimental and control groups. The figure is descriptive and illustrates baseline distributions and within-group changes; principal between-group inference is based on baseline-adjusted ANCOVA. Please click here to view a larger version of this figure.
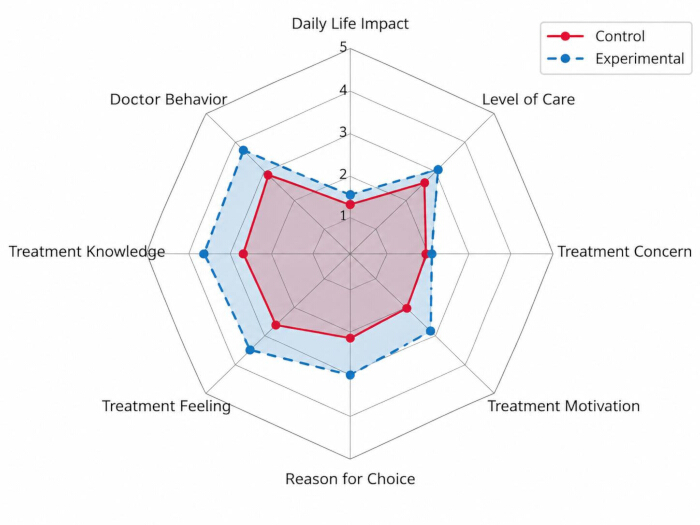
Figure 5: Radar chart comparing mean questionnaire dimension scores between the experimental and control groups. Please click here to view a larger version of this figure.
| Characteristic | Experimental (n=10) | Control (n=10) | p-value |
| Gender, n (%) | 1.000 | ||
| Male | 5 (50.0) | 5 (50.0) | |
| Female | 5 (50.0) | 5 (50.0) | |
| Age category, n (%) | 0.106 | ||
| <18 years | 6 (60.0) | 1 (10.0) | |
| 18–23 years | 2 (20.0) | 4 (40.0) | |
| >23 years | 2 (20.0) | 5 (50.0) | |
| Total fixed-appliance treatment duration, months | 22.1 ± 8.7 (10.5–36.0) | 22.1 ± 8.7 (10.5–36.0) | 1.000 |
| Treatment duration category, n (%) | 1.000 | ||
| 6–18 months | 4 (40.0) | 4 (40.0) | |
| 18–30 months | 4 (40.0) | 4 (40.0) | |
| >30 months | 2 (20.0) | 2 (20.0) | |
| FH-Npog (°) | 83.14 ± 4.28 | 88.72 ± 3.91 | 0.007 |
| PP-FH (°) | 6.56 ± 4.45 | -2.16 ± 2.56 | <0.001 |
| AB-Npog (°) | -10.32 ± 3.49 | -8.38 ± 3.15 | 0.208 |
| AB-MP (°) | 80.80 ± 5.16 | 75.99 ± 4.90 | 0.047 |
| U1-L1 (°) | 105.56 ± 10.61 | 120.18 ± 8.14 | 0.003 |
| UL-EP (mm) | 2.12 ± 2.20 | 1.68 ± 2.58 | 0.686 |
| LL-EP (mm) | 3.15 ± 1.88 | 3.73 ± 2.35 | 0.550 |
| SNA (°) | 85.32 ± 2.77 | 81.85 ± 4.58 | 0.059 |
| SNB (°) | 78.54 ± 3.10 | 76.61 ± 4.28 | 0.265 |
| ANB (°) | 6.79 ± 2.35 | 5.26 ± 2.24 | 0.153 |
| U1-SN (°) | 115.47 ± 5.66 | 106.50 ± 7.05 | 0.006 |
| FMA (°) | 24.48 ± 3.07 | 23.68 ± 1.76 | 0.486 |
| FMIA (°) | 47.34 ± 6.65 | 58.31 ± 5.54 | <0.001 |
| IMPA (°) | 108.18 ± 6.55 | 98.02 ± 6.11 | 0.002 |
| Wits value (mm) | 4.22 ± 3.16 | 1.99 ± 3.34 | 0.142 |
| ODI (°) | 87.36 ± 9.13 | 73.85 ± 5.06 | 0.001 |
| APDI (°) | 79.35 ± 4.24 | 78.19 ± 6.64 | 0.648 |
Table 1: Baseline characteristics of study participants. Data are n (%) or mean ± SD (range), as appropriate. Gender was compared using Fisher's exact test; age category using the Fisher-Freeman-Halton exact test; continuous treatment duration and baseline cephalometric variables were compared using Welch's two-sample t-test.
| Characteristic | Group | Pre-treatment | Post-treatment | Change (Post − Pre) | P value | Test |
| FH-Npog (°) | Experimental | 83.14 ± 4.28 | 85.01 ± 5.23 | 1.87 ± 3.40 | 0.116 | Paired t-test |
| FH-Npog (°) | Control | 88.72 ± 3.91 | 86.25 ± 3.50 | -2.47 ± 3.23 | 0.039 | Paired t-test |
| PP-FH (°) | Experimental | 6.56 ± 4.45 | 1.90 ± 3.31 | -4.66 ± 3.99 | 0.005 | Paired t-test |
| PP-FH (°) | Control | -2.16 ± 2.56 | 0.19 ± 1.78 | 2.35 ± 1.94 | 0.004 | Paired t-test |
| AB-Npog (°) | Experimental | -10.32 ± 3.49 | -3.65 ± 3.64 | 6.67 ± 3.23 | <0.001 | Paired t-test |
| AB-Npog (°) | Control | -8.38 ± 3.15 | -4.22 ± 4.53 | 4.16 ± 4.02 | 0.010 | Paired t-test |
| AB-MP (°) | Experimental | 80.80 ± 5.16 | 71.15 ± 3.26 | -9.65 ± 3.94 | <0.001 | Paired t-test |
| AB-MP (°) | Control | 75.99 ± 4.90 | 70.91 ± 5.92 | -5.08 ± 5.16 | 0.012 | Paired t-test |
| U1-L1 (°) | Experimental | 105.56 ± 10.61 | 137.06 ± 9.69 | 31.50 ± 10.93 | <0.001 | Paired t-test |
| U1-L1 (°) | Control | 120.18 ± 8.14 | 128.34 ± 12.93 | 8.16 ± 12.87 | 0.076 | Paired t-test |
| UL-EP (mm) | Experimental | 2.12 ± 2.20 | -0.09 ± 2.18 | -2.21 ± 1.41 | 0.006 | Wilcoxon signed-rank |
| UL-EP (mm) | Control | 1.68 ± 2.58 | -0.13 ± 1.96 | -1.81 ± 1.39 | 0.003 | Paired t-test |
| LL-EP (mm) | Experimental | 3.15 ± 1.88 | 1.59 ± 1.88 | -1.56 ± 1.26 | 0.003 | Paired t-test |
| LL-EP (mm) | Control | 3.73 ± 2.35 | 2.13 ± 2.11 | -1.60 ± 1.59 | 0.011 | Paired t-test |
| SNA (°) | Experimental | 85.32 ± 2.77 | 81.03 ± 3.67 | -4.29 ± 3.10 | 0.002 | Paired t-test |
| SNA (°) | Control | 81.85 ± 4.58 | 81.06 ± 2.83 | -0.79 ± 6.17 | 0.694 | Paired t-test |
| SNB (°) | Experimental | 78.54 ± 3.10 | 78.52 ± 3.49 | -0.02 ± 2.22 | 0.978 | Paired t-test |
| SNB (°) | Control | 76.61 ± 4.28 | 78.21 ± 3.38 | 1.60 ± 4.84 | 0.323 | Paired t-test |
| ANB (°) | Experimental | 6.79 ± 2.35 | 2.52 ± 2.62 | -4.27 ± 2.14 | <0.001 | Paired t-test |
| ANB (°) | Control | 5.26 ± 2.24 | 2.87 ± 3.44 | -2.39 ± 2.51 | 0.015 | Paired t-test |
| U1-SN (°) | Experimental | 115.47 ± 5.66 | 95.61 ± 6.10 | -19.86 ± 6.83 | <0.001 | Paired t-test |
| U1-SN (°) | Control | 106.50 ± 7.05 | 86.56 ± 9.32 | -19.94 ± 9.77 | <0.001 | Paired t-test |
| FMA (°) | Experimental | 24.48 ± 3.07 | 27.36 ± 4.23 | 2.88 ± 4.70 | 0.085 | Paired t-test |
| FMA (°) | Control | 23.68 ± 1.76 | 27.08 ± 2.55 | 3.40 ± 1.91 | <0.001 | Paired t-test |
| FMIA (°) | Experimental | 47.34 ± 6.65 | 59.24 ± 7.38 | 11.90 ± 6.65 | <0.001 | Paired t-test |
| FMIA (°) | Control | 58.31 ± 5.54 | 42.03 ± 12.20 | -16.28 ± 8.26 | <0.001 | Paired t-test |
| IMPA (°) | Experimental | 108.18 ± 6.55 | 93.40 ± 5.68 | -14.78 ± 8.97 | <0.001 | Paired t-test |
| IMPA (°) | Control | 98.02 ± 6.11 | 110.90 ± 12.40 | 12.88 ± 7.93 | <0.001 | Paired t-test |
| Wits value (mm) | Experimental | 4.22 ± 3.16 | -0.92 ± 4.23 | -5.14 ± 3.04 | <0.001 | Paired t-test |
| Wits value (mm) | Control | 1.99 ± 3.34 | -1.63 ± 5.33 | -3.62 ± 3.23 | 0.006 | Paired t-test |
| ODI (°) | Experimental | 87.36 ± 9.13 | 73.03 ± 5.15 | -14.33 ± 6.60 | <0.001 | Paired t-test |
| ODI (°) | Control | 73.85 ± 5.06 | 71.09 ± 5.46 | -2.76 ± 6.23 | 0.195 | Paired t-test |
| APDI (°) | Experimental | 79.35 ± 4.24 | 83.30 ± 6.25 | 3.95 ± 5.05 | 0.035 | Paired t-test |
| APDI (°) | Control | 78.19 ± 6.64 | 82.23 ± 7.03 | 4.04 ± 4.32 | 0.016 | Paired t-test |
Table 2: Comparison of cephalometric parameters before and after treatment between the two groups. Data are expressed as mean ± standard deviation. † UL‑EP in the experimental group and ‡ FMA in the control group were analyzed using the Wilcoxon signed‑rank test; all other within‑group analyses used the paired t‑test. Paired t‑tests were applied for approximately normally distributed paired differences, otherwise the Wilcoxon signed‑rank test was adopted.
| Characteristic | Experimental change | Control change | Adjusted group difference (Experimental − Control) | 95% CI | ANCOVA p | Bonferroni-adjusted p | FDR-adjusted p |
| FH-Npog (°) | 1.87 ± 3.40 | -2.47 ± 3.23 | 3.01 | -0.78 to 6.80 | 0.112 | 1.000 | 0.475 |
| PP-FH (°) | -4.66 ± 3.99 | 2.35 ± 1.94 | -1.73 | -5.24 to 1.78 | 0.312 | 1.000 | 0.483 |
| AB-Npog (°) | 6.67 ± 3.23 | 4.16 ± 4.02 | 1.86 | -1.67 to 5.38 | 0.282 | 1.000 | 0.479 |
| AB-MP (°) | -9.65 ± 3.94 | -5.08 ± 5.16 | -2.33 | -6.62 to 1.96 | 0.268 | 1.000 | 0.479 |
| U1-L1 (°) | 31.50 ± 10.93 | 8.16 ± 12.87 | 15.05 | 1.69 to 28.41 | 0.029 | 0.501 | 0.167 |
| UL-EP (mm) | -2.21 ± 1.41 | -1.81 ± 1.39 | -0.27 | -1.44 to 0.91 | 0.636 | 1.000 | 0.901 |
| LL-EP (mm) | -1.56 ± 1.26 | -1.60 ± 1.59 | -0.12 | -1.40 to 1.15 | 0.839 | 1.000 | 0.972 |
| SNA (°) | -4.29 ± 3.10 | -0.79 ± 6.17 | -0.18 | -3.71 to 3.35 | 0.916 | 1.000 | 0.972 |
| SNB (°) | -0.02 ± 2.22 | 1.60 ± 4.84 | -0.49 | -3.58 to 2.59 | 0.741 | 1.000 | 0.969 |
| ANB (°) | -4.27 ± 2.14 | -2.39 ± 2.51 | -1.68 | -4.06 to 0.70 | 0.154 | 1.000 | 0.479 |
| U1-SN (°) | -19.86 ± 6.83 | -19.94 ± 9.77 | 5.55 | -3.47 to 14.58 | 0.211 | 1.000 | 0.479 |
| FMA (°) | 2.88 ± 4.70 | 3.40 ± 1.91 | -0.08 | -3.33 to 3.18 | 0.961 | 1.000 | 0.972 |
| FMIA (°) | 11.90 ± 6.65 | -16.28 ± 8.26 | 29.35 | 19.37 to 39.33 | <0.001 | <0.001 | <0.001 |
| IMPA (°) | -14.78 ± 8.97 | 12.88 ± 7.93 | -25.28 | -35.88 to -14.68 | <0.001 | 0.002 | <0.001 |
| Wits value (mm) | -5.14 ± 3.04 | -3.62 ± 3.23 | -1.81 | -5.02 to 1.40 | 0.251 | 1.000 | 0.479 |
| ODI (°) | -14.33 ± 6.60 | -2.76 ± 6.23 | -3.20 | -9.28 to 2.87 | 0.282 | 1.000 | 0.479 |
| APDI (°) | 3.95 ± 5.05 | 4.04 ± 4.32 | 0.08 | -4.45 to 4.60 | 0.972 | 1.000 | 0.972 |
Table 3: Between-group comparison of unadjusted change scores and baseline-adjusted ANCOVA effects for cephalometric outcomes. Change = post-treatment − pretreatment and is shown as mean ± SD. Unadjusted change-score comparisons are presented as secondary analyses. The principal between-group estimates are from ANCOVA models with the post-treatment value as the outcome, treatment group as the main predictor, and the corresponding pretreatment value as a covariate. Adjusted effects are reported with 95% confidence intervals and multiplicity-adjusted P values. Multiplicity across 17 cephalometric outcomes was addressed using Bonferroni and Benjamini–Hochberg false discovery rate (FDR) adjustment.
| Dimension | Experimental mean ± SD | Experimental median (IQR) | Control mean ± SD | Control median (IQR) | Reliability (α / r) | Mann–Whitney U | Raw p | FDR-adjusted p | Rank-biserial r |
| Daily Life Impact | 1.58 ± 0.50 | 1.57 (1.11–2.03) | 1.36 ± 0.30 | 1.36 (1.08–1.64) | 0.837 | 63 | 0.343 | 0.392 | 0.26 |
| Doctor Behavior | 4.43 ± 0.41 | 4.43 (4.06–4.80) | 3.48 ± 0.58 | 3.48 (2.96–4.00) | 0.961 | 89.5 | 0.003 | 0.013 | 0.79 |
| Treatment Knowledge | 4.49 ± 0.38 | 4.49 (4.15–4.83) | 3.41 ± 0.58 | 3.41 (2.89–3.93) | 0.964 | 95 | <0.001 | 0.006 | 0.9 |
| Treatment Feeling | 4.34 ± 0.63 | 4.40 (3.78–4.98) | 3.45 ± 0.77 | 3.45 (2.76–4.14) | 0.947 | 79.5 | 0.028 | 0.057 | 0.59 |
| Reason for Choice | 3.33 ± 1.11 | 3.33 (2.34–4.32) | 2.67 ± 1.16 | 2.67 (1.63–3.71) | 0.762 | 69 | 0.162 | 0.216 | 0.38 |
| Treatment Motivation | 3.10 ± 1.02 | 3.10 (2.19–4.02) | 2.38 ± 0.76 | 2.38 (1.70–3.06) | 0.736 | 72 | 0.104 | 0.167 | 0.44 |
| Treatment Concern | 1.93 ± 0.63 | 1.93 (1.36–2.50) | 1.90 ± 0.50 | 1.90 (1.46–2.35) | 0.697 | 52.5 | 0.88 | 0.88 | 0.05 |
| Level of Care | 4.35 ± 0.42 | 4.35 (3.97–4.73) | 3.73 ± 0.52 | 3.73 (3.27–4.19) | 0.904 | 79.5 | 0.028 | 0.057 | 0.59 |
Table 4: Comparison of patient-reported outcome dimension scores, reliability, Mann-Whitney U tests, and FDR-adjusted P values between groups. Questionnaire dimension scores are presented as mean ± SD and median (IQR). Reliability is reported as Cronbach's alpha, except for the two-item treatment-feeling dimension, for which Pearson correlation r is reported. Between-group comparisons use two-sided Mann-Whitney U tests with Benjamini-Hochberg FDR-adjusted P values across the eight dimensions.
Supplementary File 1: Original study-specific questionnaire, including all item wording, response options, and the eight questionnaire sections used to derive the reported dimension scores. All questionnaire items were scored on a 1–5 scale using the response anchors shown above. For each of the eight dimension scores, the participant-level score was calculated as the arithmetic mean of the constituent items. The overall-satisfaction item was analyzed separately as a single ordinal outcome and was excluded from the eight dimension scores.Please click here to download this file.
讨论
Both treatment protocols produced clinically acceptable immediate post-treatment occlusal relationships according to the clinical finishing criteria used in this study. However, the findings must be interpreted in the context of a very small non-randomized cohort, important pretreatment imbalance, a broad age range that includes potentially growing adolescents and adults, and the absence of long-term follow-up. The baseline-adjusted analysis reduces, but cannot eliminate, confounding caused by non-random treatment allocation and growth-related differences. Consequently, the present data describe treatment-associated cephalometric and dentoalveolar changes and should not be interpreted as demonstrating stable skeletal remodeling or long-term superiority of either protocol.
The most convincing between-group signal after baseline adjustment concerns mandibular-incisor control. Although the secondary unadjusted change-score analysis suggested large differences in PP-FH, U1-L1, ODI, FMIA, and IMPA, several of these effects were attenuated after adjustment for their corresponding baseline values. In the ANCOVA, FMIA and IMPA remained strongly different between groups and survived Bonferroni correction, supporting less mandibular-incisor proclination/more uprighting with the experimental protocol. U1-L1 remained nominally different but did not survive multiplicity correction. In contrast, PP-FH and ODI were no longer statistically significant after baseline adjustment, and adjusted ANB and Wits differences were also nonsignificant. The evidence therefore supports a dentoalveolar incisor-control effect more strongly than a generalized vertical or sagittal skeletal effect.
The large PP-FH difference observed in the unadjusted change-score analysis requires particularly cautious interpretation because it was substantially attenuated after baseline adjustment. PP-FH is an angular relationship between the palatal plane and Frankfort horizontal; a treatment-associated change in this measurement does not, by itself, prove anatomical rotation of the maxilla relative to a stable cranial base. In a sample spanning 14 to 35 years, craniofacial growth in younger participants, landmark identification, and changes in head orientation may also contribute. Without stable-reference superimposition or another method that directly demonstrates skeletal displacement, the observed PP-FH change should be reported as a cephalometric angular change rather than as confirmed counterclockwise or clockwise maxillary rotation.
The control protocol showed greater mandibular incisor proclination and greater maxillary incisor retroclination in the reported pre-post measurements, which is compatible with dentoalveolar compensation during Class II elastic mechanics. These dental changes may contribute to correction of overjet and interarch relationships, but reductions in ANB or Wits and changes in FH-Npog cannot establish true mandibular advancement, posterior mandibular movement, or skeletal remodeling in this non-randomized mixed-age cohort. Therefore, the available evidence does not establish true skeletal improvement, maxillary rotation, or changes in gummy-smile risk.
Mandibular mini‑implant anchorage was selected in the region between the mandibular second premolar and first molar; early animal histologic investigations have described periodontal tissue responses to mandibular tooth movement12, and subsequent anatomical and clinical studies have reported favorable conditions for temporary anchorage placement13,14,15. Maxillary skeletal anchorage, including infrazygomatic or other distalization configurations, represents an important alternative and can permit a more continuous distalizing force system while potentially reducing reliance on the vertical component of intermaxillary Class II elastics16,17. The present mandibular configuration was chosen to integrate the skeletal anchorage point with the MEAW/Class II elastic force system; however, this study did not directly compare mandibular and maxillary skeletal anchorage. Therefore, the current findings should not be interpreted as demonstrating superiority or greater safety of the mandibular approach over all maxillary skeletal anchorage strategies. The mandibular anchorage configuration represents a clinically selected approach, with treatment effects potentially influenced by both anchorage location and force application.
The biomechanical comparison is also more complex than the presence or absence of a mini-implant. In the experimental group, the elastic was attached to a mandibular skeletal anchorage point, whereas in the control group it was attached to the mandibular second molar. Thus, the groups differed in both anchorage source and point of force application, with corresponding differences in force vector and moments. The observed changes should therefore be attributed to the combined protocol rather than to the mini-implant alone. Skeletal anchorage may reduce reciprocal dental side effects, particularly mandibular incisor proclination, but patients in the experimental group still had to replace and wear Class II elastics daily. Because compliance was not objectively quantified, the experimental protocol remained dependent on patient cooperation. Recent reports on skeletal-anchorage-supported fixed-appliance mechanics likewise emphasize the importance of incisor inclination, vertical control, and objective assessment of treatment outcomes18,19,20,21.
Study limitations: Several limitations materially restrict causal interpretation. First, the sample included only 20 patients and was not randomized, creating substantial risk of selection bias, confounding by indication, and low statistical power for multiple outcomes. Second, several cephalometric variables were imbalanced at baseline. ANCOVA was therefore used to adjust each post-treatment outcome for its corresponding pretreatment value, but with only 20 participants this approach cannot remove residual confounding or support extensive multivariable adjustment. Third, the age range of 14–35 years combined potentially growing adolescents with adults, and participants younger than 18 years were unevenly distributed between groups. Fourth, the protocols differed in both anchorage source and force-application point, so the observed differences cannot be isolated to the mini-implant itself. Fifth, daily elastic wear remained compliance-dependent and was not objectively quantified. Sixth, the study-specific questionnaire was not a previously validated standalone instrument, and all patients were treated by the same orthodontist, limiting interpretation of domains such as doctor behavior. Seventh, treatment finishing was judged using clinical occlusal criteria rather than an independent blinded occlusal index. Eighth, cephalometric angular changes were not confirmed by stable-reference superimposition. Finally, no conclusion regarding long-term stability can be drawn from immediate post-treatment records. Larger prospective controlled studies with prespecified outcomes, growth assessment, objective compliance/occlusal measures, and longer follow-up are needed.
Conclusion:
Both protocols achieved the predefined immediate clinical finishing criteria. In this small non-randomized cohort, baseline-adjusted analysis showed the clearest between-group differences in mandibular-incisor inclination, with more favorable FMIA and IMPA outcomes in the mini-implant-supported MEAW protocol. The unadjusted vertical and deep-overbite-related differences were substantially attenuated after baseline adjustment, and evidence for superior sagittal skeletal correction remained weak. The observed effects cannot be attributed exclusively to mini-implant anchorage because the force-application point also differed between protocols. These results should be regarded as preliminary and require confirmation in larger prospectively controlled samples with growth-status assessment and longer follow-up.
披露
The authors have no conflicts of interest to declare.
Author contributions:
Guoxin Cai conceived and designed the experiments, performed the experiments, prepared figures and tables, authored or reviewed drafts of the article, and approved the final draft. Zitong Zhang analyzed the data, prepared figures and tables, authored or reviewed drafts of the article, and approved the final draft. Ruini Lin assisted patients in completing the survey questionnaire, prepared figures and tables, authored or reviewed drafts of the article, and approved the final draft. These authors contributed equally to this work.
致谢
This study was funded by the Medical Scientific Research Foundation of Guangdong Province, China under the project titled “Clinical Evaluation of Mini-Implant Anchorage Combined with Multiloop Edgewise Arch Wire in the Treatment of Skeletal Class II Malocclusion: A Two-Way Cohort Study” (Grant No. B2025917; Document No. Yue Wei Ke Jiao Han [2025] No. 2). The funders had no role in study design, data collection and analysis, decision to publish, or preparation of the manuscript.
材料
| 姓名 | 公司 | 目录编号 | 评论 |
|---|---|---|---|
| 0.016 × 0.022-inch stainless steel MEAW archwire | A.J. Wilcock / Webster & Horsfall Group | Product No. 720-622 (0.016 × 0.022 in); https://www.ajwilcock.com/stainless-combination-wires-straight-lengths/ | Maxillary multiloop edgewise archwire |
| 0.019 × 0.022-inch stainless steel straight archwire | A.J. Wilcock / Webster & Horsfall Group | Product No. 720-922 (0.019 × 0.022 in); https://www.ajwilcock.com/stainless-combination-wires-straight-lengths/ | Mandibular archwire |
| Class II elastics, 5/16 inch, 3.5 oz (~100 g per side) | 3M / 3M Unitek | 3M Unitek Elastics 404-246, 5/16 in, 3.5 oz; 3M Stock 7000004077; https://www.3m.com.sg/3M/en_SG/p/c/dental-orthodontics/auxiliaries/intraoral-devices/elastics-packs/ | Modified Class II elastics in the experimental group and conventional long Class II elastics in the control group |
| Hawley retainer | Custom fabricated / local dental laboratory | Not applicable (custom Hawley retainer; no universal commercial catalog number) | Post-treatment retention |
| Local anesthetic for infiltration anesthesia | Septodont, Inc. / Novocol Pharmaceutical of Canada Inc. | Septocaine: 4% articaine HCl + epinephrine 1:100,000, NDC 0362-9049-02; https://dailymed.nlm.nih.gov/dailymed/drugInfo.cfm?setid=0eba0bd2-ccb6-4f7e-8d0c-e4b4e6cdce03 | Local infiltration anesthesia for mini-implant placement |
| Mandibular mini-implant, 2.0 mm diameter × 10.0 mm length | Bio-Ray Biotech Instrument Co., Ltd. | A-1P-412010 (titanium alloy, 2.0 × 10 mm); https://www.dental-bio-ray.com/index_ch.html | Temporary skeletal anchorage; two implants per experimental-group patient |
| MBT preadjusted edgewise appliance | 3M Unitek Corporation | Gemini MBT 5×5, 0.022; Catalog No. 119-154; https://multimedia.3m.com/mws/media/1506365O/revista-infodent-plus-enero-marzo-2018.pdf | Fixed orthodontic treatment |
| Nickel-titanium archwires | Ormco Corporation | Copper NiTi product family (catalog number varies by size; e.g., 266-2100 for 0.016 × 0.022); https://store.ormco.com/en-us/wires/copper-niti | Initial alignment and leveling |
| ORTHOPHOS XG5 panoramic and cephalometric X-ray unit | Dentsply Sirona / Sirona Dental Systems GmbH | ORTHOPHOS XG5; https://assets.dentsplysirona.com/flagship/en-us/products/imaging-systems/extraoral-imaging/Dentsply_Sirona_Imaging_2D_Family_Brochure%20.pdf | Pretreatment and post-treatment lateral cephalometric radiography |
| R software v4.2.2 | R Foundation for Statistical Computing | Version 4.2.2; https://www.r-project.org/ | Statistical analysis |
| WinCeph v8.0 for Windows | Rise Corporation, Sendai, Japan | WinCeph Version 8.0; https://www.risecorp.co.jp/archive/winceph/winceph805.pdf | Digital cephalometric analysis |
参考文献
- Beltrão P. Treatment of Class II deep overbite with multiloop edgewise arch-wire (MEAW) therapy. In: Naretto S, editor. Principles in contemporary orthodontics. InTech; Rijeka, Croatia; 2011. Available from: https://www.intechopen.com/chapters/24345
- İnce-Bingöl S, Kaya B, Mamuk A. Evaluation of factors associated with oral health-related quality of life in adolescents with class II malocclusion: a cross-sectional study. J Orofac Orthop. 2026;87(Suppl 1):131-41.
- Raposo R, Peleteiro B, Pao M, Pinho T. Orthodontic camouflage versus orthodontic-orthognathic surgical treatment in class II malocclusion: a systematic review and meta-analysis. Int J Oral Maxillofac Surg. 2018;47(4):445-55.
- Tabancis M, Ratzmann A, Doberschütz P, Krey KF. Multiloop edgewise archwire technique and denture frame analysis: a systematic review. Head Face Med. 2020;16(1):32.
- El-Dawlatly MM, Mabrouk MA, Eldakroury A, Mostafa YA. The efficiency of mandibular mini-implants in reducing adverse effects of class II elastics in adolescent female patients: a single blinded, randomized controlled trial. Prog Orthod. 2021;22(1):27.
- Hong VTT, Lien TTK, Tuan PA, Viet H. Superior effect of mini-implant anchorage in the treatment of skeletal class II malocclusion. J Orthod Sci. 2024;13:44.
- Owayda A, et al. The effectiveness of the total-maxillary-arch-distalization approach in treating class II division 1 malocclusion: a systematic review. Clin Oral Investig. 2024;28(6):333.
- Zhou Y, Huang MF, Fang ZX, Lu ZZ. Cephalometric study of non-extraction treatment of skeletal Class II malocclusion with micro-implant anchorage and multiloop archwire. Chin J New Clin Med. 2013;6(6):509-12.
- Yaoyu D. Therapeutic effect of non-extraction treatment of skeletal Class II malocclusion by transmission straight wire technique. Chinese Journal of Orthodontics. 2023;30(3):121-5.
- Zhou C, et al. Expert consensus on pediatric orthodontic therapies of malocclusions in children. Int J Oral Sci. 2024;16(1):32.
- Tian Y, et al. Effects of orthodontic camouflage treatment vs orthodontic-orthognathic surgical treatment on condylar stability in Class II hyperdivergent patients with severe temporomandibular joint osteoarthrosis: a retrospective observational study. Angle Orthod. 2023;93(4):458-66.
- Lee SY, Kim TW, Chang YI. Histologic changes in mandibular periodontium of the monkey following experimental extrusion of anterior teeth. Korean J Orthod. 1995;25(4):403-14.
- Sharma M, et al. Three-dimensional assessment of mandibular canal in different sagittal and growth patterns for safe placement of temporary skeletal anchorage devices: a prospective study. Am J Orthod Dentofacial Orthop. 2025;167(4):444-53.
- Ishizaki-Terauchi A, et al. Relationship between laterality of orthodontic miniscrew failure and clinical variables. J Clin Med. 2024;13(23):7115.
- Fan X, et al. Measurements of the anatomical structures of the mandibular buccal shelf for the safe insertion of mini-implants: a cone-beam computed tomography retrospective study. BMC Oral Health. 2025;25(1):1612.
- Chavan V, et al. Predictors of infrazygomatic crest implant failure: a prospective study on risk factors, stability, and clinical outcomes in orthodontic anchorage. Cureus. 2025;17(4).
- Chang CH, Lin JH, Roberts WE. Success of infrazygomatic crest bone screws: patient age, insertion angle, sinus penetration, and terminal insertion torque. Am J Orthod Dentofacial Orthop. 2022;161(6):783-90.
- Nguyen VA, Le TTTH, Nguyen MP, Dang TN. Dentofacial effects of lingual versus labial fixed appliances in adults treated with four-premolar extractions and skeletal anchorage-supported mechanics: a retrospective comparative cephalometric study. J Orofac Orthop. 2026. doi:10.1007/s00056-026-00685-3.
- Nguyen VA, et al. Clinical outcomes of digital straightwire lingual versus labial fixed appliances assessed with American Board of Orthodontics indices: a retrospective cohort study. Clin Oral Investig. 2026;30(3):108.
- Nguyen VA, Ninh DV. The treatment of severe Class II division 2 patients with deep overbites and gummy smiles using lingual appliances: a case series. Australas Orthod J. 2024;40(1):95-110.
- Nguyen VA, et al. Comparative post-treatment incisor inclination and mandibular plane angle in adults treated with lingual and labial fixed appliances under miniscrew-supported nonextraction mechanics: a retrospective study. Int Orthod. 2026;24(3S):101183.