该工作流程结合了批量转录组学和单细胞转录组学以及初步的患者组织检测,以在糖尿病足溃疡中优先筛选MMP1。MMP1表现出以成纤维细胞为中心的表达模式且在组织中丰度较高,提示其与基质重塑相关,但其因果关系及临床应用价值仍有待明确。
研究文章
整合批量与单细胞转录组学结合组织验证优先确定糖尿病足溃疡中的 MMP1
* These authors contributed equally
本文内容
摘要
摘要
糖尿病足溃疡(DFU)中可重复转录组变化的细胞来源尚未完全明确。本研究整合了差异表达分析、加权基因共表达网络分析(WGCNA)、糖尿病周围神经病变(DPN)基因筛选、探索性机器学习特征选择、两个外部批量转录组数据集、单细胞分析、传统中医药(TCM)网络分析,以及患者组织的定量聚合酶链式反应(qPCR)和蛋白质印迹实验。在GSE199939数据集(10例DFU样本和11例对照样本)中,共鉴定出3,691个差异表达基因,其中WGCNA的蓝色模块与DFU高度相关(r = 0.97,p = 5 × 10-13)。将差异表达基因、蓝色模块中心基因与1,062个DPN相关基因取交集,获得77个候选基因。CCL7、CHEK1、MKI67、MMP1、MMP13 和 TRPV2 至少被两种特征选择方法支持;支持向量机递归特征消除中出现的完全分离现象提示发现队列可能存在过拟合风险。MMP1 在发现队列中表现出最大的表达变化(log2倍数变化 = 9.854;校正后p = 1.24 × 10⁻²⁹)。在合并的GSE68183/GSE80178矩阵中,MMP1 的校正后p值为0.0159,受试者工作特征曲线下面积(AUC)达0.981。在GSE134431数据集中,MMP1 在DFU组织中的表达名义上高于非溃疡糖尿病足皮肤(p = 0.0225;校正后p = 0.135;AUC = 0.808)。对来自24个样本的69,944个细胞的分析显示,成纤维细胞中MMP1的平均表达水平最高,且在DFU样本的成纤维细胞、角质形成细胞和内皮细胞中,样本层面的表达更高。患者组织检测结果显示,在四对匹配样本中MMP1 mRNA丰度更高(ΔCq配对检验,p = 3.04 × 10⁻⁵),在三对匹配样本中蛋白丰度更高(配对p = 0.0107)。统计学重复性尚不完全。研究结果提示存在以成纤维细胞为中心的基质重塑关联,但受限于基于计数的发现分析中每百万转录本(TPM)输入数据、单细胞预处理记录不完整以及组织检测样本量较小等因素。其因果关系及临床应用价值尚未确立。
引言
糖尿病足溃疡是糖尿病的一种严重且易复发的并发症,由神经病变、反复机械性负荷、外周动脉疾病、易感感染以及组织修复能力受损等多种因素共同作用所致。目前估计,全球每年有数百万人受此影响,且伤口愈合往往耗时较长,复发、住院、下肢截肢和死亡的风险显著1。因此,预防与管理不仅依赖于局部伤口护理,还需识别保护性感觉的丧失,降低足底压力,治疗感染与缺血,并干预全身性危险因素1,2。其中,糖尿病性周围神经病变尤为关键,因其感觉功能进行性障碍可导致患者对压力、创伤及组织破坏的感知减弱,而运动和自主神经异常还可能进一步改变足部生物力学及皮肤完整性2,3。在组织层面,神经性损伤可能与神经炎症、微血管功能障碍、代谢应激及修复缺陷并存,从而形成一种即使接受标准治疗仍难以愈合的创面微环境1,3。
成功的皮肤愈合需要协调的炎症反应、再上皮化、血管生成、成纤维细胞活化、细胞外基质(ECM)沉积以及后续的基质重塑过程。在糖尿病状态下,这些过程可能出现时间上的紊乱:炎症信号可能持续激活,角质形成细胞的迁移可能受损,内皮细胞反应可能不足,而成纤维细胞可能产生或组织异常的基质。成纤维细胞在修复的间质阶段中处于核心地位,因为它们合成基质蛋白、调控胶原结构、与免疫细胞和上皮细胞进行通讯,并参与伤口收缩。利用患者来源的糖尿病足溃疡(DFU)成纤维细胞开展的研究表明,ECM相关转录及基质组装存在持续性异常,这支持了成纤维细胞状态是慢性伤口生物学的重要组成部分的观点4。基质金属蛋白酶(MMPs)通过切割ECM底物,促进细胞迁移、组织更替和重塑而参与这一过程;然而,其作用取决于定位、时机、底物可用性以及金属蛋白酶组织抑制剂(TIMPs)的调控5。因此,蛋白水解与基质替换之间的失衡可能与修复受损相容,但单个MMP表达升高本身并不能确定其具有有害或有益作用。基质金属蛋白酶1(MMP1)是一种能够参与纤维胶原更替的间质胶原酶,已有报道显示其在DFU组织中发生改变,既往的临床研究也已将MMP/TIMP谱与伤口状态或愈合轨迹相关联6,7。这些观察结果支持进一步研究MMP1在DFU中的作用。
转录组分析为鉴定与糖尿病足溃疡(DFU)相关的分子程序提供了一种系统性方法,但若干方法学上的局限性给结果解读带来了困难。基于组织整体的转录组数据会将角质形成细胞、成纤维细胞、内皮细胞、免疫细胞及其他组分的信号进行平均,导致难以判断差异表达基因的信号来源于特定细胞类型内的表达改变、细胞组成比例的变化,或二者兼有。此外,由于实验平台、标准化策略、组织取样部位、溃疡严重程度、感染状态、疾病阶段以及对照组织的不同,不同数据集之间的可比性也可能降低。值得注意的是,非溃疡性糖尿病足皮肤是一种具有临床相关性的糖尿病组织对照,但其不能与健康皮肤等同。单细胞RNA测序可在一定程度上解决细胞来源的难题,通过解析异质性细胞群体及其转录状态来实现更精确的分析。此前一项针对糖尿病足溃疡的单细胞及空间转录组学研究鉴定出了不同的成纤维细胞亚群,并表明成纤维细胞的分子程序会因伤口微环境及愈合状态的不同而存在差异8。这些发现支持采用单细胞分辨率的分析方法,以补充组织整体转录组数据的不足。
特征选择方法可能有助于从高维表达数据中优先筛选候选基因,但在样本量较小的生物医学研究中,这种方法特别容易产生过于乐观的估计结果和不稳定的基因选择。当测量的变量数量远超生物学样本数量时,即使缺乏可推广的预测信息,也可能出现明显的完美分类现象。若使用相同的观测数据进行特征选择、参数调优和性能评估,将进一步夸大AUC值,因此必须采用嵌套交叉验证、锁定模型以及真正独立的测试队列来评估预测性能9,10。这些问题在糖尿病足溃疡(DFU)研究中尤为相关,因为目前公开可用的队列通常样本量小且具有异质性。传统中药成分-靶点-草药数据库仅用于假设生成。
本研究整合了批量转录组学、加权基因共表达网络分析(WGCNA)、DPN相关基因筛选、机器学习特征选择、外部数据集评估、单细胞分析、中医网络分析以及患者组织验证。在发现队列中鉴定出的候选基因在多个附加转录组数据集中进行了评估,并利用单细胞数据将最优候选基因定位至特定细胞类型。随后通过qPCR和蛋白质印迹法在患者组织中检测了MMP1在mRNA和蛋白质水平的表达。该研究框架旨在鉴定出可重复的糖尿病足溃疡(DFU)相关候选基因,并阐明其细胞与生物学背景。
方案
Study design and data sources
The study, including the collection and use of patient tissue specimens for qPCR and western blot validation, was reviewed and approved by the Ethics Committee of Wuhan Fourth Hospital (approval No. KY2024-161-01). All procedures involving human tissue were conducted in accordance with the approved protocol and applicable ethical principles. The transcriptomic component of the study used publicly available, de-identified datasets. Written informed consent was obtained from all participants whose tissue specimens were used for the experimental validation. The publicly available transcriptomic datasets were analyzed in de-identified form, and consent procedures for the original data-generating studies were handled by the respective institutions.
This study integrated bulk transcriptomics, network analysis, feature selection, single-cell analysis, TCM network prediction, and patient-tissue validation. The discovery cohort was Gene Expression Omnibus (GEO) dataset GSE199939 (10 DFU and 11 control samples). External bulk-transcriptomic assessment included a merged GSE68183/GSE80178 matrix (9 DFU and 6 control samples) and GSE134431 (13 DFU and 8 non-ulcerated diabetic foot skin [DFS] samples). Single-cell analysis used a preprocessed, SingleR-annotated Seurat object derived from GSE165816, comprising 69,944 cells from 24 samples (14 DFU and 10 controls). Tissue assessment included four matched DFU–periwound patient pairs for qPCR and three matched pairs for western blotting, based on recovered assay records and author-confirmed pairing. All materials and equipment used in this study are listed in the Table of Materials.
Construction of the DPN-related gene set
DPN-related genes were retrieved from the National Center for Biotechnology Information (NCBI) Gene database using rentrez. Search terms included “diabetic peripheral neuropathy”, “diabetic neuropathy”, “diabetic polyneuropathy”, “painful diabetic neuropathy”, and “diabetic sensorimotor polyneuropathy”, restricted to Homo sapiens. Returned identifiers were mapped to official gene symbols, converted to uppercase, cleaned, and deduplicated. The database-derived genes were combined with a literature-curated DPN gene list and deduplicated, yielding 1,062 DPN-related genes. The complete search strings and identifier-cleaning code are included in the accompanying scripts; they also include diabetic neuropathies, diabetes combined with distal symmetric/symmetrical polyneuropathy or peripheral neuropathy, and the Diabetic Neuropathies MeSH term. The literature-derived component still requires citation-level provenance.
Discovery-cohort preprocessing and differential-expression analysis
The GSE199939 expression matrix was aligned to the phenotype table by sample identifier. Duplicate gene identifiers were made unique. The archived discovery analysis rounded the expression values and fitted a negative-binomial model using DESeq2 (version 1.48.2), with group as the design factor and DFU versus control as the contrast. Genes with missing adjusted p values were excluded. Multiple testing was controlled using the Benjamini–Hochberg (BH) procedure. The archived differentially expressed gene (DEG) list used an absolute log2 fold change greater than 1 and BH-adjusted p < 0.05. Comparison with the public GEO source confirmed that the input was TPM, rather than raw read counts. Rounding TPM does not meet the raw-count requirement of DESeq2. The original estimates are retained, but the validity of the discovery statistics and dependent WGCNA and feature-selection results remains unresolved pending appropriate reanalysis. The source comparison is documented in the supplementary archive.
For visualization, the DESeq2 variance-stabilizing transformation (VST) was applied with blind = FALSE. Principal component analysis (PCA) was performed on the VST expression matrix. The heatmap used row-wise z scores for the 50 genes with the smallest adjusted p values. The PCA implementation centered and scaled gene-wise transformed values using prcomp with scale. = TRUE.
Weighted gene co-expression network analysis
For WGCNA, genes with counts greater than 5 in at least three GSE199939 samples were retained. Size factors were estimated with DESeq2, VST was applied with blind = TRUE, and the 5,000 genes with the largest across-sample variance were selected. Sample and gene quality was assessed using goodSamplesGenes, and average-linkage hierarchical clustering was used for sample-level quality assessment.
A signed network was constructed with WGCNA (version 1.74). Candidate powers of 1–10 and 12–30 in increments of 2 were evaluated using pickSoftThreshold; a scale-free topology fit target of 0.85 was used, and the selected soft-thresholding power was 18. Modules were identified with blockwiseModules using a signed adjacency and signed topological overlap matrix, Pearson correlation, minimum module size of 30, merge cut height of 0.25, reassignment threshold of 1 × 10⁻⁶, pamRespectsDendro = FALSE, and maximum block size of 10,000.
Module eigengenes were correlated with a binary DFU trait. Non-gray modules with |r| > 0.5 and p < 0.05 were considered DFU-associated. For each associated module, gene significance (GS) was defined as the Pearson correlation between gene expression and DFU status, and module membership (MM) as the Pearson correlation between gene expression and the corresponding module eigengene. Hub genes were defined by |MM| > 0.8 and |GS| > 0.5. The blue module, which showed the strongest positive association with DFU, was carried forward. Its hub genes were intersected with the DEGs and the DPN-related gene set. The reported hub threshold therefore uses the absolute values of both MM and GS, regardless of correlation sign.
Machine-learning-based feature prioritization
The 77 genes shared by the DEG, blue-module hub-gene, and DPN-related gene sets were evaluated in GSE199939. Duplicate gene symbols were collapsed by their mean expression. The candidate-gene matrix was log2-transformed as when the maximum value exceeded 50, zero-variance features were removed, and retained features were standardized. A random seed of 123 was used. The implemented sequence was cohort-wide candidate screening, duplicate-symbol collapsing, conditional log transformation, zero-variance filtering, full-cohort centering and scaling, and algorithm-specific feature selection. DEG and WGCNA screening used the full discovery cohort before algorithm-level cross-validation. The reported workflow therefore does not establish leakage-free nested validation, and its internal AUCs cannot be used as unbiased estimates of predictive performance.
Three feature-selection procedures were applied. First, least absolute shrinkage and selection operator (LASSO) logistic regression was fitted with glmnet (version 5.0), binomial family, alpha = 1, classification error as the cross-validation measure, no additional standardization, and five-fold cross-validation constrained by the smaller class size. Features at lambda.1se were selected; lambda.min was used only if lambda.1se selected no gene. Second, a random forest with 1,000 trees was fitted using randomForest (version 4.7-1.2); genes with a mean decrease in Gini at least as large as the mean importance across candidate genes were retained. Third, linear support vector machine recursive feature elimination (SVM-RFE) was implemented with e1071 (version 1.7-17), ranking features by the squared linear weight on the full cohort before evaluating progressively smaller feature subsets by leave-one-out cross-validation (LOOCV) AUC. The ranking was not recomputed within each training fold. Linear SVM fitting used scale = FALSE and probability = TRUE without an explicit cost-tuning grid. LASSO penalty selection used its internal cross-validation without a separate outer evaluation loop, and random-forest importance was calculated from the full cohort.
No gene was selected by all three methods; therefore, genes supported by at least two methods were retained. SVM-RFE produced an AUC of 1.00 across all evaluated subset sizes, and the smallest tied subset was selected. Because this complete separation raised concerns about overfitting and optimistic assessment in the small discovery cohort, the SVM-RFE AUC was not interpreted as an estimate of clinical performance. No locked multigene model was tested in an external cohort; external receiver operating characteristic (ROC) analyses assessed individual candidate-gene expression. Inspection of the analysis script confirmed that preprocessing and SVM feature ranking were not confined to training folds. The same LOOCV results were used to choose the subset size, without an outer evaluation loop. Consequently, this workflow contains information leakage and supports exploratory feature prioritization only.
Functional enrichment analysis
Gene Ontology (GO) and Kyoto Encyclopedia of Genes and Genomes (KEGG) over-representation analyses were performed on the six-gene panel. Gene symbols were mapped to Entrez identifiers with org.Hs.eg.db (version 3.21.0). GO analysis was performed with clusterProfiler (version 4.16.0) across biological process, cellular component, and molecular function ontologies. KEGG enrichment used the human organism code (hsa). Significant terms were defined as nominal p < 0.05 and BH-adjusted p < 0.05. Because only six genes were included, enrichment analysis was used primarily for functional annotation. The KEGG script used local KEGG.db annotations with enrichKEGG(use_internal_data = TRUE); the annotation release must be documented. The GO and KEGG scripts did not supply a custom universe, so the annotation databases defined the default backgrounds.
External bulk-transcriptomic assessment
For the merged GSE68183/GSE80178 matrix, gene symbols were standardized and duplicate symbols were collapsed by mean expression across matching rows. The six candidate genes were aligned to the phenotype file. Because the available files did not fully document the upstream merging and batch-correction procedure, this dataset was analyzed as provided and interpreted cautiously. Consequently, neither the removal of batch effects nor the independence of the group signal from study effects can be established from the supplied processing record. This matrix provides exploratory cross-dataset support rather than definitive replication.
For GSE134431, the six candidate genes were extracted from the reads per kilobase per million mapped reads (RPKM) matrix and transformed as log2(RPKM + 1). DFS was used as the reference group and DFU as the comparison group. DFS represents non-ulcerated diabetic foot skin. The originally submitted Figure 4C plotted raw RPKM; the revised panel uses the stated log2(RPKM + 1) scale. Two-sided Wilcoxon tests with the normal approximation and continuity correction and automatically oriented ROC analyses were verified on both scales and gave identical p values and AUCs because the transformation is strictly monotonic.
Within each bulk validation dataset, between-group expression differences were tested using two-sided Wilcoxon rank-sum tests, and BH correction was applied across the six genes. ROC curves were calculated with pROC (version 1.19.0.1), using direction selected automatically by the package. AUCs and corresponding 95% confidence intervals (CIs) were calculated to compare discriminatory patterns across datasets. Automatically selecting ROC direction from each assessment dataset may give optimistic discrimination; these single-gene AUCs are descriptive and do not validate a prespecified clinical prediction model.
Single-cell localization and sample-level analysis
Single-cell analysis used the saved Seurat object biofsci_SingleR_annotated_MMP1_analyzed.rds from GSE165816, containing 22,889 genes and 69,944 cells in the RNA assay. The RNA assay retained a non-negative integer counts layer and a data layer generated by LogNormalize with a scale factor of 10,000 followed by log1p transformation; the latter was not TPM. The object contained 2,000 variable genes selected using the vst method (loess.span = 0.3; 20 equal-width bins), scaled expression for all retained genes (centering and scaling enabled; scale.max = 10), and 50 principal components calculated from the variable features with seed 42. The saved command history used Harmony dimensions 1–20 for nearest-neighbor construction and uniform manifold approximation and projection (UMAP). Neighbor settings included k = 20, Annoy with 50 trees and Euclidean distance, and a shared nearest-neighbor (SNN) pruning threshold of 1/15. Clustering used resolution 0.8, algorithm 1, n.start = 10, n.iter = 10, and random.seed = 0. UMAP used the uwot implementation, 30 neighbors, two output dimensions, a cosine distance metric, min.dist = 0.3, spread = 1, learning.rate = 1, and seed 42. The object retained a Harmony reduction, but the original quality-control cutoffs, complete RunHarmony call including the batch covariates, and SingleR reference and annotation settings for this analyzed object could not be recovered. Cell-type labels, group labels, and sample identifiers were stored in SingleR_label, Group, and orig.ident, respectively. Ten annotated cell types were retained: B cells, CD8+ T cells, endothelial cells, epithelial cells, fibroblasts, hematopoietic stem cells, keratinocytes, macrophages, monocytes, and neurons.
MMP1 expression was summarized by cell type. Cells with normalized MMP1 expression greater than zero were classified as MMP1-positive. For sample-level analysis, mean normalized expression was calculated for each sample-cell-type combination. DFU and control samples were compared within each cell type using two-sided Wilcoxon rank-sum tests followed by BH correction across all tested cell types. The GEO sample accession, rather than the individual cell, was the unit used in these reported comparisons. The 24 accessions were not treated as proof of 24 independent donors. The saved object did not contain a verified donor identifier, and repeated tissue sampling within donors was not modeled; the sample-level tests are consequently interpreted as exploratory. These summaries average normalized expression within sample and cell type; they are not count-summed pseudobulk differential-expression models.
Ten functional gene sets were scored with Seurat AddModuleScore. Spearman correlations between per-cell MMP1 expression and module scores were calculated and BH-corrected. For exploratory MMP1-high analysis, the three cell types with the highest mean MMP1 expression among cell types containing at least 50 cells were selected. A global cutoff was defined as the median expression among MMP1-positive cells when more than 10 positive cells were available; the script otherwise used the overall 75th percentile. Cells above this cutoff were assigned to the MMP1-high group and the remaining cells to the MMP1-low group. FindMarkers used a Wilcoxon test, logfc.threshold = 0.25, and min.pct = 0.1. Upregulated genes with adjusted p < 0.05 were subjected to GO biological-process enrichment. Because the groups were defined by MMP1 expression, this analysis was used to describe pathways associated with the MMP1-high state. Per-cell correlations, their adjusted p values, and MMP1-high versus MMP1-low enrichment are descriptive because within-sample dependence was not modeled. Individual cells were not interpreted as independent biological replicates.
TCM ingredient-target-herb prediction
The six prioritized genes were matched to column 4 of the local Comparative Toxicogenomics Database (CTD) chemical-gene interaction table. Records were restricted to Homo sapiens in column 7. Ingredient names were trimmed and normalized to lowercase for matching, and duplicate ingredient-target and herb-ingredient mappings were removed. Ingredients were linked to herbs using the herb-ingredient reference table. Database enrichment used nominal p < 0.05 and adjusted p < 0.05. Duplicate herb-ingredient-target records were removed before coverage-based summarization. Herb enrichment used clusterProfiler::enricher with the herb-ingredient mapping as TERM2GENE, minGSSize = 1, maxGSSize = 500, pvalueCutoff = 1, and qvalueCutoff = 1 before applying the nominal and BH-adjusted significance thresholds. These database links may describe changes in expression or activity and do not establish direct binding or a uniform direction of effect.
Herbs were ranked using the following coverage score:
S = 3R + 5L +2T + 3C + 2I + N (1)
Here, R is the MMP1 record count, L is the number of MMP1-linked ingredients, T is the number of covered targets, C is the core-ingredient count, I is the matrix-axis indicator, and N is the total number of ingredients.
Core ingredients were quercetin, luteolin, and berberine. The matrix-axis indicator was set to 1 when an herb covered both MMP1 and MMP13 and to 0 otherwise. Candidate herbs were required to contain at least one MMP1-linked record and either at least two MMP1-linked ingredients or at least four targets plus one core ingredient. The score was used to summarize database coverage and was not treated as a pharmacologic efficacy measure. The coefficients define a custom, heuristic coverage rule that emphasizes MMP1-linked records and ingredients, broader target coverage, the three designated ingredients, and joint MMP1/MMP13 coverage. They were not fitted to clinical outcomes or experimentally validated, and alternative weights could change herb rankings.
Patient tissue collection and preliminary qPCR and western blot assessment
Patients with clinically diagnosed diabetic foot ulcers who underwent clinically indicated debridement or surgery at Wuhan Fourth Hospital were eligible when foot tissue was available and written informed consent had been obtained. Exclusion criteria were malignancy at the sampling site, a non-diabetic cause of the ulcer, or insufficient tissue quantity or quality for the planned assays. DFU tissue and non-ulcerated tissue surrounding the wound were obtained from the same patient under the approved study protocol. The latter served as a matched periwound comparator; it was not healthy non-diabetic skin. The qPCR assessment comprised four matched pairs (four DFU specimens and four corresponding periwound specimens), and western blotting comprised three matched pairs. Matching was confirmed by the authors for each assay; cross-assay identity was not used in the statistical comparisons. Each patient was the biological unit, and technical PCR wells were repeated measurements within a specimen. These preliminary assays were intended to assess tissue-level expression of MMP1 and were not designed to establish diagnostic performance, causality, or generalizability across DFU phenotypes.
For qPCR validation, total RNA was extracted from patient-derived tissue specimens using a total RNA extraction reagent according to the manufacturer's instructions. RNA concentration and purity were assessed spectrophotometrically, and samples with an A260/A280 ratio of 1.8–2.1 were used for subsequent analyses. Total RNA (1 µg) was reverse transcribed using a Moloney murine leukemia virus (M-MLV) reverse-transcription kit in a final reaction volume of 20 µL. The available instrument project identifies a real-time PCR system. Quantitative PCR was reported using 2x SYBR Green PCR master mix in a 20 µL reaction containing 10 µL of 2x SYBR Green master mix, 0.4 µL each of the forward and reverse primers, 2 µL of complementary DNA (cDNA), and 7.2 µL of nuclease-free water. The amplification program consisted of an initial denaturation at 95 °C for 30 s, followed by 40 cycles of 95 °C for 5 s and 60 °C for 30 s. A melting-curve analysis was performed to verify amplification specificity. MMP1 transcript abundance was measured with β-actin (ACTB) as the reference gene. Primer sequences are listed in Table 1. For the revised paired analysis, the five technical wells per target within each specimen were averaged before ΔCq calculation, and relative MMP1 expression was calculated using the 2-ΔΔCq method, with the non-ulcerated periwound tissue group used as the calibrator. The recovered sample pairs were NC–DFU, NC1–DFU1, NC2–DFU2, and NC3–DFU3, confirmed by the authors as four patient-matched pairs. The previous qPCR plot used five technical-well values from only NC and DFU; the revised plot shows one specimen-level value after averaging technical wells for each of the four pairs. Paired inference used ΔCq = mean Cq(MMP1) − mean Cq(ACTB), rather than well-level fold-change values. The archived instrument project also differs from the reported reaction volume and cycling program, and its correspondence to the plotted experiment remains unresolved.
For western blot (WB) validation, tissue specimens were homogenized in ice-cold radioimmunoprecipitation assay buffer supplemented with protease inhibitors. Lysates were incubated on ice for 30 min and centrifuged at 12,000 x g for 15 min at 4 °C. The supernatants were collected, and protein concentrations were determined using a bicinchoninic acid assay. Equal amounts of protein (20 µg per lane) were separated on 4%–20% gradient sodium dodecyl sulfate-polyacrylamide gels and transferred onto 0.22 µm polyvinylidene difluoride membranes. Membranes were blocked with 5% nonfat milk in Tris-buffered saline containing 0.1% Tween-20 for 1 h at room temperature and incubated overnight at 4 °C with an MMP1 polyclonal antibody (1:1,000) and a cofilin polyclonal antibody (1:6,000). After three washes with Tris-buffered saline containing 0.1% Tween-20, membranes were incubated with horseradish peroxidase-conjugated goat anti-rabbit immunoglobulin G (IgG) (1:5,000) for 1 h at room temperature. Protein bands were visualized using an enhanced chemiluminescent substrate and imaged with a chemiluminescence imaging system using the associated operating software (version 1.2.0), as recorded in the image metadata. Bands were quantified using ImageJ software. Cofilin was used as the loading control, and MMP1 protein abundance was normalized to cofilin for between-group comparison.
Statistical analysis and software
All tests were two-sided unless otherwise stated. BH-adjusted p < 0.05 was used as the primary multiple-testing threshold. Exact sample sizes varied by dataset and, for the single-cell sample-level analysis, by the presence of a given cell type in each sample. Continuous expression summaries are shown as individual observations with boxplots displaying the median and interquartile range; whiskers extend to 1.5 times the interquartile range. For western blotting, the six recovered MMP1-to-cofilin ratios were analyzed using a two-sided paired t-test on three author-confirmed patient pairs (df = 2; p = 0.0107). For qPCR, five ACTB and five MMP1 Cq values were averaged separately within each specimen before ΔCq calculation. A two-sided paired t-test compared DFU and matched periwound ΔCq values across four author-confirmed patient pairs (df = 3; p = 3.04 × 10⁻⁵). The mean periwound ΔCq was used as the common calibrator for the relative-expression display. The geometric mean within-patient fold change and its 95% CI were obtained by back-transforming the mean paired ΔCq difference and its t-based CI. Individual biological observations are shown with lines joining matched tissues; technical wells do not increase the biological sample size. Tissue-assay p values are nominal and exploratory. With three or four patients, normality of paired differences cannot be assessed reliably, and the assays remain preliminary. Bioinformatic analyses and figure generation were performed in R 4.5.2 on Windows 11. Core package versions included DESeq2 1.48.2, WGCNA 1.74, glmnet 5.0, randomForest 4.7-1.2, e1071 1.7-17, pROC 1.19.0.1, clusterProfiler 4.16.0, Seurat 5.5.0, SingleR 2.10.0, rentrez 1.2.4, and ggplot2 4.0.3. A consolidated software, database, and parameter inventory is provided in Supplementary Table 1.
结果
发现转录组学鉴定出与糖尿病足溃疡广泛相关的表达程序
GSE199939 作为发现队列,包含 10 个糖尿病足溃疡(DFU)样本和 11 个对照样本(图 1A)。基于 VST 标准化表达值的主成分分析显示明显的组间分离;第一和第二主成分分别解释了总方差的 34.8% 和 15.1%(图 1B)。
采用 |log2 差异倍数| > 1 且经 BH 校正的 p < 0.05 为标准,差异表达分析共鉴定出 3,691 个差异表达基因(DEGs),其中包括在糖尿病足溃疡(DFU)中上调的 1,247 个基因和下调的 2,444 个基因(图 1C)。前 50 个差异表达基因呈现出明显的分组结构化表达模式(图 1D)。在后续选定的六个基因中,MMP1 在发现队列中的变化幅度最大(log2 差异倍数 = 9.854;校正后 p = 1.24 × 10⁻²⁹)。
一个与糖尿病足溃疡相关的共表达模块与差异表达基因及糖尿病性周围神经病变相关基因相汇聚
对变异程度最高的5,000个经VST变换的基因进行了WGCNA分析。对于有符号网络,选择18作为软阈值幂指数,以平衡无标度拓扑结构的拟合度与连接度(图2A)。通过层次聚类和动态模块检测,鉴定了多个共表达模块(图2B)。其中,蓝色模块与糖尿病足溃疡(DFU)的正相关性最强(Pearson r = 0.97,p = 5 × 10-13;图2C)。相应的样本聚类和模块大小质量控制结果汇总见补充图1A、B。
在蓝色模块中,共有689个基因满足中心基因标准 |MM| > 0.8 且 |GS| > 0.5(图2D)。将3,691个差异表达基因、689个蓝色模块中心基因以及1,062个DPN相关基因取交集,得到77个共有的候选基因(图2E)。蓝色模块中心网络的稀疏化视图及排名最高的中心性统计结果如补充图2A,B所示。
多方法特征筛选优先选出六个基因,但显示出发现队列的过拟合现象
对77个交集基因采用LASSO、随机森林和SVM-RFE方法进行分析。在选定的惩罚参数下,LASSO保留了7个基因:MMP1、MMP13、TRPV2、CCL7、AURKA、MKI67 和 CHEK1(图3A)。随机森林筛选保留了41个重要性等于或高于平均值的基因,其中最终基因组合中有5个基因位于重要性排名最高的特征之中(图3B)。SVM-RFE在每一轮评估的嵌套子集中均获得1.00的AUC值;根据最小尺寸平局规则,CHEK1被选为单基因子集(图3C),这提示在发现队列中可能存在过拟合及评估结果过于乐观的问题。相应的发现队列表达值、热图及ROC曲线展示于补充图3A–C中。
没有基因被全部三种方法同时选中。保留至少被两种方法支持的基因,得到 CCL7, CHEK1, MKI67, MMP1, MMP13,以及 TRPV2 (图3D)。这六个基因的GO注释强调了细胞外基质分解、胶原蛋白分解与代谢过程、浓缩染色体以及金属内肽酶相关功能(均经BH校正) p < 0.05; 图3E)。KEGG 分析鉴定出白细胞介素-17(IL-17)信号通路(CCL7/MMP1/MMP13;调整 p = 1.81 × 10⁻⁴)和松弛素信号传导(MMP1/MMP13;调整 p = 0.0175; 图3F这些富集结果被用于表征六基因面板所代表的生物学功能。
跨数据集评估显示 MMP1 的支持证据具有异质性
在合并的GSE68183/GSE80178矩阵(9个糖尿病足溃疡样本和6个对照样本)中,经BH校正后,六种基因中有三种基因在组间差异具有统计学意义,分别为CCL7、MMP1和MMP13(校正后的p值分别为0.0168、0.0159和0.0431;图4A)。而CHEK1、MKI67和TRPV2未达到校正后的显著性阈值(校正后的p值分别为0.259、0.680和0.259)。单基因ROC分析显示,CCL7的AUC为0.944(95% CI:0.825–1.000),CHEK1为0.704(0.403–1.000),MKI67为0.574(0.243–0.905),MMP1为0.981(0.930–1.000),MMP13为0.870(0.686–1.000),TRPV2为0.722(0.447–0.997;图4B)。由于上游的合并与批次校正流程尚未完全记录,这些ROC结果被视为探索性分析。
在GSE134431数据集(13个糖尿病足溃疡样本和8个非溃疡性糖尿病足样本)中,Wilcoxon检验显示,MMP1 在糖尿病足溃疡样本中的表达水平高于非溃疡性糖尿病足样本,差异具有名义显著性(p = 0.0225),但经BH校正后该差异不再显著(校正后 p = 0.135;图4C)。其余五个基因在两组之间均未显示出显著差异。MMP1 的描述性AUC值也最高,为0.808(95% CI,0.589–1.000),而其他候选基因的AUC值介于0.529至0.635之间(图4D)。总体而言,在六个候选基因中,MMP1 表现出最一致的描述性模式,但统计学上的重复验证尚不充分。
单细胞分析将 MMP1 主要定位于成纤维细胞
单细胞数据集包含来自24个样本(14个糖尿病足溃疡样本和10个对照样本)的69,944个细胞,共注释出10种细胞类型(图5A)。UMAP特征可视化显示,MMP1的表达局限于特定的细胞区域,而非在整个图谱中均匀分布(图5B)。总体而言,共有3,799个细胞(占5.43%)的标准化MMP1表达水平大于零。成纤维细胞的平均标准化表达水平最高(0.181),且MMP1阳性细胞比例最大(7.88%;图5C)。
在样本水平上,与对照样本相比,DFU 样本中角质形成细胞、成纤维细胞和内皮细胞的 MMP1 平均表达水平更高。在对所有检测的细胞类型进行 BH 校正后,上述每项比较的校正后 p 值均为 0.0214(角质形成细胞:9 个对照和 14 个 DFU 样本;成纤维细胞:10 和 14;内皮细胞:10 和 14;图 5D)。MMP1 阳性细胞比例在成纤维细胞中从 5.86% 增加至 9.29%,在角质形成细胞中从 0.026% 增加至 6.68%,在内皮细胞中从 0.29% 增加至 2.67%(图 5E)。
单细胞模块评分相关性较弱。其中,衰老/衰老相关分泌表型(SASP)模块评分的正相关性最强(Spearman rho = 0.274),其次为细胞外基质重塑(rho = 0.240)、铁死亡(rho = 0.197)和成纤维细胞活化(rho = 0.170; 图 5F)。比较 MMP1高和 MMP1-低纤维细胞显示出在细胞外基质组织、细胞外结构组织、胶原纤维组织、糖蛋白加工及蛋白质折叠相关术语中的富集(图 5G。这些描述性发现关联了 MMP1-高成纤维细胞状态与基质重塑相关过程。附加的群体水平UMAP、全细胞类型样本汇总及功能评分背景信息见于 补充图 4A–C单个细胞的关联未被视为独立于供体的证据。
网络覆盖优先选择与 MMP1 相关的成分及候选草药
筛选后的草药-成分-靶点关系表包含561条唯一记录,关联了99种草药、14种成分以及6个候选靶点中的5个。MMP1是最常见的靶点,有156条记录,其次是CHEK1(120条)、MMP13(102条)、MKI67(100条)和TRPV2(83条;图6A)。在成分中,槲皮素和木犀草素覆盖的草药范围最广,分别与83种和62种草药相关联。小檗碱与10种草药相关联;这三种成分为优先排序规则中的核心成分(图6B)。
覆盖度评分显示,贯黄柏、麻黄和牛膝并列最高(评分均为38;图6C)。这三种药材均覆盖了全部5个可及靶点,并各自含有两种与MMP1相关的成分。成分-靶点矩阵显示,槲皮素在所有靶点中覆盖范围最广,而木犀草素和小檗碱则提供了额外的以MMP1为核心的连接性(图6D)。一个聚焦的网络图展示了主要药材与其代表性成分及5个可及靶点之间的关联(图6E)。这些结果鉴定出具有高数据库覆盖率的药-效-靶组合,可用于进一步评估。支持性的药-靶及核心成分覆盖矩阵见补充图5A,B。
初步的配对组织检测显示 MMP1 mRNA 和蛋白质丰度更高
Western blot 检测显示,与配对的非溃疡周围组织标本相比,糖尿病足溃疡(DFU)标本中 MMP1 的丰度更高(图 7A、B)。这三对配对样本中,DFU 与周围组织之间 MMP1/cofilin 比值的平均差值为 0.3553(95% CI,0.1959–0.5147;双侧配对 t-检验,t(2) = 9.592,p = 0.0107)。每位患者的配对测量结果如 图 7B 所示。对每个标本每基因五个技术重复孔取均值后,qPCR 结果显示,在四个 DFU 标本中,每个标本的标准化 MMP1 mRNA 丰度均高于其配对的周围组织标本(图 7C)。患者内部 DFU 与周围组织之间 ΔCq 的平均差值为 −2.6035(95% CI,−2.8024 至 −2.4046;双侧配对 t-检验,t(3) = −41.663,p = 3.04 × 10⁻⁵),相当于几何平均值升高 6.08 倍(95% CI,5.30–6.98)。这些小样本观察结果属于初步发现,尚不能确立其功能效应。
在发现集和外部大规模数据集中 MMP1 在六种优先基因中,MMP1 具有最一致的描述模式,尽管统计学上的重复验证尚不完整。单细胞汇总结果显示,成纤维细胞中的平均表达量最高,来自三名患者的配对 WB 测量以及来自四名患者的配对 qPCR 测量均显示 MMP1 表达水平较高。这些发现支持将 MMP1 作为与糖尿病足溃疡(DFU)相关、值得进一步研究的候选基因。整体从计算到组织评估的工作流程总结如下 补充图6.
数据可用性:
公共转录组数据集可从 NCBI 基因表达综合数据库(Gene Expression Omnibus)获取,登录号分别为 GSE199939、GSE68183、GSE80178、GSE134431 和 GSE165816。可用的分析与图表生成脚本、处理后的表达数据与结果表格、定量图表的源数据表、统计输出表格、原始 qPCR 工作簿及仪器项目文件,以及提供的未裁剪的 Western blot 图像均包含在补充文件 1中。该存档还包括从恢复的单细胞对象中提取的细胞元数据和命令历史记录、矩阵类型验证报告以及文件清单。补充文件 1保留了历史源文件,并包含一个 R2_Updates 文件夹,其中含有修订后的配对检测源数据表、统计输出结果、图表生成代码以及更正后的参数清单。完整分析后的 Seurat RDS 文件已在存档文档中注明,但未嵌入本补充 ZIP 文件中。完整的批量合并历史记录、原始单细胞过滤与注释设置,以及原始 blot 图像背景扣除和条带定量的详细信息并未完全提供;这些局限性已在实验方案与讨论部分中说明。本地恢复的 RDS 文件尚未提交至公共数据库。
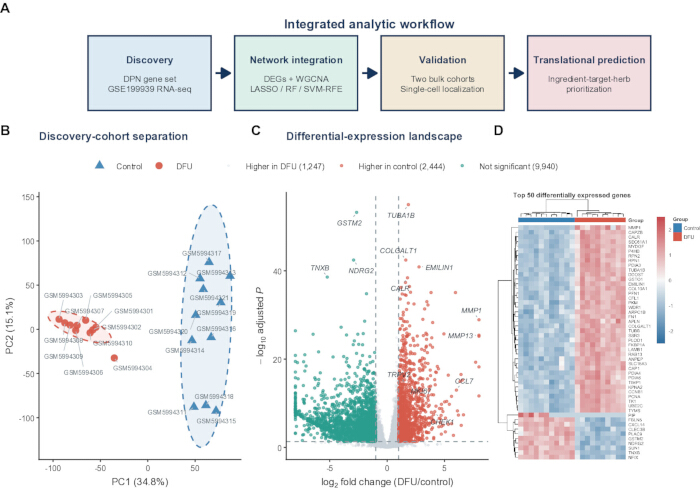
图1:发现性转录组学鉴定出与糖尿病足溃疡相关的基因表达程序。(A)计算工作流程概览,包括DPN基因集构建和GSE199939发现性分析、网络与机器学习整合、批量及单细胞评估,以及中药成分-靶点-药材预测。(B)基于10例糖尿病足溃疡样本和11例对照样本的GSE199939数据集经方差稳定化处理后的表达谱主成分分析。椭圆表示90%置信区域;百分比表示各主成分解释的方差比例。(C)使用DESeq2分析糖尿病足溃疡组与对照组之间差异表达的结果火山图。红色和青色点分别表示在糖尿病足溃疡组和对照组中上调的基因,筛选标准为|log2倍数变化| > 1且经BH校正的p < 0.05;灰色点未同时满足两个阈值。(D)按调整后p值最小的50个基因进行行标准化z分数热图展示。列为生物学样本,上方注释条表示分组信息。DEGs,差异表达基因;DFU,糖尿病足溃疡;DPN,糖尿病周围神经病变;VST,方差稳定化转换。最终的实验验证部分在实验方案及图7中描述。qPCR,定量聚合酶链式反应;TCM,传统中医;RF,随机森林;LASSO,最小绝对收缩与选择算子;SVM-RFE,支持向量机递归特征消除。请点击此处查看该图的放大版本。
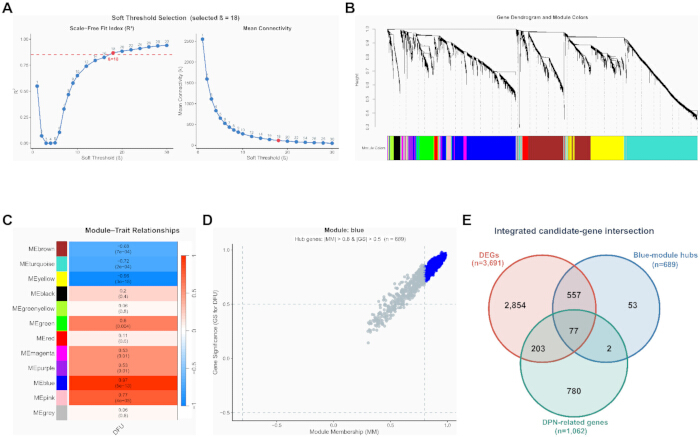
图2:WGCNA 与先前的 DPN 知识共同确定出 77 个候选基因。(A)针对 5,000 个变异度最高的经 VST 转换基因的加权网络软阈值评估。选定的幂参数为 beta = 18;虚线表示目标无尺度拓扑拟合值 0.85。(B)采用动态模块着色法的平均连接基因系统聚类树状图。(C)各模块特征基因与二分类 DFU 性状之间的 Pearson 相关性。每个单元格显示相关系数及相应的双侧 p 值;颜色表示相关性的方向和强度。(D)DFU 基因显著性与蓝色模块中模块成员关系的散点图。蓝色数据点满足 |模块成员关系| > 0.8 且 |基因显著性| > 0.5;n = 689 个枢纽基因。(E)3,691 个差异表达基因、689 个蓝色模块枢纽基因和 1,062 个 DPN 相关基因三者交集,共获得 77 个共有候选基因。DFU,糖尿病足溃疡;DPN,糖尿病周围神经病变;GS,基因显著性;MM,模块成员关系;WGCNA,加权基因共表达网络分析。发现队列包含 21 个样本(10 个 DFU 样本和 11 个对照样本)。图2D 的注释采用 |MM| > 0.8 和 |GS| > 0.5 的标准,与原始筛选代码中验证的绝对值筛选条件一致。请点击此处查看该图的高清版本。
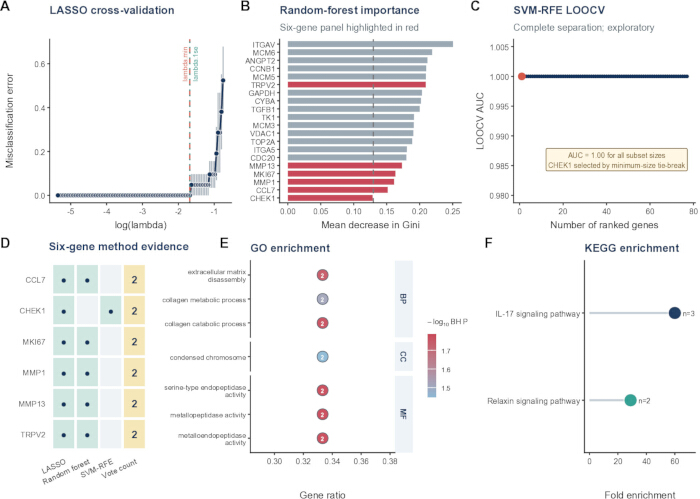
图3多方法特征优先级排序获得一个六基因组合 (A) 二项 LASSO 回归的五折交叉验证曲线。垂直虚线表示 lambda.min 和 lambda.1se;所选非零特征在 lambda.1se 处确定,除非该惩罚值未筛选出任何特征。B) 基于1,000棵树模型得出的排名前20位基因的随机森林吉尼指数平均下降值。红色条形表示最终六基因组合中的成员;虚线表示在整个候选基因集中用作保留阈值的平均重要性水平。C) 嵌套特征子集上的线性 SVM-RFE LOOCV AUC。所有子集大小均产生 AUC = 1.00; CHEK1 由最小尺寸关联规则选出,表明在发现队列中存在过拟合。D) 方法支持矩阵 CCL7, CHEK1, MKI67, MMP1, MMP13,以及 TRPV2. 圆点表示由LASSO、随机森林或SVM-RFE方法选出的变量;最后一列表示支持该变量的方法数量。E) 六个基因中富集的精选基因本体(Gene Ontology)术语。点的位置表示基因比例,点的标签表示比对上的基因数量,颜色表示 -log10 BH校正 p,侧边条带表示本体。F) 映射基因富集的 KEGG 通路。点的位置表示富集倍数,点的大小表示映射基因数量,颜色用于区分不同通路。富集分析要求名义显著性 p < 0.05 和 BH 调整后 p < 0.05。AUC,受试者工作特征曲线下面积;BH,Benjamini-Hochberg;BP,生物过程;CC,细胞组分;KEGG,京都基因与基因组百科全书;LOOCV,留一法交叉验证;MF,分子功能;SVM-RFE,支持向量机递归特征消除。LASSO,最小绝对收缩与选择算子。图A–D使用21例发现样本(10例糖尿病足溃疡和11例对照)。图A中,误差棒表示交叉验证误差的标准误。 请点击此处以查看此图的放大版本。
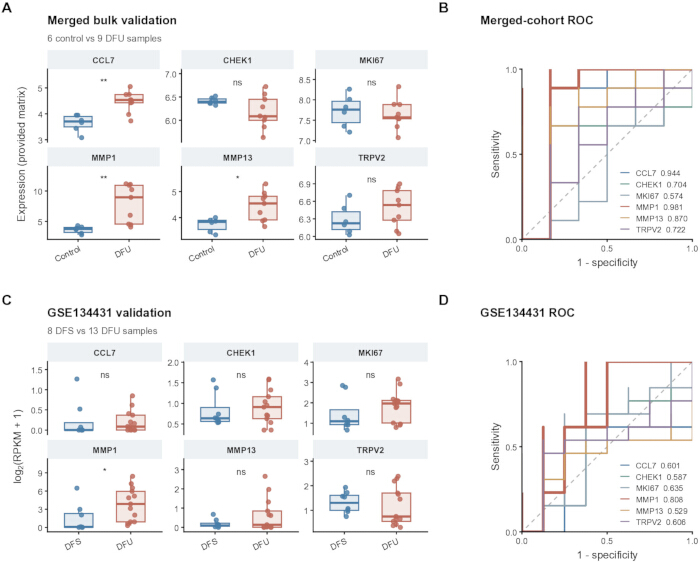
图4:六基因面板的跨数据集批量转录组评估。(A)在合并的 GSE68183/GSE80178 矩阵中六个基因的表达情况(6 个对照样本和 9 个糖尿病足溃疡(DFU)样本)。(B)相应的单基因 ROC 曲线及其 AUC 值;95% 置信区间见源数据表。由于上游合并和批次校正未完全记录,这些结果被解释为探索性分析。(C)GSE134431 中 log2(RPKM + 1) 的表达水平(8 个非溃疡性糖尿病足皮肤(DFS)样本和 13 个 DFU 样本)。(D)相应的单基因 ROC 曲线和 AUC 值。在(A)和(C)中,箱线图显示中位数和四分位距,须线延伸至 1.5 倍四分位距,点代表生物学样本。星号表示双侧 Wilcoxon 秩和检验的名义显著性(*p < 0.05,**p < 0.01);六基因的 BH 校正后 p 值在正文和源数据表中均有报告。ROC 方向由 pROC 自动选择。AUC,受试者工作特征曲线下面积;DFS,非溃疡性糖尿病足皮肤;DFU,糖尿病足溃疡;RPKM,每百万比对读段中每千碱基的读段数;ROC,受试者工作特征。 请点击此处查看此图的放大版本。
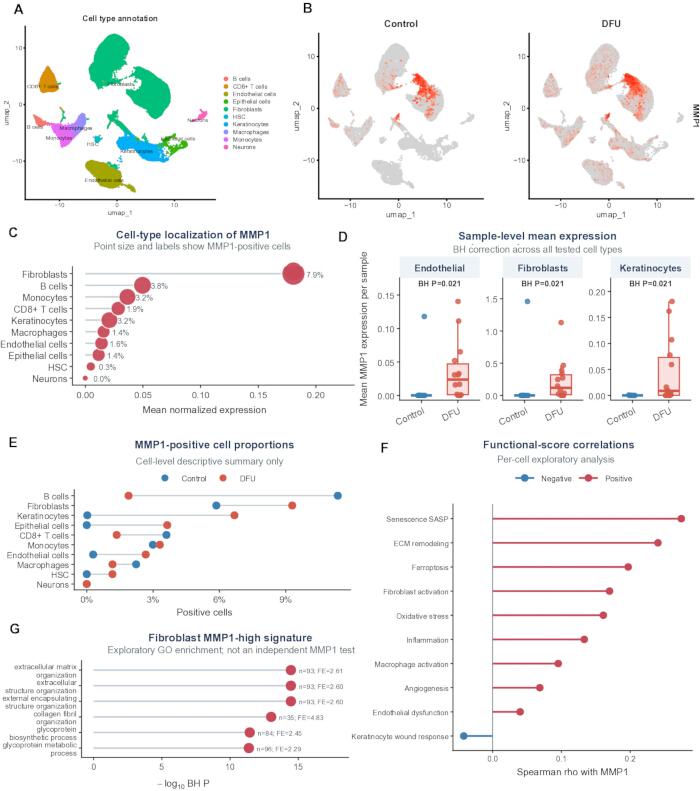
图5:单细胞定位链接 MMP1 对成纤维细胞和基质重塑信号 (A24个样本(10个对照样本和14个糖尿病足溃疡样本)共69,944个细胞的UMAP图,按SingleR推导的10种细胞类型注释着色。BUMAP特征图显示归一化后的 MMP1 对照细胞和DFU细胞中的表达。 (C细胞类型平均归一化总结 MMP1 表达;点的大小和标签表示总体 MMP1阳性组分,定义为标准化表达水平 > 0. (D样本水平均值 MMP1 内皮细胞、成纤维细胞和角质形成细胞中的表达。方框表示中位数和四分位距;点代表生物学样本。对所有检测的细胞类型进行双侧Wilcoxon秩和检验,并采用BH校正。可用样本数为:内皮细胞和成纤维细胞中10例对照和14例DFU,角质形成细胞中9例对照和14例DFU。E) MMP1-阳性细胞组分按组别和细胞类型。 (F单细胞Spearman相关性 MMP1 表达和功能模块评分。G) 上调基因的 GO 生物学过程富集分析 MMP1高剂量与 MMP1-低成纤维细胞。BH,Benjamini-Hochberg;DFU,糖尿病足溃疡;ECM,细胞外基质;GO,基因本体论;HSC,造血干细胞;UMAP,均匀流形近似与投影。图F和G中基于单细胞的相关性分析及表达条件化富集分析为探索性描述,未进行考虑供体信息的验证性推断。样本水平的独立性需通过供体标识符的验证加以确认。 请点击此处以查看此图的放大版本。
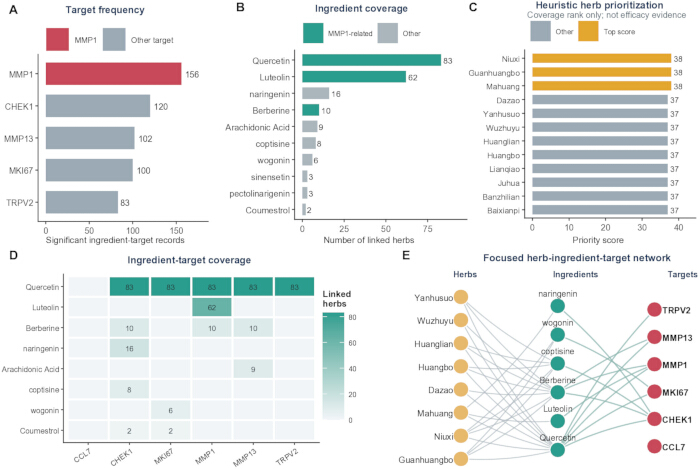
图6:以 MMP1 为核心的基于覆盖率的中药成分-靶点-药材预测。(A)各候选靶点对应的筛选后数据库中药材-成分-靶点记录数量。(B)与最常见成分相关联的药材数量;青绿色表示与 MMP1 相关联的成分。(C)按覆盖率评分排序的主要药材;金色柱状图表示三个并列最高分。(D)代表性高覆盖率成分的成分-靶点矩阵。单元格数值表示相关联的药材数量;空白单元格表示在筛选后的关联表中无记录。(E)连接代表性高排名药材、成分及候选靶点的聚焦网络。节点颜色表示实体类型;灰色的药材-成分边表示包含关系,青绿色的成分-靶点边表示数据库中的关联。筛选后的关联表包含 561 条唯一记录、99 种药材、14 种成分和 5 个具有合格关联的靶点;CCL7 作为孤立的第六个候选节点显示。TCM,传统 Chinese medicine。 请点击此处查看该图的放大版本。
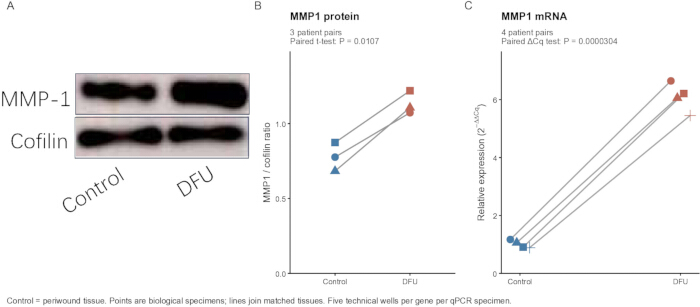
图7:DFU患者组织中MMP1表达的qPCR与蛋白质印迹初步评估。(A)先前提供的代表性蛋白质印迹图,显示非溃疡性周围组织与DFU组织中MMP1蛋白的丰度,以cofilin作为上样对照。(B)从原始作图项目中提取的MMP1与cofilin的比值。符号表示来自三对患者的独立生物学测量值;连线连接配对的周围组织与DFU样本。双侧配对t检验结果为t(2) = 9.592,p = 0.0107。(C)四位经作者确认的配对患者中MMP1 mRNA的相对丰度:NC–DFU、NC1–DFU1、NC2–DFU2 和 NC3–DFU3。每个样本中分别对五个技术重复的ACTB孔和五个技术重复的MMP1孔取平均值,再进行ΔCq计算。相对表达量采用2−ΔΔCq法计算,以周围组织ΔCq的均值作为共同校准品。每个符号代表一个生物学样本;连线连接配对组织。双侧配对t检验使用样本水平的ΔCq值(t(3) = −41.663;p = 3.04 × 10⁻⁵),而非技术孔的倍数变化。未使用显著性星号标记。技术重复孔不属于生物学重复。Control表示非溃疡性周围组织。Cq,定量循环。组织-检测的p值为名义值,仅用于探索性分析。请点击此处查看此图的放大版本。
| 基因 | RefSeq 编号 | 正向引物 5′ 至 3′ | 反向引物 5′ 至 3′ |
| MMP1 | NM_002421 | ATGAAGCAGCCCAGATGTGGAG | TGGTCCACATCTGCTCTTGGCA |
| ACTB | NM_001101.5 | CACCATTGGCAATGAGCGGTTC | AGGTCTTTGCGGATGTCCACGT |
表1:用于验证MMP1的定量PCR引物序列。列出人MMP1(NM_002421)和ACTB(NM_001101.5)的正向与反向寡核苷酸序列(5′–3′)以及NCBI RefSeq转录本登录号。ACTB(β-actin)用作MMP1相对表达的参考基因。
补充图1:WGCNA质量控制摘要。(A)基于5000个变异程度最高的方差稳定化基因,对GSE199939样本进行平均连接层次聚类。样本标签按组着色;虚线水平线表示用于视觉评估离群值的第95百分位数树状图高度参考线。(B)分配至各WGCNA模块的基因数量。青色条形表示满足糖尿病足溃疡(DFU)关联标准的八个非灰色模块;灰色条形表示其他模块。DFU,糖尿病足溃疡;VST,方差稳定化转换;WGCNA,加权基因共表达网络分析。 请点击此处下载该文件。
补充图 2:蓝色模块共表达支持。(A)25 个排名最高的蓝色模块枢纽基因的简化共表达网络。在两两相关性 |r| > 0.70 的条件下,所显示的网络包含每个基因的两个最强连接的并集。节点大小表示该节点在此显示的稀疏化网络中的连接度,节点填充颜色表示基因对糖尿病足溃疡的基因显著性。(B)15 个排名最高的枢纽基因的基因显著性与蓝色模块成员关系。边的子集经选择以提高可读性,并不代表所有符合条件的相关性。DFU,糖尿病足溃疡;GS,基因显著性;MM,模块成员关系。 请点击此处下载该文件。
补充图3:内部发现队列的机器学习结果展示。(A)GSE199939发现队列中CCL7、CHEK1、MKI67、MMP1、MMP13和TRPV2的标准化表达水平。方框表示中位数和四分位间距,点代表生物学样本。(B)相同六个基因的样本水平行z分数热图。简写的样本标签已在源数据密钥中映射为GEO编号。(C)拟合的多基因发现队列模型的ROC曲线。该模型在相同的21个样本上进行拟合与评估,得到的AUC为1.00,表明在发现队列中存在过拟合现象。AUC,受试者工作特征曲线下面积;ROC,受试者工作特征曲线。发现队列共包含21个样本(10个DFU样本和11个对照样本)。 请点击此处下载该文件。
补充图4:单细胞表达背景。(A)69,944个细胞的UMAP图,按对照组和糖尿病足溃疡组着色。(B)在全部10种注释细胞类型中,生物学样本水平的MMP1平均表达量;点代表样本,横轴采用平方根变换以优化显示效果。(C)热图显示各注释细胞类型内细胞的功能模块评分汇总结果,每个模块内已进行标准化处理。DFU,糖尿病足溃疡;UMAP,均匀流形近似与投影。 请点击此处下载该文件。
补充图5:中医药(TCM)覆盖矩阵的支持数据。(A)在筛选后的关联表中,与MMP1相关覆盖度排名前18的中药及其所含的5个候选靶点的数据库草药-靶点记录数。(B)相同草药与核心成分槲皮素(quercetin)、木犀草素(luteolin)和小檗碱(berberine)在数据库中的记录数。单元格数值表示去重后的唯一数据库记录数。TCM,传统中医药。 请点击此处下载该文件。
补充图6:计算与组织评估工作流程。 该示意图总结了发现阶段的输入数据、差异表达基因(DEG)与WGCNA交集分析、探索性特征筛选、外部批量评估、单细胞背景信息、TCM扩展分析以及匹配的组织表达评估。qPCR使用了四对匹配的患者样本,Western blotting使用了三对匹配的患者样本。候选基因数量及报告的计算结果均来自原始分析。基于计数的发现工作流程中TPM数据的输入、原始单细胞预处理记录不完整以及组织检测队列样本量较小仍是当前的局限性。该示意图并不表示发现阶段的分析已重新验证。 请点击此处下载该文件。
补充表 1:分析软件、数据库、参数及局限性清单。本工作簿记录了 26 个分析步骤,包括分析步骤、工具或数据库、报告版本、输入、主要参数、输出以及缺失信息或局限性。内容涵盖发现性转录组学、WGCNA、基因筛选与特征选择、富集分析、外部批量与单细胞分析、中医网络分析以及组织实验报告。该表格记录了可用的方法学信息,但其本身并不构成独立的可重复性验证。 请点击此处下载该文件。
补充文件 1:数据、分析代码、图表源文件和检测源文件归档包。该归档包含可用的分析和图表生成脚本、已处理的表达数据与结果表格、定量图表及统计源数据、原始 qPCR 工作簿和仪器项目、提供的未裁剪 Western blot 图像、提取的单细胞元数据与命令历史记录、矩阵类型验证报告以及一个文件清单。历史文件已保留;R2_Updates 文件夹提供了校正后的配对检测分析结果、更新的图表源文件以及修订后的参数清单。 请点击此处下载该文件
讨论
该整合性工作流程结合批量转录组学、WGCNA、与DPN相关的基因筛选及探索性特征选择,优先筛选出MMP1,并进一步分析其细胞背景和组织表达情况。共有六个基因得到至少两种筛选方法的支持,其中MMP1在发现队列中的表达变化最为显著。外部证据呈现异质性:MMP1在合并的GSE68183/GSE80178数据矩阵中仍具显著性,而在GSE134431中的关联仅为名义显著(p = 0.0225),且经BH校正后不再显著(校正后p = 0.135)。GSE134431中AUC为0.808,此结果仅为描述性指标,尤其因为ROC曲线的方向是在评估数据集中选定的。因此,“最一致”一词仅描述了在六个候选基因中观察到的模式,并不意味着完全的统计重复验证或已确认的诊断生物标志物。
候选基因面板注释涉及胶原周转、细胞外基质降解、金属内肽酶活性以及IL-17和松弛素信号通路。这些注释与慢性伤口生物学相一致,但仅涉及少数基因。早期的人体研究报道了糖尿病伤口中基质金属蛋白酶(MMP)及其抑制剂谱的改变6,而一项前瞻性糖尿病足溃疡(DFU)研究发现,MMP1与金属蛋白酶组织抑制因子1(TIMP1)的比值较高与伤口愈合相关7。因此,MMP1表达升高并不一定意味着具有普遍的有害作用;其作用可能取决于修复阶段、底物可及性以及抑制因子的平衡状态。关于MMP13、CCL7和IL-17的实验观察提供了进一步的背景信息11,12,13,14,但不能假设它们在人类DFU中的功能完全相同。
单细胞汇总结果显示最高平均值的定位 MMP1 在DFU成纤维细胞、角质形成细胞和内皮细胞中,该基因在样本水平上的表达更高。这一模式与已有报道中关于DFU来源成纤维细胞ECM结构改变的发现一致4单细胞与空间研究中异质性的成纤维细胞状态8以及巨噬细胞相关愈合成纤维细胞程序15然而,样本标识符需要在供体水平上进行验证,且由于未对供体内部的依赖性进行建模,细胞水平的模块评分相关性及表达条件化富集分析仍仅为描述性结果。上皮和内皮细胞群体的贡献也提示该机制并非完全由成纤维细胞自主驱动。空间转录组学、RNA 原位 杂交或免疫染色可提供互补的定位信息16.
该方法学的价值在于整合差异表达、共表达、先验基因知识、单细胞分辨率的汇总分析以及独立的检测手段,以优先筛选候选基因,而非在于发现队列中的预测准确性。队列范围内的筛选早于算法层面的交叉验证,且统一的SVM-RFE AUC值为1.00,提示可能存在数据泄露、过拟合及评估结果过于乐观的问题。因此,该结果应被视为特征优先排序的结果。若要进行预测性能的评估,需采用完全嵌套的预处理、特征选择与参数调优流程,并随后进行锁定的独立测试9,10。尽管发现阶段的输入数据被验证为TPM值,但其被用于基于计数的模型中,因此所得的发现统计量及后续的特征选择结果在经过适当的重新分析前仍属未经验证。合并的批量表达矩阵缺乏完整的预处理记录。所恢复的Seurat对象提供了归一化、高变特征选择、PCA、邻近细胞计算、聚类及UMAP降维等参数设置,但其原始的过滤步骤、完整的Harmony调用过程以及注释参考信息仍记录不全。从原始数据出发进行标准化的重新处理、记录完整的批次效应评估,以及采用考虑供体信息的伪批量或混合模型分析,是进一步评估的替代性策略。
患者组织检测提供了MMP1丰度较高的初步正交证据。对照样本为同一患者非溃疡周围组织,因此该对比反映的是糖尿病组织内与溃疡相关的局部差异,而非与健康皮肤的比较。对三对匹配患者样本的WB检测结果以及四位作者确认的四对匹配患者样本的qPCR检测结果采用配对检验进行分析,并展示了各个生物学重复的观测值。对于qPCR,每个样本内的技术重复孔取均值后用于ΔCq分析;技术重复未扩大生物学样本量。配对观测结果方向一致,支持进行初步的表达量比较,但由于样本量较小,无法确立结论的普适性或可靠评估分布假设。批量组织的丰度检测无法确定蛋白的细胞定位、酶活性或对愈合的因果作用。需要更大规模且临床特征明确的队列研究。其他局限性包括临床协变量信息不全、对照组织类型不同、从文献获取的DPN基因集记录不完整,以及原始蛋白印迹背景扣除记录不完整。健康组织、本研究定义的对照组织与非溃疡性糖尿病足皮肤不应视为可互换。
TCM 网络是一种用于生成假设的扩展工具。其自定义权重总结的是数据库覆盖范围,而非靶点结合或药效,因此排序结果可能随数据库内容和权重选择而变化。槲皮素和小檗碱的全身暴露水平也存在变异或受限情况17,18。因此,候选成分和草药需要进行直接的靶点验证、剂量-反应关系、药代动力学、毒性及功能测试。未来的研究应结合记录完整的独立队列,联合原代成纤维细胞或多种细胞参与的伤口模型中的空间定位及 MMP1 扰动分析。当前研究结果支持 MMP1 在以成纤维细胞为中心的基质重塑背景下,作为糖尿病足溃疡相关候选因子的作用,但并未确立其因果关系或临床应用价值。
披露
作者声明无利益冲突。
致谢
本研究由武汉市卫生健康委员会管理的武汉市医学科研项目(指导项目,项目编号:WX23Z77)资助。
作者感谢为本研究提供组织样本的参与者,以及在 NCBI 基因表达综合数据库中生成并公开 deposited 数据集的研究人员。
材料
| 姓名 | 公司 | 目录编号 | 评论 |
|---|---|---|---|
| 0.2 mL 薄壁透明 PCR 8 管排 | Axygen / Corning | PCR-0208-C | URL: https://ecatalog.corning.com/life-sciences/b2b/TW/en/Genomics-%26-Molecular-Biology/PCR-Consumables/PCR-Tubes-and-Strip-Tubes/Axygen%C2%AE-PCR-Strip-Tubes/p/PCR-0208-C |
| 1,000-μL 无菌滤芯移液器吸头 | Axygen / Corning | TF-1000-R-S | URL: https://ecatalog.corning.com/life-sciences/b2b/SEA/en/Liquid-Handling/Pipette-Tips-and-Accessories/Pipette-Tips/Axygen%C2%AE-Universal-Fit-Filter-Pipette-Tips/p/TF-1000-R-S |
| 1.5 mL 无菌微量离心管,无 DNase/RNase | Solarbio Life Sciences | YA0430 | URL: https://www.solarbio.com/goodsInfo?id=305429 |
| 10-μL 无菌滤芯移液器吸头 | Axygen / Corning | TF-300-L-R-S | URL: https://ecatalog.corning.com/life-sciences/b2b/CALAOther/en/Liquid-Handling/Pipette-Tips-and-Accessories/Pipette-Tips/Axygen%C2%AE-Aerosol-Barrier-Tips/p/TF-300-L-R-S |
| 2× SYBR Green PCR 主混合液 | Solarbio Life Sciences | SR1110 | URL: https://www.solarbio.com/goodsInfo?id=994 |
| 20× Tris 缓冲盐溶液 | Solarbio Life Sciences | T1080 | URL: https://www.solarbio.com/goodsInfo?id=1309 |
| 200-μL 无菌滤芯移液器吸头 | Axygen / Corning | TF-200-R-S | URL: https://ecatalog.corning.com/life-sciences/b2b/CALAOther/en/Liquid-Handling/Pipette-Tips-and-Accessories/Pipette-Tips/Axygen%C2%AE-Universal-Fit-Filter-Pipette-Tips/p/TF-200-R-S |
| ACTB qPCR 引物对 | Solarbio Life Sciences (定制寡核苷酸合成) | Custom | RefSeq NM_001101.5;F: CACCATTGGCAATGAGCGGTTC;R: AGGTCTTTGCGGATGTCCACGT;URL: https://www.solarbio.com/ |
| Amersham Imager 600 | GE Healthcare Bio-Sciences AB, Uppsala, Sweden | Amersham Imager 600 | 在全部 22 个提供的 TIFF 文件中记录了型号;操作软件版本 1.2.0;URL: https://cdn.cytivalifesciences.com/api/public/content/digi-17089-original |
| 双辛可宁酸蛋白检测试剂盒 | Solarbio Life Sciences | PC0020 | URL: https://www.solarbio.com/goodsInfo?id=64504 |
| clusterProfiler | Bioconductor | https://bioconductor.org/packages/clusterProfiler/ | 版本 4.16.0 |
| Cofilin 多克隆抗体(兔抗 Cofilin) | Proteintech Group (武汉三鹰生物技术有限公司,中国武汉) | 10960-1-AP | 本研究中用于 WB 的稀释比例:1:6,000;URL: https://www.ptgcn.com/;RRID:AB_2291830 |
| 比较毒理基因组学数据库 | CTD | https://ctdbase.org/ | 成分-靶点资源 |
| DESeq2 | Bioconductor | https://bioconductor.org/packages/DESeq2/ | 版本 1.48.2 |
| 无 DNase/RNase 水 | Solarbio Life Sciences | R1600 | URL: https://www.solarbio.com/goods.php?id=1085 |
| e1071 | CRAN / e1071 作者 | https://cran.r-project.org/package=e1071 | 版本 1.7-17 |
| ECL Plus 化学发光底物 | Solarbio Life Sciences | PE0010 | URL: https://www.solarbio.com/pdf/2-DBYMY/1-ZW/PE0010.pdf |
| 基因表达综合数据库:GSE134431 | 美国国家生物技术信息中心 | GSE134431 | URL: https://www.ncbi.nlm.nih.gov/geo/query/acc.cgi?acc=GSE134431 |
| 基因表达综合数据库:GSE165816 | 美国国家生物技术信息中心 | GSE165816 | URL: https://www.ncbi.nlm.nih.gov/geo/query/acc.cgi?acc=GSE165816 |
| 基因表达综合数据库:GSE199939 | 美国国家生物技术信息中心 | GSE199939 | URL: https://www.ncbi.nlm.nih.gov/geo/query/acc.cgi?acc=GSE199939 |
| 基因表达综合数据库:GSE68183 | 美国国家生物技术信息中心 | GSE68183 | URL: https://www.ncbi.nlm.nih.gov/geo/query/acc.cgi?acc=GSE68183 |
| 基因表达综合数据库:GSE80178 | 美国国家生物技术信息中心 | GSE80178 | URL: https://www.ncbi.nlm.nih.gov/geo/query/acc.cgi?acc=GSE80178 |
| 基因本体 | 基因本体联盟 | https://geneontology.org/ | GO |
| ggplot2 | ggplot2 开发者 | https://ggplot2.tidyverse.org/ | 版本 4.0.3 |
| glmnet | CRAN / glmnet 作者 | https://cran.r-project.org/package=glmnet | 版本 5.0 |
| 中药-成分参考表 | 论文中未报告来源 | 未报告 | 未记录:确切数据库/文件名、版本/日期及公开访问 URL |
| HRP 标记山羊抗兔 IgG(H+L) | Proteintech Group (武汉三鹰生物技术有限公司,中国武汉) | SA00001-2 | 本研究中用于 WB 的稀释比例:1:5,000;URL: https://www.ptgcn.com/products/HRP-conjugated-Goat-Anti-Rabbit-IgG-H-L-SA00001-2.htm;RRID:AB_2722564 |
| 人糖尿病足溃疡组织标本 | 中国武汉第四医院 | N/A | 患者配对的 DFU 标本;qPCR n=4 个标本;WB n=3 个标本;批准方案编号 KY2024-161-01 |
| 人非溃疡周围组织标本 | 中国武汉第四医院 | N/A | 患者配对的周围组织对照;qPCR n=4 个标本;WB n=3 个标本;批准方案编号 KY2024-161-01 |
| ImageJ | 美国国立卫生研究院 | https://imagej.net/ij/ | 版本未记录 |
| 京都基因与基因组百科全书 | KEGG | https://www.genome.jp/kegg/ | 人源生物代码 hsa |
| 文献整理的 DPN 基因列表 | 来源于文献;基因层面的来源表未完整记录 | 未报告 | 基因层面的来源未完整记录 |
| 微量紫外-可见分光光度计 | 论文中未报告制造商/型号 | 未报告 | 未记录:确切制造商、型号及产品 URL;报告用途:RNA 浓度及 A260/A280 检测 |
| MMP1 多克隆抗体(兔抗 MMP1) | Proteintech Group (武汉三鹰生物技术有限公司,中国武汉) | 10371-2-AP | 本研究中用于 WB 的稀释比例:1:1,000;URL: https://www.ptgcn.com/Products/MMP1-Antibody-10371-2-AP.htm;RRID:AB_2297741 |
| MMP1 qPCR 引物对 | Solarbio Life Sciences (定制寡核苷酸合成) | Custom | RefSeq NM_002421;F: ATGAAGCAGCCCAGATGTGGAG;R: TGGTCCACATCTGCTCTTGGCA;URL: https://www.solarbio.com/ |
| NCBI Gene | 美国国家生物技术信息中心 | https://www.ncbi.nlm.nih.gov/gene/ | 人类基因数据库 |
| 脱脂奶粉,封闭试剂 | Solarbio Life Sciences | D8340 | URL: https://www.solarbio.com/goodsInfo?id=1488 |
| org.Hs.eg.db | Bioconductor | https://bioconductor.org/packages/org.Hs.eg.db/ | 版本 3.21.0 |
| 预制 SDS-PAGE 凝胶,4%–20% 浓度梯度 | Solarbio Life Sciences | PG42010-S | URL: https://www.solarbio.com/goodsInfo?id=12646 |
| pROC | CRAN / pROC 作者 | https://cran.r-project.org/package=pROC | 版本 1.19.0.1 |
| 蛋白酶抑制剂混合物,100× | Solarbio Life Sciences | P6730 | URL: https://www.solarbio.com/goodsInfo?id=25748 |
| 蛋白质转移系统 | 论文中未报告制造商/型号 | 未报告 | 未记录:确切制造商、型号及产品 URL;报告用途:转移至 0.22-μm PVDF 膜 |
| PVDF 膜,0.22 μm | Solarbio Life Sciences | YA1690 | URL: https://www.solarbio.com/goodsInfo?id=228106 |
| R | R 统计计算基金会 | https://www.r-project.org/ | 版本 4.5.2 |
| randomForest | CRAN / randomForest 作者 | https://cran.r-project.org/package=randomForest | 版本 4.7-1.2 |
| 实时 PCR 仪 | Roche Diagnostics | LightCycler 96 | 软件版本未确认。项目体积/循环参数与报告方案不同;确切实验关联尚待核实。 |
| 制冷微量离心机 | 论文中未报告制造商/型号 | 未报告 | 未记录:确切制造商、型号及产品 URL;报告用途:4 °C 下 12,000 × g 离心 15 分钟 |
| rentrez | CRAN / rentrez 作者 | https://cran.r-project.org/package=rentrez | 版本 1.2.4 |
| RIPA 裂解缓冲液,高浓度 | Solarbio Life Sciences | R0010 | URL: https://www.solarbio.com/goodsInfo?id=1163 |
| SDS-PAGE 电泳系统 | 论文中未报告制造商/型号 | 未报告 | 未记录:确切制造商、型号及产品 URL;报告用途:在 4%–20% 浓度梯度凝胶上进行蛋白质分离 |
| Seurat | Satija 实验室 / Seurat 开发者 | https://satijalab.org/seurat/ | 版本 5.5.0 |
| SingleR | Bioconductor | https://bioconductor.org/packages/SingleR/ | 版本 2.10.0 |
| 组织匀浆器 | 论文中未报告制造商/型号 | 未报告 | 未记录:确切制造商、型号及产品 URL;报告用途:在冰冻裂解缓冲液中进行组织匀浆 |
| TriQuick 试剂 总 RNA 提取试剂 | Solarbio Life Sciences | R1100 | URL: https://www.solarbio.com/goodsInfo?id=1083 |
| Tween-20 | Solarbio Life Sciences | T8220 | URL: https://www.solarbio.com/goodsInfo?id=102 |
| 0.2 mL PCR 管排用超透明平盖 | Axygen / Corning | PCR-2CP-RT-C | URL: https://ecatalog.corning.com/life-sciences/b2b/TW/en/Genomics-%26-Molecular-Biology/PCR-Consumables/PCR-Tubes-and-Strip-Tubes/Axygen%C2%AE-PCR-Strip-Caps/p/PCR-2CP-RT-C |
| 通用 RT-PCR 试剂盒(M-MLV) | Solarbio Life Sciences | RP1100 | URL: https://www.solarbio.com/goodsInfo?id=992 |
| WGCNA | CRAN / WGCNA 作者 | https://cran.r-project.org/package=WGCNA | 版本 1.74 |
| Windows | Microsoft | https://www.microsoft.com/windows/windows-11 | Windows 11 |
参考文献
- Armstrong DG, Tan TW, Boulton AJM, Bus SA. Diabetic foot ulcers: a review. JAMA. 2023;330(1):62–75.
- Bus SA et al. Guidelines on the prevention of foot ulcers in persons with diabetes (IWGDF 2023 update). Diabetes Metab Res Rev. 2024;40(3):e3651.
- Sloan G, Selvarajah D, Tesfaye S. Pathogenesis, diagnosis and clinical management of diabetic sensorimotor peripheral neuropathy. Nat Rev Endocrinol. 2021;17(7):400–20.
- Maione AG et al. Altered ECM deposition by diabetic foot ulcer-derived fibroblasts implicates fibronectin in chronic wound repair. Wound Repair Regen. 2016;24(4):630–43.
- Caley MP, Martins VLC, O'Toole EA. Metalloproteinases and wound healing. Adv Wound Care (New Rochelle). 2015;4(4):225–34.
- Lobmann R et al. Expression of matrix-metalloproteinases and their inhibitors in the wounds of diabetic and non-diabetic patients. Diabetologia. 2002;45(7):1011–6.
- Muller M et al. Matrix metalloproteinases and diabetic foot ulcers: the ratio of MMP-1 to TIMP-1 is a predictor of wound healing. Diabet Med. 2008;25(4):419–26.
- Theocharidis G et al. Single cell transcriptomic landscape of diabetic foot ulcers. Nat Commun. 2022;13(1):181.
- Vabalas A, Gowen E, Poliakoff E, Casson AJ. Machine learning algorithm validation with a limited sample size. PLoS One. 2019;14(11):e0224365.
- Lewis MJ et al. nestedcv: an R package for fast implementation of nested cross-validation with embedded feature selection designed for transcriptomics and high-dimensional data. Bioinform Adv. 2023;3(1):vbad048.
- Hattori N et al. MMP-13 plays a role in keratinocyte migration, angiogenesis, and contraction in mouse skin wound healing. Am J Pathol. 2009;175(2):533–46.
- Pang J, Maienschein-Cline M, Koh TJ. Monocyte/macrophage heterogeneity during skin wound healing in mice. J Immunol. 2022;209(10):1999–2011.
- Finley PJ et al. Diabetic wounds exhibit decreased Ym1 and arginase expression with increased expression of IL-17 and IL-20. Adv Wound Care (New Rochelle). 2016;5(11):486–94.
- Moon JY et al. IL-17A is increased in diabetic wounds and impairs keratinocyte function via histone demethylase JMJD3. Nat Commun. 2026;17(1):780.
- Xiao Y et al. Macrophages regulate healing-associated fibroblasts in diabetic wound. Mol Biol Rep. 2024;51(1):203.
- Theocharidis G et al. Integrated skin transcriptomics and serum multiplex assays reveal novel mechanisms of wound healing in diabetic foot ulcers. Diabetes. 2020;69(10):2157–69.
- Almeida AF et al. Bioavailability of quercetin in humans with a focus on interindividual variation. Compr Rev Food Sci Food Saf. 2018;17(3):714–31.
- Khoshandam A, Imenshahidi M, Hosseinzadeh H. Pharmacokinetic of berberine, the main constituent of Berberis vulgaris L.: a comprehensive review. Phytother Res. 2022;36(11):4063–79.