

Summary
Epigenetic factors can interact with genetic programs to modulate gene expression and regulate B cell function. By combining in vitro B-cell stimulation, qRT-PCR, and high-throughput microRNA-sequence and mRNA-sequence approaches, we can analyze the epigenetic modulation of miRNA and gene expression in B cells.
Abstract
Antibody responses are accomplished through several critical B cell-intrinsic processes, including somatic hypermutation (SHM), class-switch DNA recombination (CSR), and plasma cell differentiation. In recent years, epigenetic modifications or factors, such as histone deacetylation and microRNAs (miRNAs), have been shown to interact with B-cell genetic programs to shape antibody responses, while the dysfunction of epigenetic factors has been found to lead to autoantibody responses. Analyzing genome-wide miRNA and mRNA expression in B cells in response to epigenetic modulators is important for understanding the epigenetic regulation of B-cell function and antibody response. Here, we demonstrate a protocol for inducing B cells to undergo CSR and plasma cell differentiation, treating these B cells with histone deacetylase (HDAC) inhibitors (HDIs), and analyzing mRNA and microRNA expression. In this protocol, we directly analyze complementary DNA (cDNA) sequences using next-generation mRNA sequencing (mRNA-seq) and miRNA-seq technologies, mapping of the sequencing reads to the genome, and quantitative reverse transcription (qRT)-PCR. With these approaches, we have defined that, in B cells induced to undergo CSR and plasma cell differentiation, HDI, an epigenetic regulator, selectively modulates miRNA and mRNA expression and alters CSR and plasma cell differentiation.
Introduction
Epigenetic marks or factors, such as DNA methylation, histone posttranslational modifications, and non-coding RNAs (including microRNAs), modulate cell function by altering gene expression1. Epigenetic modifications regulate B lymphocyte function, such as immunoglobulin class-switch DNA recombination (CSR), somatic hypermutation (SHM), and differentiation to memory B cells or plasma cells, thereby modulating the antibody and autoantibody responses2,3. CSR and SHM critically require activation-induced cytidine deaminase (AID, encoded as Aicda), which is highly induced in B cells in response to T-dependent and T-independent antigens4. Class-switched/hypermutated B cells further differentiate into plasma cells, which secrete large volumes of antibodies in a fashion critically dependent upon B lymphocyte-induced maturation protein 1 (Blimp1, encoded as Prdm1)5. Abnormal epigenetic changes in B cells may result in aberrant antibody/autoantibody responses, which can lead to allergic response or autoimmunity1,4. Understanding how epigenetic factors, such as miRNAs, modulate B cell-intrinsic gene expression is not only important for vaccine development, but is also essential to reveal the mechanisms of potential abnormal antibody/autoantibody responses.
Histone acetylation and deacetylation are modifications of the lysine residues on histone proteins typically catalyzed by histone acetyltransferase (HAT) and histone deacetylase (HDAC). These modifications lead to the increasing or decreasing accessibility of chromatin and further allow or prevent the binding of transcription factors or proteins to DNA and the alteration of gene expression5,6,7,8. HDAC inhibitors (HDI) are a class of compounds that interfere with the function of HDACs. Here, we used HDI (VPA) to address the regulation of HDAC on the intrinsic gene expression profile of B cells and on its mechanism.
miRNAs are small, non-coding RNAs approximately 18 to 22 nucleotides in length that are generated through several stages. miRNA host genes are transcribed and form hairpin primary microRNAs (pri-miRNAs). They are exported to the cytoplasm, where pri-miRNAs are further processed into precursor miRNAs (pre-miRNAs). Finally, mature miRNAs are formed through the cleavage of the pre-miRNAs. miRNAs recognize the complementary sequences within the 3' untranslated region of their target mRNAs6,7. Through post-transcriptional silencing, miRNAs regulate cellular activity, such as proliferation, differentiation, and apoptosis10,11. Since multiple miRNAs can target the same mRNA, and one single miRNA can potentially target multiple mRNAs, it is important to have an in-context view of the miRNA expression profile to understand the value of the individual and the collective effect of miRNAs. miRNAs have been shown to be involved in B-cell development and peripheral differentiation, as well as B-cell stage-specific differentiation, antibody response, and autoimmunity1,4,9. In the 3' UTR of Aicda and Prdm1, there are several validated or predicted evolutionarily conserved sites that can be targeted by miRNAs8.
Epigenetic modulation, including histone post-transcription modification and miRNAs, display a cell-type and cell stage-specific regulation pattern of gene expression9. Here, we describe methods to define the HDI-mediated modulation of miRNA and mRNA expression, CSR, and plasma cell differentiation. These include protocols for inducing B cells to undergo CSR and plasma cell differentiation; for treating the B cells with HDI; and for analyzing miRNA and mRNA expression by qRT-PCR, miRNA-seq, and mRNA-seq10,11,12,8,13.
Subscription Required. Please recommend JoVE to your librarian.
Protocol
The protocol follows the animal care guidelines of The Institutional Animal Care and Use Committees of the University of Texas Health Science Center at San Antonio.
1. Stimulation of Mouse B Cells for CSR, Plasma Cell Differentiation, and HDI Treatment
- Preparation of spleen cell suspensions
NOTE: Perform all steps in a laminar flow hood except for mouse euthanasia and dissection.- Euthanize the specific pathogen-free C57BL/6J mouse (8-12 weeks of age) by CO2 inhalation.
- Lay the mouse on dissecting board with the abdomen facing upward. Pin all four feet of the mouse with 18-gauge, 1.5-in hypodermic needles.
- Sterilize the skin using 70% ethanol-soaked wipes.
- Use one set of autoclaved surgical tools (forceps and dissecting scissors) to cut through the skin just below the ribcage to visualize the spleen (on the left side of the abdomen, just below the liver).
- Use another sterile forceps and scissors to extract the spleen, which lies beneath the greater curvature of the stomach, by clamping the spleen gently with forceps and cutting off all the connecting tissue with dissecting scissors. Make sure to remove all the connecting tissue.
- Place the spleen into a 1.5-mL microcentrifuge tube containing 1,000 µL of complete RPMI1640 medium (RPMI 1640 medium supplemented with 10% heat-inactivated fetal calf serum (FBS), 2 mM L-glutamine, 100 µg/mL penicillin, 100 µg/mL streptomycin, 0.25 µg/mL amphotericin B, and 50 µM β-mercaptoethanol).
- Place a 70-µm cell strainer into a 50-mL polypropylene conical centrifuge tube and pour the spleen from the microcentrifuge tube onto the cell strainer. Use the tip of a 15 mL polypropylene conical centrifuge tube to gently mash the spleen through the strainer. Rinse the cell strainer with 15 to 20 mL of complete medium.
- Spin down the cells at 350 x g for 5 min and discard the supernatant.
- Remove the red blood cells from the spleen cell suspensions. Resuspend the cell pellet in ACK lysis buffer (5 mL per spleen). Incubate for 4 min at room temperature with occasional shaking and then quench with 25 mL of complete medium.
- Spin down the cells at 350 x g for 5 min and discard the supernatant. Resuspend the cell pellet in 1 or 10 mL of complete medium. Count the viable cells using a hemocytometer.
- B-cell isolation
NOTE: Isolate B cells by negative selection following the manufacturer's instructions. Non-B cells are targeted for removal with biotinylated antibodies directed against non-B cells (CD4, CD8, CD11b, CD43, CD49b, CD90.2, Ly-6C/G (Gr-1), and TER119) and streptavidin-coated magnetic particles.- Prepare a 0.25 to 2 mL cell suspension of 1 x 10⁸ cells/mL in complete medium in a sterile 5 mL (12 x 75 mm) polystyrene round-bottom tube. Add normal rat serum (50 µL/mL) to the sample.
- Add 50 µL/mL isolation cocktail to the sample. Mix the cells by gently pipetting up and down 2 - 3 times and incubate at room temperature for 10 min.
- Add 75 µL/mL streptavidin-coated magnetic particles to the sample. Mix the mixture by gently pipetting up and down 2-3 times and incubate for 2.5 min at room temperature.
- Add complete RPMI 1640 medium. Mix the cells by gently pipetting up and down 2 - 3 times.
- Place the tube (without the lid) into the magnet and incubate at room temperature for 2.5 min. Pour off the supernatant containing untouched B cells into a new 15-mL conical tube.
- Count the viable cells using a hemocytometer and Trypan Blue stain. Assess the purity of the B cells by flow cytometry analysis of B-cell surface markers, such as B220 and CD19.
- B-cell stimulation and HDI treatment
- Resuspend the purified B cells in complete RPMI 1640 medium at a final concentration of 0.3 x 10⁶ cells/mL.
- Use a 48-well cell culture plate for cell culture. For each well, add 1 mL of purified B-cell suspension (0.3 x 10⁶ cells/mL), LPS (3 µg/mL final concentration) from Escherichia coli, IL-4 (5 ng/mL final concentration), and 0 or 500 µM HDI (valproic acid; VPA).
- Incubate the cells at 37 °C and 5% CO2 for 60 h for qRT-PCR and high-throughput mRNA- and miRNA-sequencing analysis, or 96 h for flow cytometry analysis.
- Flow cytometry analysis of CSR and plasma cell differentiation
- After 96 h of culture, detach the cells from each well by pipetting the cells up and down several times. Transfer the cell suspension into a 1.5-mL microcentrifuge tube. Spin down the cells at 350 x g for 5 min using a bench-top centrifuge and discard the supernatant.
- Resuspend the cells with 100 µL of HBSS buffer containing 1% BSA and 0.5 ng/mL fluorescein (FITC)-conjugated goat anti-mouse IgM antibody (Ab), 0.2 ng/mL allophycocyanin (APC)-conjugated rat anti-mouse IgG1 monoclonal Ab (mAb), 0.2 ng/mL phycoerythrin (PE)-conjugated rat anti-mouse B220 mAb, 0.2 ng/mL PE-Cy7-conjugated rat anti-mouse CD138 mAb, and 2 ng/mL 7-aminoactinomycin D (7-AAD).
- Incubate the cells with fluorescence-conjugated antibodies (step 1.4.2) in the dark at room temperature for 30 min.
- Wash the cells with 1 mL of HBSS with 1% BSA.
- Spin down the cells at 1,500 x g for 5 min using a benchtop centrifuge and discard the supernatant.
- Resuspend the cells in 300 µL of HBSS with 1% BSA and transfer the cell suspension to a round-bottom polystyrene tube. Cover the tube with foil to avoid light exposure.
- Perform flow cytometry analysis on a single-cell suspension. Collect 50,000 events for each compensation sample and 250,000 events for the other samples. Analyze the data using equipment software.
- Eliminate the debris and doublets by using a pulse geometry gate (FSC-H x FSC-A and SSC-H x SSC-A). Appropriately gate the plot on 7-AAD to exclude dead cells.
2. High-Throughput mRNA-Seq
- After 60 h of culture, extract the total RNA from 2 - 4 × 10⁶ cells using a total RNA isolation kit that can recover small RNA following the manufacturer's instructions. Include a DNase I treatment step.
- Verify the RNA integrity using a bioanalyzer, following the manufacturer's instructions.
- Use 500-1,000 ng of high-quality total RNA (RNA integrity number RIN > 8.0) for RNA-seq library preparation with a commercial RNA sample prep kit following the manufacturer's instructions.
- Pool the individual mRNA-seq libraries based on their respective 6-bp index portions of the adapters and sequence the libraries at 50 bp/sequence. Use a high-throughput DNA system according to the manufacturer's protocols.
- After the sequencing run, demultiplex with CASAVA to generate the fastq file for each sample. Perform reads mapping and bioinformatics analysis, as previously outlined11.
- Align all sequencing reads with their reference genomes (UCSC mouse genome build mm9) using TopHat2 default settings14. Process the bam files from alignment using HTSeq-count to obtain the counts per gene in all samples.
3. High-Throughput miRNA-Seq
- Use 100 ng-1 µg of high-quality total RNA, as prepared in step 2.1, for small RNA-seq library preparation by using a commercial small RNA-seq kit.
- Ligate the degenerated 3' adapter onto the 5′ ends of the starting small RNA molecules with a commercial ligation kit. Ligate the degenerated 5' adapter onto the 3′ ends of the starting small RNA molecules with a commercial ligation kit. Convert the RNA to cDNA by reverse transcription and amplify the small RNA-seq library by PCR amplification with commercial kits.
- Use a 6% TBE native PAGE gel to isolate the final small RNA-seq library. Run the gel with 1X TBE buffer at 200 V until the bromophenol blue tracking dye band nears the bottom of the gel (0.5 - 1 cm).
- Remove the gel from the glass plates and stain with ethidium bromide (0.5 µg/mL in water) in a clean container for 2-3 min. Visualize the gel bands on a UV transilluminator or another gel documentation instrument.
- Cut out the ~150-bp band using a clean razor and place it into a 1.7 mL tube.
- Extract the DNA using a gel extraction kit per manufacturer instructions.
- Check the size distribution of the final library with a commercial high-sensitivity DNA assay and the concentration with a commercial dsDNA assay per the manufacturers' instructions.
- Pool the libraries for amplification and a subsequent sequencing run with a commercial high-throughput DNA sequencing system per the manufacturer's protocols.
- Demultiplex with CASAVA to generate the fastq file for each sample per the manufacturer's protocols.
- For small RNA-seq analysis of each sample, use Flicker for small RNA alignment per the manufacturer's protocols.
- Remove reads that are aligned to contaminants, such as mitochondria, rRNA, primers, and so on.
- Align the data to mature miRNA sequences.
- Align the data to hairpin loop sequences (precursor miRNA).
- Align the data to other small RNA sequences (using the fRNA database)15.
- After all samples are quantified, define the differential expressed miRNAs between different groups/samples. Predict miRNAs that target selected mRNAs or mRNAs that can be targeted by a selective miRNA using online miRNA target prediction tools, such as TargetScan16, MicroCosm17, and PicTar18.
- If functional annotation or pathway analysis is needed, submit the predicted genes to Ingenuity Pathway analysis (IPA) or DAVID.
4. Quantitative RT-PCR (qRT-PCR) of mRNAs and miRNAs
- qRT-PCR analysis of mRNA
- Extract RNA from 0.2-5 × 10⁶ cells using a commercial total RNA isolation kit that can recover small RNA, following the manufacturer's instructions. Include a DNase I treatment step.
- Synthesize cDNA from total RNA with a first-strand cDNA synthesis system using oligo-dT primer.
- Quantify cDNA by qRT-PCR with appropriate primers, using 2x real-time PCR master mix with the following protocol: 95 °C for 15 s, 40 cycles of 94 °C for 10 s, 60 °C for 30 s, and 72 °C for 30 s.
- Perform data acquisition during the 72 °C extension step and perform melting curve analysis from 72 to 95 °C.
- qRT-PCR analysis of miRNA
- Aliquot RNA from the samples prepared in step 4.1.1.
- Reverse-transcribe the RNA into cDNA. Use a commercial microRNA reverse transcription kit, following the manufacturer's instructions.
- Perform real-time PCR for microRNA using a SYBR Green real-time PCR master mix with 250 nM mature miRNA forward primers in conjunction with a universal reverse primer.
- Thaw 2x PCR Master Mix, miRNA-specific forward primer, and universal reverse primer at room temperature. Mix the individual solutions.
- Prepare a reaction mix as follows for a 25 µL-per-well reaction volume (used in 96-well PCR plates):
2x PCR Master Mix 12.5 µL
miRNA forward primers (2.5 μM) 2.5 µL
Universal reverse primer (2.5 μM) 2.5 µL
RNase-free water5 µL - Add 22.5 μL of reaction mix to a 96-well PCR plate. Add 2.5 µL of template cDNA (50 pg-3 ng) to the individual plate wells.
- Tightly seal the plate film. Centrifuge the plate for 1 min at 1,000 x g and room temperature.
- Place the plate in the real-time cycler and start the following cycling program: 95 °C for 5 min, 40 cycles of 94 °C for 15 s, 55 °C for 30 s, and 72 °C for 30 s.
- Use the ΔΔCt method for qRT-PCR data analysis with a spreadsheet. Normalize the expression of the relevant miRNAs to the expression of small nuclear/nucleolar RNAs Rnu6/RNU61/2, Snord61/SNORD61, Snord68/SNORD68, and Snord70/SNORD70.
- Statistical analysis
- Perform statistical analysis to determine the p values by paired and unpaired Student's t-test using a spreadsheet and consider p values <0.05 as significant.
Subscription Required. Please recommend JoVE to your librarian.
Representative Results
Using our protocol, purified B cells placed with LPS (3 µg/mL) and IL-4 (5 ng/mL) for 96 h can induce 30-40% of CSR to IgG1 and ~10% of plasma cell differentiation. After treatment with HDI (500µM VPA), the CSR to IgG1 decreased to 10-20%, while plasma cell differentiation decreased to ~2% (Figure 1). HDI-mediated inhibition of CSR was further confirmed by decreased numbers of post-recombination Iμ-Cγ1 and mature VHDJH-Cγ1 transcripts, which are the hallmarks of completed CSR. As measured by qRT-PCR, the expression of Aicda, which is critical for CSR/SHM, and Prdm1 and Xbp1, which are important for plasma cell differentiation, were shown to be inhibited by VPA (Figure 2).
The modulation of mRNA expression by HDI in B cells was highly selective. As measured by mRNA-seq in B cells stimulated with LPS and IL-4, only 0.3% of these highly expressed mRNAs were upregulated by HDI more than two-fold, and only 0.36% of the highly expressed (>20 copies/cell in B cells without HDI treatment) mRNAs, including Aicda, Prdm1, and Xbp1, were reduced by HDI more than 50% (Figure 3).
The downregulation of Aicda, Prdm1, and Xbp1 expression could potentially be mediated by miRNAs, which are negative regulators of gene expression. By using miRNA targeting prediction tools (TargetScan.org, miRNA.org, and miRbase.org), we identified multiple miRNAs that can potentially target Aicda or Prdm1. The miRNA-seq analysis of miRNA profiling in B cells treated with HDI or nil showed that HDIs selectively upregulate Aicda- and Prdm1-targeting miRNAs (Figures 4 - 6).

Figure 1. Surface expression of B-cell marker B220, surface antibody IgG1, and plasma-cell marker CD138 were analyzed by flow cytometry.
B220+ IgG1+ cells were B cells switched to IgG1. B220lowCD138+ cells were plasma cells. The percentage of IgG1-switched B cells and plasma cells from B cells stimulated with LPS and IL-4 in the presence of nil or HDI (VPA, 500 M) for 96 h are indicated as the numbers within the gates. Please click here to view a larger version of this figure.

Figure 2. Expression of hallmarks of completed CSR; mature VHDJH-Cγ1 transcripts and post-recombination Iμ-Cγ1 transcripts; and Aicda, Prdm1, and Xbp1 were analyzed by qRT-PCR, normalized to Cd79b transcripts, and shown in a histogram.
Gene expression in B cells stimulated with LPS and IL-4 in the presence of 500 µM VPA and relevant to the gene expression in B cells with the same stimuli in the presence of nil were depicted as 1. The data are from three independent experiments. p values, paired t-test. Please click here to view a larger version of this figure.

Figure 3. B cells were stimulated with LPS and IL-4 and treated with HDI (VPA, 500 µM) or nil for 60 h. mRNA expression was analyzed by mRNA-seq.
(A) Average mRNA expression levels in three independent experiments (reads per kilobase per million mapped reads, RPKMs) were depicted in scatter plots. Each plot corresponds to one individual mRNA expression level. The two dashed lines are two-fold lines. Scatter plots located above the top dashed line or below the bottom dashed line indicate mRNAs that express more than twice or less than half when induced by VPA and nil, respectively. (B) The bar graphs depict the average change in mRNA expression levels (average RPKMs from three independent experiments) in LPS and IL-4-stimulated B cells treated with HDI, as compared to those in B cells treated with nil. Only the mRNAs at an average RPKM >20 in LPS and IL-4-stimulated B cells treated with nil are included. The mRNA expression in each individual experiment, as shown by a scatter plot (C) or bar graph (D), are depicted in the same way as in (A) and (B). p values, paired t-test. Please click here to view a larger version of this figure.

Figure 4. B cells were stimulated with LPS and IL-4 and treated with HDI (VPA, 500 µM) or nil for 60 h. miRNA expression was analyzed by miRNA-seq.
(A) The change in the average miRNA expression levels in B cells treated with HDI as compared to that in B cells treated with nil were depicted by bar graphs. (B) The change in miRNA expression levels in B cells treated with HDI as compared to that in B cells treated with nil in three independent experiments were depicted by bar graphs. Only the miRNAs at average RPM >0.5 in LPS and IL-4-stimulated B cells treated with nil are included. Please click here to view a larger version of this figure.

Figure 5. HDI increases the expression of Aicda-targeting miRNAs, as shown by miRNA-seq.
(A) Sequence alignment of the miRNAs and their target sites in the 3'UTR of Aicda mRNAs. (B) B cells were cultured with LPS and IL-4 in the presence or absence of HDI (VPA, 500 M) for 60 h. The expression of the miRNAs that were predicted to target Aicda 3'UTR were analyzed by miRNA-seq and depicted as RPM. p values, paired t-test. Please click here to view a larger version of this figure.
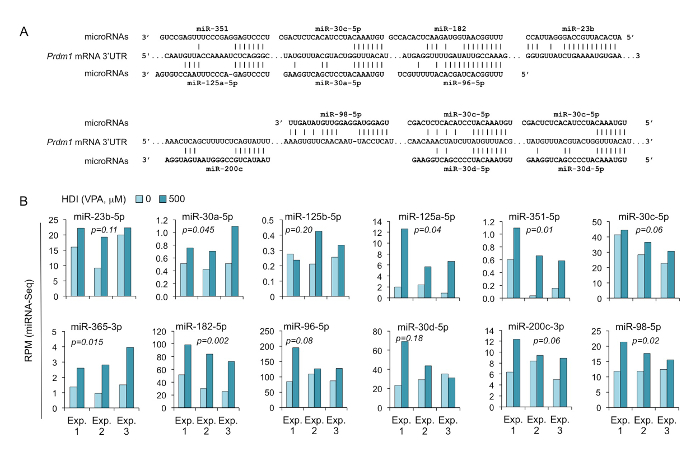
Figure 6. HDI increases the expression of Prdm1-targeting miRNAs, as shown by miRNA-seq.
(A) Sequence alignment of the miRNAs and their target sites in the 3' UTR of Prdm1 mRNAs. (B) B cells were cultured with LPS and IL-4 in the presence or absence of HDI (VPA, 500 M) for 60 h. Expression of the miRNAs that were predicted to target Prdm1 3' UTR were analyzed by miRNA-seq and depicted as RPM. p values, paired t-test. Please click here to view a larger version of this figure.
Subscription Required. Please recommend JoVE to your librarian.
Discussion
This protocol provides comprehensive approaches to induce B cell class switching and plasma cell differentiation; to analyze their impact by epigenetic modulators, namely HDI; and to detect the effect of HDI on mRNA and miRNA expression in these cells. Most of these approaches can also be used to analyze the impact of epigenetic factor on human B-cell function and mRNA/miRNA expression. The qRT-PCR and mRNA-seq/miRNA-seq approaches can also be used to analyze B cells isolated from mice treated with epigenetic modulators, such as HDIs.
The epigenetic modulate may impact many different cell functions, such as cell proliferation and viability, which could affect CSR and plasma cell differentiation. Therefore, cell proliferation, viability, and the cell cycles of the B cells, with or without HDI treatment, should be analyzed. One of the challenges for analyzing the modulation of mRNA and miRNA expression by HDI or other epigenetic regulators by qRT-PCR is choosing a suitable housekeeping gene or small RNA. Many common housekeeping genes can be altered to varying degrees by epigenetic modulators. The expression levels of many different housekeeping genes should be measured and used to normalize the specific gene expression by qRT-PCR. This issue can also be addressed by mRNA-seq and miRNA-seq, where the expression of individual mRNAs or miRNAs can be normalized by genome-wide mRNA or miRNA levels.
mRNA-seq can not only define the mRNA expression profile with an appropriate bioinformatics pipeline, but this approach can also define the long noncoding RNA (lncRNA) profile. mRNA-seq typically involves the enrichment of poly(A)+ RNAs by oligo(dT) selection. As a number of lncRNA are known to lack poly(A) tails, the mRNA-seq approach involving oligo (dT) selection cannot determine the complete information of lncRNA expression. In order to achieve complete coverage of both mRNA and lncRNA expression profiles, an RNA-seq approach involving rRNA depletion should be used. In most of our experiments, we use a commercial kit to extract the total RNA, including miRNA, for miRNA-seq, mRNA-seq, and qRT-PCR. Prior to constructing a high-throughput sequencing library, the total RNA quality is validated by running an aliquot on an automated RNA, DNA, and protein sample QC system. It is recommended that RNA samples have an RIN number of 7.0 or higher if they are to be used for small RNA library preparation. Samples with lower RIN numbers have a higher percent of degraded RNA products in the size range of small RNA species (15-30 nucleotides). When the RIN number is below 7.0, the coverage will not be as good. Another option for less-than-ideal RNA samples is to perform an rRNA depletion approach rather than an mRNA isolation approach, but this requires that the samples be at least 10 ng/mL.
The protocols for mRNA-seq used here are optimized for 100 - 1,000 ng of total RNA. For miRNA-seq using less than 100 ng of total RNA, small RNA-seq library preparation should follow a more sensitive small RNA-seq preparation protocol, which takes advantage of the natural structure common to most known microRNA molecules. Most mature miRNAs have a 5'-phosphate and a 3'-hydroxyl group as a result of their biogenesis pathway. Because of this, the 3' and 5' adapters in this kit are directly ligated to miRNAs.
To analyze the impact of HDI on B-cell mRNA and miRNA expression in vivo, mice can be treated with VPA or other HDIs by adding this HDI to the drinking water, and the intraperitoneal injection of these mice with T-dependent antigen NP-CGG or T-independent antigen NP-LPS can be performed. The B cells can be purified from the spleen 10 days after immunization.
Subscription Required. Please recommend JoVE to your librarian.
Disclosures
The authors declare that they have no competing financial interests.
Acknowledgments
This work was supported by NIH grants AI 105813 and AI 079705 (to PC), the Alliance for Lupus Research Target Identification in Lupus Grant ALR 295955 (to PC), and the Arthritis National Research Foundation research grant (to HZ). TS was supported by the Pediatrics Medical Center, Second Xiangya Hospital, Central South University, Changsha, China, in the context of the Xiangya-UT School of Medicine San Antonio medical student visiting program.
Materials
| Name | Company | Catalog Number | Comments |
| C57BL/6 mice | Jackson Labs | 664 | |
| Corning cellgro RPMI 1640 Medium (Mod.) 1X with L-Glutamine (Size: 6 x 500mL; With L-Glutamine) | Fisher Scientific | MT 10-040-CV | |
| FBS | Hyclone | SH300 | |
| HyClone Antibiotic Antimycotic Solution 100 mL | Fisher Scientific - Hyclone | SV3007901 | |
| β-Mercaptoethanol | Fisher Scientific | 44-420-3250ML | |
| Falcon Cell Strainers | Fisher Scientific | 21008-952 | |
| Trypan Blue Stain 0.04% | GIBCO/Life Technologies/Inv | 15250 | |
| ACK Lysis Buffer | Fisher Scientific | BW10-548E | |
| Hausser Scientific Bright-Line Counting Chamber | Fisher Scientific | 02-671-51B | |
| EasySep Magnet | Stem Cell Technologies | 18000 | |
| Falcon Round-Bottom Polystyrene Tubes with Cap | Fisher Scientific | 14-959-1A | |
| EasySep Mouse B cell Isolation Kit | Stem Cell Tech | 19854 | |
| BD Needle Only 18 Gauge 1.5 inch SHORT BEVEL 100/box | BD Biosciences | 305199 | |
| PE/Cy7 anti-mouse CD138 (Syndecan-1) Antibody | BioLegend | 142513 (25 ug) | |
| PE-Cy7 B220 antibody | BioLegend | 103222 | |
| 7-AAD (1 mg) | Sigma Aldrich | A9400-1MG | |
| APC anti-mouse/human CD45R/B220 antibody | Biolegend | 103212 | |
| Mouse APC-IgG1 200 µg | Biolegend | 406610 | |
| FITC anti-mouse IgM Antibody | Biolegend | 406506 | |
| FITC anti-mouse/human CD45R/B220 Antibody | Biolegend | 103206 | |
| PE Anti-Human/Mouse CD45R (B220) (RA3-6B2) | Biolegend | 103208 | |
| HBSS 1X | Fisher Scientific | MT-21-022-CM | |
| Bovine Serum Albumin, Fraction V, Heat Shock Treated | Fisher Scientific | BP1600-100 | |
| LPS 25mg (Lipopolysaccharides from Escherichia coli 055:B5) | Sigma Aldrich | L2880-25MG | |
| Recombinant mouse IL-4 (carrier-free) | BioLegend | 574302 (size: 10 ug) | |
| Valproic acid sodium salt | Sigma Aldrich | P4543 | |
| SterilGARD e3 Class II Type A2 Biosafety Cabinet | The Baker Company | SG404 | |
| Large-Capacity Reach-In CO2 Incubator | Thermo Scientific | 3950 | |
| Isotemp Digital-Control Water Baths: Model 205 | Fisher Scientific | 15-462-5Q | |
| 5mL Round Bottom Polystyrene Test Tube | Fisher Scientific | 14-959-5 | |
| Corning CentriStar 15ml Centrifuge Tubes | Fisher Scientific | 05-538-59A | |
| 1.7 mL Microtube, clear | Genesee | 22-282 | |
| Higher-Speed Easy Reader Plastic Centrifuge Tubes 50ml | Fisher Scientific | 06-443-18 | |
| ELMI SkySpin CM-6MT | ELMI | CM-6MT | |
| Rotor 6M | ELMI | 6M | |
| Rotor 6M.06 | ELMI | 6M.06 | |
| Drummond Portable Pipet-Aid XP Pipet Controller | Drummond Scientific | 4-000-101 | |
| 25 mL serological pipette tips | Fisher Scientific | 89130-900 | |
| 10 mL serological pipette tips | Fisher Scientific | 89130-898 | |
| 5 mL serological pipette tips | Fisher Scientific | 898130-896 | |
| 48-well plates | Fisher Scientific | 07-200-86 | |
| Allegra 6 Benchtop Centrifuge, Non-Refrigerated | Beckman Coulter | 366802 | |
| GH-3.8A Rotor, Horizontal, ARIES Smart Balance | Beckman Coulter | 366650 | |
| Allegra 25R Benchtop Centrifuge, Refrigerated | Beckman Coulter | 369434 | |
| TA-15-1.5 Rotor, Fixed Angle | Beckman Coulter | 368298 | |
| Fisher Scientific AccuSpin Micro 17 | Fisher Scientific | 13-100-675 | |
| Fisher Scientific Analog Vortex Mixer | Fisher Scientific | 02-215-365 | |
| miRNeasy Mini Kit (50) | Qiagen | 217004 | |
| Direct-zol RNA MiniPrep kit | Zymo Research | R2050 | |
| Chloroform (Approx. 0.75% Ethanol as Preservative/Molecular Biology) | Fisher Scientific | BP1145-1 | |
| Rnase-Free Dnase set (50) | QIAGEN | 79254 | |
| NanoDrop 2000 Spectrophotometers | Thermo Scientific | ND-2000 | |
| Superscript III First-strand Synthesis System RT-PCR | Invitrogen | 175013897 | |
| iTaq Universal SYBR Green Supermix | Bio-rad | 172-5121 | |
| Fisherbrand 96-Well Semi-Skirted PCR Plates, case of 25 | Fisher | 14-230-244 | |
| Microseal 'B' Adhesive Seals | Bio-Rad | MSB-1001 | |
| MyiQ Optics Module | Bio-Rad | 170-9744 | |
| iCycler Chassis | Bio-Rad | 170-8701 | |
| Optical Kit | Bio-Rad | 170-9752 | |
| BD LSR II Flow Cytometry Analyzer | BD Biosciences | ||
| FACSDiva software | BD Biosciences | ||
| FlowJo 10 | BD Biosciences | ||
| 2100 Bioanalyzer | Agilent Technologies | G2943CA | |
| S200 Focused-ultrasonicator | Covaris | S200 | |
| SPRIworks Fragment Library System I for Illumina | Beckman Coulter | A288267 | |
| cBot Cluster Generation Station | illumina | SY-312-2001 | |
| HiSeq 2000 Genome Sequencer | Illumina | SY-401-1001 | |
| TruSeq RNA Library Prep Kit v2 | Illumina | RS-122-2001 | |
| TruSeq Small RNA Library Prep Kit | Illumina | RS-200-0012 | |
| NEXTflex Illumina Small RNA Sequencing Kit v3 | Bioo Scientific | 5132-05 | |
| 2200 TapeStation | Agilent | G2964AA |
References
- Allis, C. D., Jenuwein, T. The molecular hallmarks of epigenetic control. Nat Rev Genet. 17, 487-500 (2016).
- Li, G., Zan, H., Xu, Z., Casali, P. Epigenetics of the antibody response. Trends Immunol. 34, 460-470 (2013).
- Zan, H., Casali, P. Epigenetics of Peripheral B-Cell Differentiation and the Antibody Response. Front Immunol. 6, 631 (2015).
- Xu, Z., Zan, H., Pone, E. J., Mai, T., Casali, P. Immunoglobulin class-switch DNA recombination: induction, targeting and beyond. Nat. Rev. Immunol. 12, 517-531 (2012).
- Nutt, S. L., Hodgkin, P. D., Tarlinton, D. M., Corcoran, L. M. The generation of antibody-secreting plasma cells. Nat. Rev. Immunol. 15, 160-171 (2015).
- Bartel, D. P. MicroRNAs: target recognition and regulatory functions. Cell. 136, 215-233 (2009).
- Fabian, M. R., Sonenberg, N., Filipowicz, W. Regulation of mRNA translation and stability by microRNAs. Annu. Rev. Biochem. 79, 351-379 (2010).
- White, C. A., et al. Histone deacetylase inhibitors upregulate B cell microRNAs that silence AID and Blimp-1 expression for epigenetic modulation of antibody and autoantibody responses. J Immunol. 193, 5933-5950 (2014).
- Farh, K. K., et al. Genetic and epigenetic fine mapping of causal autoimmune disease variants. Nature. 518, 337-343 (2015).
- Nagalakshmi, U., Waern, K., Snyder, M. RNA-Seq: a method for comprehensive transcriptome analysis. Curr Protoc Mol Biol. , 11-13 (2010).
- Martin, J. A., Wang, Z.
- Luo, S. MicroRNA expression analysis using the Illumina microRNA-Seq Platform. Methods Mol. Biol. 822, 183-188 (2012).
- Shen, T., Sanchez, H. N., Zan, H., Casali, P. Genome-wide analysis reveals selective modulation of microRNAs and mRNAs by histone deacetylase inhibitor in B cells induced to uUndergo class-switch DNA recombination and plasma cell differentiation. Front. Immunol. 6, 627 (2015).
- Trapnell, C., et al. Differential gene and transcript expression analysis of RNA-seq experiments with TopHat and Cufflinks. Nat Protoc. 7, 562-578 (2012).
- Kin, T., et al. fRNAdb: a platform for mining/annotating functional RNA candidates from non-coding RNA sequences. Nucleic Acids Res. 35, D145-D148 (2007).
- Agarwal, V., Bell, G. W., Nam, J. W., Bartel, D. P. Predicting effective microRNA target sites in mammalian mRNAs. Elife. 4, (2015).
- Griffiths-Jones, S., Saini, H. K., van Dongen, S., Enright, A. J. miRBase: tools for microRNA genomics. Nucleic Acids Res. 36, D154-D158 (2008).
- Anders, G., et al. doRiNA: a database of RNA interactions in post-transcriptional regulation. Nucleic Acids Res. 40, D180-D186 (2012).
