Fish-adaptation research expanded substantially from 1975 to 2025, progressing from salmonid physiology toward climate, molecular, disease, and field-monitoring perspectives. The evidence highlights persistent taxonomic and geographic concentration, as well as priorities for multi-stressor, life-stage, and management-relevant research.
Übersichtsartikel
Fish Adaptation in a Changing Climate: A Mapping Analysis
In diesem Artikel
Zusammenfassung
Zusammenfassung
Climate-driven warming, oxygen loss, acidification, salinity change, and extreme events increasingly challenge fish performance and persistence. This review mapped the global development of fish-adaptation research from 1975 to 2025 using 83,614 articles and 4,272,627 cited references. Publication, collaboration, keyword, citation-burst, and reference co-citation analyses were integrated with critical biological synthesis. Annual output increased at an estimated 9.02% per year from 1975 to 2024, although proposed boundaries at 2010 and 2019 were not statistically significant publication-growth breakpoints and were retained only as interpretive periods. Research evolved cumulatively from salmonid and organismal physiology toward climate-oriented, molecular, disease, genomic, and field-monitoring approaches. Global output and network connectivity remained concentrated among a limited number of countries and institutions, while established model species continued to dominate major research themes. Citation bursts also showed strong methodological visibility, which should not be equated with biological importance. Emerging priorities include multi-stressor experiments, sensitive life stages, tropical and other underrepresented systems, long-term monitoring, environmental DNA, and stronger linkage of molecular responses to demographic outcomes. The evidence is limited by single-database coverage, English-language and document-type restrictions, broad search terminology, metadata inconsistencies, citation bias, and parameter-dependent network construction. Equitable funding, capacity building, and research leadership in climate-vulnerable regions are needed to improve the biological and management relevance of future fish-adaptation research.
Einleitung
Climate change is rapidly altering the physical and chemical conditions of marine and freshwater environments. Rising water temperatures, declining oxygen availability, ocean acidification, altered salinity regimes, and increasingly frequent extreme events affect fish across multiple levels of biological organization. As ectotherms, fish are closely coupled to the temperature and oxygen conditions of their surroundings. Climate-driven environmental change can therefore influence metabolism, aerobic performance, growth, reproduction, behavior, geographic distribution, and survival, with broader consequences for aquatic biodiversity, fisheries productivity, aquaculture, and food security1,2,3,4,5.
Ocean warming is expressed not only through gradual increases in mean temperature but also through marine heatwaves, defined as prolonged periods of anomalously high ocean temperatures. Marine heatwaves have become more frequent and longer lasting as mean ocean temperatures have risen6. During the 2020s, recurring and geographically extensive marine heatwaves have further demonstrated how extreme warming can produce biological, ecological, and socioeconomic consequences across marine systems7. For fish, these events may reduce aerobic performance, disrupt reproduction and recruitment, alter migration and distribution, increase disease susceptibility, and affect prey availability and fisheries productivity. Their effects may become more severe when warming occurs together with hypoxia, acidification, salinity change, pollution, or habitat degradation.
The biological terms used to describe fish responses to environmental change must be distinguished carefully. Evolutionary adaptation refers to heritable changes in populations across generations. Acclimation generally describes physiological or phenotypic adjustment under controlled experimental conditions, whereas acclimatization refers to adjustment under natural or complex environmental conditions. Phenotypic plasticity is the capacity of a genotype to produce different phenotypes under different environmental conditions, while tolerance describes the range or intensity of conditions that an organism can withstand. These processes may interact, but they are not biologically interchangeable8,9,10. In this review, fish-adaptation research is used as an umbrella descriptor for the wider research field encompassing these distinct responses, rather than as an indication that adaptation, acclimation, acclimatization, plasticity, and tolerance represent the same mechanism.
Fish responses to environmental change operate across molecular, cellular, organismal, behavioral, population, and evolutionary levels. Molecular and cellular responses include changes in gene expression, protein regulation, metabolic pathways, antioxidant defense, immune activity, and cellular stress responses. These processes contribute to organism-level changes in thermal tolerance, oxygen transport, aerobic capacity, acid-base regulation, osmoregulation, growth, and reproductive performance5,10,11. Behavioral responses, including habitat selection, migration, altered activity, and changes in feeding behavior, may reduce exposure to unfavorable conditions over shorter timescales. Across generations, natural selection acting on heritable variation may alter population-level responses and influence long-term persistence. However, within-generation plasticity may provide only temporary resilience when environmental change exceeds the adjustment capacity of individuals and populations9. Studying these responses in natural aquatic environments remains difficult. Fish are mobile, often occupy heterogeneous or inaccessible habitats, and may move across broad geographic and environmental gradients. Conventional approaches based on capture, visual observation, acoustic surveys, or tagging can be costly, spatially restricted, and affected by differences in sampling effort and species detectability. Laboratory experiments provide essential mechanistic evidence, but controlled conditions may not adequately represent the fluctuating temperatures, oxygen levels, salinity conditions, food availability, pathogens, and interacting stressors experienced in natural habitats. A continuing challenge is therefore to connect experimentally measured physiological mechanisms with population and community responses observed in open waters.
Genomic, transcriptomic, and environmental DNA approaches are beginning to narrow this divide. Environmental DNA enables fish occurrence and community composition to be assessed from genetic material released into the surrounding water, providing a relatively non-invasive complement to capture-based and visual surveys12,13. These approaches may expand monitoring across habitats where conventional sampling is logistically difficult and improve the detection of rare, cryptic, migratory, or widely dispersed species. Nevertheless, interpretation is affected by DNA transport, degradation, environmental conditions, detection probability, reference-database quality, and uncertainty when translating DNA concentration into abundance or biomass. Environmental DNA should therefore be viewed as a complementary monitoring approach rather than a direct, standalone measure of biological adaptation.
Over the past five decades, research on fish responses to environmental change has expanded across physiology, ecology, evolutionary biology, molecular biology, genomics, fisheries science, aquaculture, and climate science. This expansion has generated a large and increasingly fragmented body of literature involving diverse species, habitats, stressors, life stages, biological endpoints, and analytical methods. Existing reviews have synthesized local adaptation in salmonids, molecular mechanisms of hypoxia tolerance, and adaptive evolution in marine organisms14,15,16. However, these reviews differ in taxonomic scope, environmental focus, and methodology and do not collectively provide a field-wide account of how fish-adaptation research has developed, how its research communities are connected, or how its dominant concepts and methods have changed over time.
The scale and heterogeneity of this literature limit the ability of conventional narrative reviews to capture the broader intellectual and collaborative structure of the field. Narrative synthesis remains essential for interpreting biological mechanisms, but it is not designed to systematically map tens of thousands of publications, long-term citation relationships, collaboration networks, or changes in terminology across several decades. Scientometric analysis, therefore, provides a methodological solution for examining the development of a large research field rather than merely serving as an additional descriptive technique. Reference co-citation analysis can identify intellectual foundations; collaboration analysis can reveal structural connections among countries and institutions; keyword analysis can identify changing research priorities; burst detection can identify periods of rapidly increasing attention; and temporal mapping can highlight emerging research fronts and historical turning points17,18. These patterns must be interpreted alongside the biological literature because scientometric prominence indicates visibility, association, or structural influence rather than biological causation or research quality.
The bibliographic corpus used in this review was drawn from a curated multidisciplinary citation index because its standardized bibliographic records, author affiliations, and cited-reference metadata support longitudinal citation, collaboration, and network analyses19. The specific database components, search strategy, filtering process, data-cleaning procedures, and analytical framework are summarized in Section 1. Reliance on one citation database, English-language publications, selected document types, and indexed references may influence the apparent structure of the field; these limitations are considered explicitly in Section 7.
Against this background, the present review examines the development of global fish-adaptation research from 1975 to 2025. It integrates scientometric mapping with critical synthesis of the biological literature to examine the geographical and institutional organization of the field; identify its major intellectual foundations, biological themes, and methodological influences; evaluate temporal shifts from species-specific and organismal physiology toward ecological, molecular, genomic, and integrative approaches; and identify emerging research priorities, geographical inequalities, evidence gaps, and implications for conservation, fisheries management, research investment, and climate-adaptation policy.
Überprüfung und Perspektive
1. Scope and analytical basis of the review
This review combined large-scale scientometric mapping with a critical interpretation of the biological literature on fish responses to environmental change. Scientometric indicators were used to identify patterns of scholarly activity and association; they were not interpreted as direct evidence of biological causation, research quality, or policy influence17,18.
Bibliographic records were retrieved from the multidisciplinary citation database specified in Table 1. The database was selected because its standardized bibliographic records, cited-reference metadata, author affiliations, and historical coverage support longitudinal citation, collaboration, co-citation, and burst analyses19. Alternative databases may provide broader coverage of particular disciplines or regional journals, but differences in record structure, cited-reference standardization, and retrospective coverage can affect the reproducibility of large-scale citation-network analyses.
The final search was conducted on 12 December 2025 using the Topic field, which covered article titles, abstracts, author keywords, and database-generated keywords. The Boolean query was fish* AND (adapt* OR acclimati* OR toleran* OR plasticit* OR adjust* OR modif*).
Wildcards captured grammatical variants. Adaptation, acclimation, acclimatization, phenotypic plasticity, and tolerance were included as related retrieval concepts but were not treated as biologically identical. The broad stems adjust* and modif* increased search sensitivity but may also have retrieved peripheral or non-biological uses; this limitation is addressed in Section 7.
The initial search identified 100,516 records. Restriction to research articles retained 85,918 records and excluded 14,598 non-article document types. Restriction to English-language publications retained 84,452 records and excluded 1,466 non-English articles. Exclusion of 76 records assigned to the incomplete 2026 publication year left 84,376 records after database filtering. Duplicate detection removed 599 records, leaving 83,777 unique records. A further 163 records were excluded because complete cited-reference information required for citation-based analysis was unavailable. The final analytical dataset, therefore, comprised 83,614 research articles and 4,272,627 cited references (Figure 1). No eligible records were identified before 1975.
The annual publication series used in Section 3 was generated from the 84,376 records retained after database filtering. The final network, co-citation, keyword, and citation-burst analyses used the cleaned dataset of 83,614 articles. This distinction is maintained because annual publication counts were generated before duplicate removal and cited-reference completeness assessment.
Exported records were combined into a unified corpus before analysis. Duplicate records were removed before network construction. Metadata were reviewed for obvious inconsistencies in author names, institutional affiliations, keyword forms, and cited references. Where equivalence could be established unambiguously, spelling variants, abbreviations, singular and plural forms, and synonymous expressions were consolidated. Methodological and software-related citations were distinguished from biological, ecological, and conceptual references during interpretation because widely used analytical references can accumulate citations across many fields.
Network analyses covered January 1975 through December 2025 using one-year time slices. Term sources comprised Title, Abstract, Author, Keywords (DE), and Keywords Plus (ID). Link strength was calculated using cosine similarity, with the scope restricted to within slices. The Top N selection criterion retained the 50 most cited or occurring items from each annual slice. Pathfinder pruning and pruning of sliced networks were enabled, whereas minimum spanning tree and pruning of the merged network were disabled. The saved project configuration reported LRF = 2.5, L/N = 10, LBY = 5, and e = 1.0. Node type was selected according to the analysis; the verified project screenshot shows the institution selected for the institutional collaboration network. The analytical components included annual publication analysis; country, institution, and author co-authorship analysis; reference and journal co-citation analysis; keyword co-occurrence and burst analysis; and cluster and timeline visualization. Co-citation was interpreted as intellectual association rather than evidence that one publication caused a subsequent development20. Collaboration centrality was interpreted as structural position within the observed network rather than a direct measure of scientific quality, national strategy, or policy influence21. Cluster labels were generated algorithmically, and cluster cohesion was assessed using silhouette values22.
Annual publication growth was examined using yearly publication counts from the 84,376-record filtered corpus. A log-linear regression model was fitted using the natural logarithm of annual publication count as the response variable and publication year as the predictor. The 2025 count was excluded from model estimation because the search date may have produced incomplete annual and indexing coverage. Compound annual growth rates were calculated descriptively for 1975-2009, 2010-2018, and 2019-2024. A fixed-knot segmented log-linear model assessed whether slopes changed at 2010 and 201923. Neither slope change was statistically significant, so the periods were retained as post-analysis descriptive phases based on the combined publication and keyword patterns rather than treated as statistically confirmed growth regimes.
2. Global collaboration, institutional capacity, and knowledge equity
Country- and institution-level co-authorship analyses revealed a geographically broad but structurally uneven research landscape. Publication output was concentrated among a relatively small number of countries and organizations, while the strongest bridging positions were primarily occupied by contributors from North America and Western Europe. Publication count and betweenness centrality were interpreted separately because they represent different dimensions of activity: publication count reflects productivity, whereas betweenness centrality indicates the extent to which a node connects otherwise weakly connected parts of a network21. The geographical distribution of publications, country-level co-authorship network, leading institutions, and institutional collaboration network are presented in Figure 2.
The United States was the largest contributor, with 23,990 publications, and occupied the strongest bridging position in the country-level network, with a betweenness centrality of 0.37. China ranked second in publication output with 10,841 publications, but had a centrality value of 0.01. France and Canada contributed 4,565 and 7,005 publications, respectively, but had comparatively high centrality values of 0.26 and 0.15. England, Belgium, and Denmark also occupied bridging positions. These findings show that high productivity does not necessarily correspond to a strong bridging position and that moderate-output countries can contribute substantially to network connectivity.
Malaysia contributed 573 publications, Indonesia 414, and Nigeria 84, but none had a centrality value exceeding 0.01. These values indicate limited bridging roles relative to the most connected countries, but they do not demonstrate an absence of international collaboration. A country may participate in bilateral or regional partnerships while still having low betweenness centrality when those collaborations do not connect otherwise separate parts of the global network. The overall pattern is consistent with a core-periphery structure reported in broader analyses of international scientific collaboration24.
The network results do not establish why particular countries occupy central or peripheral positions. Low centrality cannot demonstrate insufficient funding, political barriers, domestic research orientation, limited expertise, or exclusion from international partnerships. Similarly, high centrality does not prove that a country determines theoretical frameworks, methodological standards, or research agendas. Evaluating those mechanisms would require evidence on research expenditure, grant leadership, corresponding authorship, project coordination, data ownership, and long-term institutional partnerships.
Institutional output was similarly concentrated. The University of California system contributed 2,747 publications, followed by the French National Centre for Scientific Research with 2,344. The Chinese Academy of Sciences and the United States Department of the Interior each contributed 1,541 publications. Other major contributors included the National Oceanic and Atmospheric Administration, the State University System of Florida, the United States Geological Survey, Harvard University, and the Spanish National Research Council. The Chinese Academy of Sciences is identified separately as an East Asian national research organization and is not grouped with United States institutions.
The prominence of universities, national research organizations, and government agencies demonstrates that fish-adaptation research is conducted across academic, environmental-monitoring, and resource-management settings. However, co-authorship data alone cannot establish whether these institutions translated research into management guidelines, thermal benchmarks, habitat assessments, or fisheries policies.
The peripheral position of many countries and institutions from Southeast Asia, Africa, South Asia, and parts of Latin America has potential implications for knowledge equity. Global research expenditure and infrastructure remain unevenly distributed, even as international scientific collaboration has increased25. Equitable participation requires more than inclusion as a sampling location or data provider; it involves meaningful roles in research design, project leadership, corresponding authorship, data interpretation, infrastructure development, and management application. The present co-authorship network cannot determine whether these dimensions were equitable.
The geographical pattern may also affect ecological representation. Climate-related changes in fisheries productivity and species distributions vary strongly among regions, with important consequences for low-latitude fisheries and communities dependent on aquatic resources26. Nevertheless, underrepresentation of species, habitats, and life stages cannot be demonstrated from centrality alone and requires direct evidence-gap mapping. The results support co-led international projects, reciprocal postgraduate training, shared experimental and computational infrastructure, transparent data-governance agreements, and sustained North-South and South-South partnerships.
3. Temporal growth and conceptual evolution of fish-adaptation research
Annual publication output and keyword patterns revealed substantial long-term growth and conceptual reorganization between 1975 and 2025. For interpretation, the field was organized into a foundational physiological phase from 1975 to 2009, a climate-oriented expansion phase from 2010 to 2018, and a high-output molecular and integrative phase from 2019 to 2025. These periods were defined post-analysis by combining publication and keyword patterns and were not imposed before analysis. The keyword co-occurrence structure across the three periods is presented in Figure 3.
Foundational physiological phase, 1975–2009
Annual publication output increased from 23 records in 1975 to 1,880 in 2009. This period contributed 22,554 records, representing approximately 26.7% of the annual publication corpus. Its endpoint-based compound annual growth rate was 13.83%, although this value was influenced by the very small publication count at the beginning of the series.
The strongest reported keyword bursts included the historical taxonomic term Salmo gairdneri, trout Salmo gairdneri, plasma, and smoltification. These patterns indicate a strong early concentration on salmonid experimental systems, endocrine stress responses, circulating physiological indicators, osmoregulatory transitions, and life-history changes associated with movement between freshwater and marine environments.
This research provided important foundations for understanding how corticosteroids, metabolic processes, ionic regulation, and integrated physiological systems contribute to stress responses and homeostasis in fish27,28. The prominence of salmonid terminology demonstrates the visibility of salmonid research within the indexed literature rather than the absence of other taxa. Nevertheless, the strong taxonomic concentration raises questions about how well frameworks derived from temperate salmonids apply to tropical, polar, estuarine, and non-salmonid fishes.
Climate-oriented expansion phase, 2010–2018
Annual publication output increased from 2,087 records in 2010 to 3,658 in 2018. This period contributed 26,942 records, equivalent to approximately 31.9% of the annual publication corpus, and had an endpoint-based compound annual growth rate of 7.27%.
The keyword landscape broadened beyond species-specific physiology. Climate change exhibited a strong reported burst during 2016–2018 and was accompanied by morphology, abundance, fish consumption, biodiversity, assemblage, fisheries, and management terminology. This represented an expansion rather than the replacement of physiological research. Mechanistic evidence was increasingly interpreted within broader contexts involving warming, oxygen limitation, acidification, habitat alteration, species redistribution, and fisheries vulnerability2,29.
The increase in research activity occurred during growing international scientific and policy attention to climate change, biodiversity loss, and ecosystem resilience. However, the present analysis did not include annual policy, funding, or climate-event variables and therefore cannot demonstrate that specific agreements, extreme events, or funding initiatives caused the increase in publications.
High-output molecular and integrative phase, 2019–2025
The third phase contributed 34,880 records, representing approximately 41.3% of the annual publication corpus. Annual output increased from 4,309 records in 2019 to a complete-year peak of 5,341 in 2024. The endpoint-based compound annual growth rate from 2019 to 2024 was 4.39%, lower than in the preceding periods. The term high-output phase is therefore more accurate than the acceleration phase. The 2025 count of 5,335 records should be interpreted cautiously because the search was conducted on 12 December 2025 and may not include publications released or indexed during the final weeks of the year.
The strongest verified Phase 3 keyword bursts were rainbow trout, climate change, gene expression, and disease. The prominence of gene expression indicates increased attention to molecular regulation, environmentally induced phenotypic responses, and pathways connecting environmental exposure with organismal performance. Molecular approaches extended rather than replaced the physiological foundations established during earlier periods9,10. The disease burst indicates increasing recognition that fish responses are influenced by interactions between abiotic stress and biotic pressures30.
Despite greater use of molecular and genomic approaches, rainbow trout remained the strongest Phase 3 burst term. Its continued prominence indicates that increased analytical resolution has not necessarily been accompanied by equivalent taxonomic diversification. Established models and aquaculture species provide extensive genomic resources and standardized protocols, but excessive reliance on a limited number of taxa may constrain the wider applicability of adaptation frameworks.
Interpretation of keyword evolution
The temporal keyword trajectory indicates conceptual accumulation and integration rather than simple replacement. Experimental physiology and salmonid research established much of the mechanistic foundation. Climate-oriented research expanded analysis toward populations, communities, ecosystems, fisheries, and human use. More recent molecular, disease, oxidative-stress, and genomic approaches added greater analytical resolution to these physiological and ecological perspectives.
The absence of DNA, hypoxia, or early life stage as an individual major burst term should not be interpreted as evidence that those topics were absent. Relevant studies may be distributed across gene expression, genomics, transcriptomics, genetic variation, metabolism, thermal tolerance, species-specific terms, and environmental DNA. Burst detection identifies unusually rapid increases in attention and does not provide an exhaustive measure of all consistently important concepts17,18. Complete annual or phase-specific frequencies were not available for every keyword, so burst strength was interpreted as evidence of rapidly increasing attention rather than proportional importance, quality, or biological significance.
Statistical assessment of publication growth
A log-linear regression model fitted to annual publication counts from 1975 to 2024 indicated an estimated exponential annual growth rate of 9.02% (95% confidence interval, 8.49%–9.56%; R2 = 0.963; p < 0.001). A fixed-knot segmented log-linear model did not identify statistically significant slope changes at 2010 (p = 0.292) or 2019 (p = 0.676). The three periods should therefore be retained as descriptive post-analysis phases rather than presented as statistically confirmed inflection points23. Annual publication output and the three descriptive periods are shown in Figure 4.
Citation-density and citation-half-life comparisons were excluded because annual total-citation data and a formal citation half-life calculation were not available. Older publications have also had more time to accumulate citations than recent publications. Scientometric indicators should be interpreted as measures of scholarly activity, visibility, and knowledge circulation rather than direct measures of scientific quality31.
4. Citation-burst structure and influential references
Reference citation-burst analysis identifies publications that experience a rapid increase in citation attention during a particular period. Burst strength differs from total citation count: a reference can exhibit a strong burst because its use increased sharply over a short interval, even when it is not among the most cited references across the complete dataset. Citation bursts are therefore useful for identifying periods of concentrated attention and methodological transitions, but should not be interpreted as direct measures of research quality, biological importance, or causal influence17,18.
The timeline and duration of the 17 strongest cited-reference bursts are presented in Table 1. For interpretation, verified records were grouped into methodological and computational references and biological or conceptual references. Unresolved or malformed citation records were not assigned biological interpretations.
Methodological and computational visibility
The burst structure was dominated by methodological and computational references rather than empirical studies focused specifically on fish-adaptation mechanisms. Multiple version-specific records associated with general statistical computing and community ecology analysis appeared separately, increasing the apparent concentration of methodological influence. This pattern indicates that contemporary fish-adaptation research depends on shared analytical infrastructure for statistical modeling, multivariate analysis, genomic processing, and phylogenetic inference. Repeated citation of a method does not mean that it made a biological discovery or contributed to a fish-specific theory.
Prominent methodological references included molecular-evolution frameworks32,33 and a sequence-read preprocessing method34. These tools are used across many biological disciplines and can attract citations from a much wider literature than fish-adaptation research alone. Version-specific records should be retained transparently in the raw analytical output but grouped conceptually in the narrative to avoid treating software versions as independent intellectual advances.
Biological and conceptual references
Verified biological burst references represented complementary dimensions of fish-adaptation science. Evans and colleagues synthesized the multifunctional role of the fish gill in gas exchange, osmoregulation, acid-base regulation, and nitrogenous-waste excretion35. Eliason and colleagues demonstrated population-level differences in cardiorespiratory performance and thermal tolerance among sockeye salmon populations36. Clark and colleagues evaluated the measurement, interpretation, and limitations of aerobic scope in climate-change research11. Dahlke and colleagues identified reproductive adults and embryos as particularly temperature-sensitive life stages5, while Alfonso and colleagues connected rising temperatures with neuroendocrine, metabolic, immune, and oxidative-stress responses37.
Genomic references reflected expansion toward the architecture of adaptive evolution. Research on threespine sticklebacks demonstrated repeated ecological adaptation through shared standing genetic variation and regulatory and coding changes38. Comparative genomic analysis of African cichlids showed how gene duplication, regulatory divergence, transposable elements, microRNAs, and standing variation contributed to adaptive radiation39. A broader freshwater synthesis linked climate change, disease, contaminants, salinization, cumulative stressors, environmental DNA, and conservation responses40.
Methodological citation dominance creates a form of citation bias because analytical references are cited whenever a procedure is used, whereas empirical biological studies may be relevant only to particular taxa, life stages, habitats, or stressors. Journal visibility, accessibility, international collaboration, and alignment with rapidly developing topics can also influence citation bursts. The present analysis did not evaluate submission behavior or publication pressure and therefore cannot determine whether incentives to publish in high-impact journals caused the observed pattern31.
Citation-burst analysis and co-citation clustering answer different questions. Bursts identify references that experienced rapid increases in attention, whereas co-citation clusters identify groups of references that were cited together and represent broader intellectual or thematic communities. The relative absence of habitat-specific, early-life-stage, or multi-stressor studies from the top burst set does not prove that these topics are absent or unimportant; they may be distributed across many context-specific publications.
5. Thematic co-citation structure and biological evolution of fish-adaptation research
Reference co-citation analysis of 4,272,627 cited references identified 26 thematic clusters. A co-citation cluster comprises references frequently cited together and therefore reflects a shared intellectual, methodological, taxonomic, or biological context. Cluster labels were generated algorithmically and interpreted by examining associated cited and citing literature (Figure 5). They should be treated as concise thematic descriptors rather than exact classifications of every publication within a cluster.
The clusters discussed below had silhouette values ranging from 0.860 to 0.996. Silhouette indicates internal cohesion and separation but does not measure research quality, biological importance, or the reliability of every interpretation. Cluster size represents the number of cited-reference nodes grouped together and is not a direct measure of the total number of studies on a topic. Average publication year provides an approximate temporal position rather than the exact origin of a theme.
Model species as historical research anchors
Species-specific clusters formed some of the largest components of the network. Brown trout was represented by Cluster #0 (337 nodes; silhouette 0.914; average year 1996), with literature on growth efficiency, metabolic regulation, temperature-photoperiod interactions, acclimation, and energetic performance. Sockeye salmon formed Cluster #1 (326 nodes; silhouette 0.885; average year 2007), connecting cardiorespiratory performance, aerobic scope, migration ecology, thermal sensitivity, and population-specific vulnerability36. North Sea cod formed Cluster #4 (228 nodes; silhouette 0.919; average year 2004), linking marine warming, redistribution, productivity, environmental variability, and fisheries. Largemouth bass formed Cluster #5 (206 nodes; silhouette 0.895; average year 2020), with research on chronic and extreme warming, upper thermal limits, immune responses, and molecular regulation.
These clusters demonstrate sustained visibility of well-studied fishes, likely reflecting historical datasets, ecological or commercial relevance, established husbandry methods, and repeated use in physiological experiments. Their prominence does not prove that these species determined the theoretical direction of the field. Concentration on temperate and commercially important fishes may limit transferability to tropical, polar, deep-sea, estuarine, short-lived, and other non-model species.
Physiological, behavioral, and cellular response mechanisms
Thermal tolerance formed Cluster #3 (266 nodes; silhouette 0.860; average year 2017), linking critical thermal limits, acclimation capacity, metabolic compensation, aerobic performance, and warming vulnerability. No single threshold captures the complete adaptive capacity of a population because thermal limits, aerobic performance, reproduction, growth, behavior, disease susceptibility, and early-life-stage survival can respond differently2,5,11.
Bioenergetics modeling formed Cluster #10 (153 nodes; silhouette 0.958; average year 1989), connecting energy acquisition and allocation with growth, reproduction, survival, and population consequences. Seawater stage formed Cluster #8 (185 nodes; silhouette 0.936; average year 2001) and is better interpreted as a life-history and osmoregulatory theme involving smoltification, ion regulation, energetic costs, and developmental timing.
Older and smaller clusters represented caudal myotome function, phagocytic function, antifreeze proteins, movement behavior, and predation-risk seasonality. A smaller size indicates fewer co-cited reference nodes under a specific label, not biological unimportance or the absence of a wider literature. Together, the mechanistic clusters show that tissue function, immune responses, energetic balance, locomotion, osmoregulation, and thermal tolerance interact to determine organismal performance.
Climate-driven environmental stressors
Marine heatwaves formed Cluster #2 (325 nodes; average year 2018), one of the largest and most recent clusters. The associated literature addressed physiological disruption, species redistribution, ecosystem change, fisheries effects, and repeated or compound warming events. Marine heatwaves can expose organisms to rapid and extreme temperatures that exceed short-term acclimation capacity6,7. The co-citation map labels Cluster #13 as lake characteristics; therefore, it was not interpreted as a second marine-heatwave cluster.
Ocean acidification formed Cluster #9 (165 nodes; silhouette 0.902; average year 2013), with research on respiratory performance, acid-base regulation, behavior, development, early-life stages, and interactions with warming. Fish can regulate internal acid-base conditions, but this capacity varies among species, stages, exposure durations, and interacting stressors4. Hypoxia did not appear as a comparably dominant labeled cluster despite its importance. This absence does not indicate a lack of hypoxia research; related studies may be distributed across thermal tolerance, gill physiology, metabolism, marine heatwaves, acidification, and species-specific clusters.
Place-based ecological themes and monitoring methods
The Eastern Bering Sea formed Cluster #6 (198 nodes; silhouette 0.896; average year 2010), linking fisheries oceanography, climate variability, redistribution, ecosystem productivity, and population dynamics. Cluster #13 was labeled lake characteristics and connected thermal regimes, habitat structure, seasonal variation, species composition, and changes in ecological dominance. Place-based clusters reflect research communities in which environmental change, population response, fisheries, and monitoring are considered together; they do not imply that every study directly measured biological adaptation.
Environmental DNA formed Cluster #14 (76 nodes; silhouette 0.962; average year 2018), representing a recent methodological theme associated with non-invasive biodiversity assessment, species detection, community monitoring, and distributional change. Environmental DNA is not itself an adaptation mechanism; it is a monitoring approach that can document where populations and communities are changing. Its interpretation remains affected by DNA production, transport, degradation, detection probability, sampling design, and reference-database quality12,13. Its greatest value will arise when integrated with physiological measurements, conventional surveys, fisheries observations, genomic information, and environmental data.
Cross-cluster interpretation and evidence gaps
The co-citation structure reveals layered rather than strictly linear development. Older clusters were associated with tissue function, energetic performance, osmoregulation, behavior, cold adaptation, and established model species. Intermediate clusters connected physiology with migration, fisheries, oceanography, population dynamics, and climate sensitivity. Recent clusters emphasized thermal extremes, molecular regulation, immune responses, and field monitoring. This pattern supports the temporal changes identified through keyword analysis, but temporal proximity does not demonstrate that one cluster caused another to emerge.
The network simultaneously contains species-centered, mechanistic, climate- and ecosystem-oriented, and monitoring communities. The field has not shifted completely from physiology to genomics or from laboratory research to ecosystem science; newer approaches have accumulated around established foundations. Oxidative stress was visible in recent keyword patterns but did not form a major independent co-citation label, suggesting that it may be distributed across thermal stress, metabolism, immunity, disease, pollution, and species-specific literature. This interpretation requires direct examination of the underlying publications.
Important gaps include taxonomic concentration, fragmented life-stage evidence, limited integration of multiple stressors, and incomplete linkage between monitoring and mechanism. Embryos, larvae, juveniles, and reproductive adults may be particularly sensitive, but their evidence is distributed across thermal-tolerance, acidification, reproduction, growth, and species-specific clusters5. More realistic experiments are needed to connect molecular and physiological mechanisms with demographic and ecosystem outcomes.
6. Emerging research frontiers, evidence gaps, and management perspectives
The combined keyword, citation-burst, and co-citation patterns indicate movement toward greater mechanistic resolution, wider ecological application, and closer integration between laboratory and field evidence. Recent themes include gene expression, oxidative stress, disease, thermal extremes, adaptive capacity, environmental DNA, and climate-sensitive life stages. These patterns identify areas of increasing scholarly attention but do not establish that they are biologically more important than themes with weaker bursts or smaller clusters.
Integrating molecular responses with adaptive capacity
The increased prominence of gene expression and related molecular terminology reflects wider use of transcriptomic and genomic approaches to examine regulatory pathways, biomarkers, and population differences. Altered gene expression alone does not demonstrate evolutionary adaptation; it may represent transient physiological response, acclimation, developmental plasticity, or cellular damage. Molecular responses should therefore be connected with thermal tolerance, aerobic capacity, osmoregulation, immunity, growth, behavior, reproduction, survival, and population persistence. Common-environment, reciprocal-exposure, quantitative-genetic, population-genomic, and multigenerational approaches are needed to distinguish environmentally induced plasticity from heritable change8,9.
Multi-omics approaches may strengthen this integration by combining genomics, transcriptomics, proteomics, metabolomics, and physiological measurements. Their value lies not simply in generating more molecular information but in determining whether changes across biological levels converge on consistent mechanisms and predict organismal or demographic outcomes. Oxidative stress should be measured alongside whole-organism performance rather than treated as an independent indicator of adaptive capacity.
Climate, disease, and host-pathogen interactions
The recent disease burst indicates growing attention to interactions between climate stress and biotic challenges. Temperature, oxygen availability, salinity, and other environmental factors may influence pathogen development, transmission, geographic range, and virulence while simultaneously affecting fish immunity, energetic condition, and susceptibility30. Future work should use factorial designs that combine environmental stress with pathogen exposure and should include longitudinal monitoring because acute immune responses may not predict long-term disease or population outcomes.
Sensitive life stages and demographic bottlenecks
Embryos, larvae, juveniles, spawning adults, and non-reproductive adults may differ substantially in thermal tolerance, oxygen demand, osmoregulatory capacity, mobility, and behavioral avoidance. Evidence across hundreds of species identifies embryos and reproductive adults as particularly temperature sensitive5. Future experiments should encompass multiple stages within the same species and measure immediate mortality, development, growth, deformity, behavior, reproductive performance, carry-over effects, recovery, and recruitment. Linking these outcomes with demographic models would clarify whether sensitivity at one stage creates a population bottleneck.
Multiple stressors, hypoxia, and climate extremes
Natural populations rarely experience stressors in isolation. Warming commonly interacts with oxygen limitation, acidification, salinity change, food availability, pollution, pathogens, habitat degradation, and fishing pressure. Combined effects may be additive, antagonistic, or synergistic and depend on exposure sequence, duration, intensity, fluctuation, and recovery. Hypoxia-related studies may be distributed across gill physiology, metabolism, thermal tolerance, marine heatwaves, acidification, disease, and species-specific clusters. Fish responses include behavioral avoidance, ventilatory and cardiovascular adjustment, metabolic suppression, gene regulation, and, in some species, evolved hypoxia tolerance15.
The interaction between warming and hypoxia is particularly important because warming can increase metabolic oxygen demand while reducing oxygen solubility, and coastal eutrophication and stratification can intensify low-oxygen conditions3. Marine-heatwave experiments should reproduce event magnitude, duration, recurrence, season, previous thermal history, and recovery periods rather than relying solely on gradual changes in mean temperature6,7.
Taxonomic, geographical, and habitat representation
The persistence of salmonids, cod, largemouth bass, and other established species indicates the value of model and commercially important fishes but may limit transferability to species with different evolutionary histories and environmental conditions. Future research should broaden representation across tropical, polar, estuarine, deep-sea, freshwater, migratory, short-lived, and data-limited fishes, particularly species supporting small-scale fisheries and local livelihoods.
Collaboration centrality alone cannot establish that ecosystems or species are quantitatively underrepresented. A formal evidence-gap analysis should map study locations, taxa, climatic zones, habitats, life stages, and stressors. Addressing geographical imbalance requires local leadership, corresponding authorship, shared infrastructure, postgraduate training, data ownership, and participation in interpretation and management translation.
Long-term monitoring and environmental DNA
Environmental DNA can improve detection of rare, cryptic, migratory, or widely dispersed species and support repeated sampling where conventional surveys are difficult12,13. It is not a direct measure of physiological or evolutionary adaptation. Changes in detection can indicate altered occurrence, distribution, or community composition, but do not identify the mechanism responsible. Its greatest contribution will arise when integrated with conventional surveys, tagging, fisheries data, physiological measurements, genomic analysis, and environmental observations.
Long-term monitoring is necessary because short experiments may not capture acclimatization, recovery, repeated extremes, interannual variability, or demographic response. Coordinated time series combining temperature, oxygen, salinity, productivity, habitat condition, disease occurrence, distribution, abundance, and biological traits would provide a stronger basis for evaluating resistance, recovery, and long-term adaptive capacity.
Fisheries, aquaculture, and conservation implications
For fisheries, adaptation research can help identify climate-sensitive species, populations, seasons, and life stages. Information on thermal limits, oxygen sensitivity, reproductive windows, distributional shifts, and recovery may support vulnerability assessment, spatial planning, seasonal management, stock assessment, and interpretation of changes in catch or recruitment. Climate-driven redistribution also requires coordination across administrative boundaries because populations and fisheries may shift beyond historical management areas41.
For aquaculture, physiological and molecular evidence can inform site selection, temperature and oxygen management, broodstock choice, disease surveillance, feeding strategies, and strain evaluation. Selection for one favorable trait may create trade-offs in growth, reproduction, disease resistance, or performance under other stressors, so climate-resilient aquaculture should evaluate multiple traits and realistic environmental combinations.
For conservation, adaptation research can assist in identifying thermal refugia, climate-sensitive nursery areas, habitat corridors, vulnerable populations, and locations where restoration could reduce non-climatic stress. Management application must treat uncertainty explicitly. Laboratory thresholds should not be transferred directly into policy without considering population variation, acclimation history, environmental fluctuation, ecological context, and data quality.
Research and management priorities
The combined evidence supports five connected priorities: validate molecular and cellular responses against organismal and demographic outcomes; conduct full-life-cycle and multi-stressor studies under realistic exposure sequences; expand taxonomic, geographical, habitat, and life-stage representation through equitable partnerships; integrate long-term field monitoring, including environmental DNA, with physiology, genomics, fisheries observations, and environmental data; and translate adaptation evidence into decision-relevant indicators while preserving uncertainty and population-specific variation.
7. Limitations of the scientometric evidence
Scientometric analysis provides a broad overview of how a research field is organized and how scholarly attention changes over time. It does not provide a complete inventory of all relevant evidence, directly assess the methodological quality of individual studies, quantify biological effect sizes, or establish biological and policy causation.
Database coverage and document selection
The corpus was retrieved from one multidisciplinary citation index. The selected database provides standardized records and cited-reference metadata suited to longitudinal network analysis19, but no database provides complete coverage. Relevant publications may be indexed only in other international, discipline-specific, or regional databases. Technical reports, governmental documents, theses, books, and other grey literature may be absent. Database coverage also changes over time and may contribute to apparent publication growth.
Only English-language research articles were retained. This improved document consistency but may have reduced representation of research from regions where English is not the primary publication language and may have excluded influential reviews, proceedings, books, technical findings, and locally relevant fisheries literature. The search was completed on 12 December 2025, so 2025 may be incomplete, and 2024 was treated as the latest complete year in growth modeling.
Search breadth and conceptual specificity
The search strategy intentionally included adaptation, acclimation, acclimatization, tolerance, plasticity, adjustment, and modification to capture a broad domain. The stems adjust* and modif* may have retrieved technical, statistical, morphological, or non-adaptive contexts. Conversely, relevant studies that did not use the selected terms in titles, abstracts, or keywords may have been omitted. The analysis was a field-mapping review rather than a conventional systematic review based on full-text eligibility assessment of all 83,614 articles, so peripheral studies may remain in the corpus.
Dataset stages and metadata quality
The annual publication series used 84,376 records retained after database filtering, whereas citation and network analyses used the final 83,614 articles. The 762 records removed after database filtering represented approximately 0.90% of the filtered corpus and were unlikely to alter the overall five-decade trajectory substantially, although small annual differences may remain. Records without completely cited references were excluded from citation-based analyses and may be disproportionately associated with older or less standardized metadata.
Complete disambiguation of authors, institutions, keywords, and references is difficult in a dataset of this size. The same author or institution may appear under multiple names, while different entities may be combined incorrectly. Keyword analysis is affected by synonyms, abbreviations, historical terminology, taxonomic revisions, and singular or plural forms. Cited-reference formatting differences and version-specific software citations can split one reference into several records. The citation-burst output contained unresolved, duplicated, or malformed records, demonstrating that automated reference matching was not fully error-free.
Dependence on analytical parameters
Time-slice length, node-selection criteria, pruning algorithms, burst settings, and clustering procedures influence which nodes and links remain visible. One-year slices provide temporal detail but can increase fragmentation in low-output years. Pruning improves readability but may reduce visibility of weak, specialized, or emerging relationships. Algorithmic cluster labels are thematic summaries, not exact taxonomies. Silhouette values indicate cohesion and separation, not biological importance, study quality, or theoretical validity17,18.
Citation, keyword, and collaboration bias
Citation indicators are affected by publication age, field size, journal visibility, accessibility, collaboration, self-citation, and disciplinary citation practices. Methodological references may receive high counts or strong bursts because they are cited whenever an analytical procedure is used. Citation prominence should therefore not be interpreted as a direct measure of biological importance or quality31. Keyword bursts are also influenced by corpus growth, indexing, author terminology, synonym use, and normalization. The absence of a term from the strongest bursts or largest clusters does not demonstrate that the topic is absent from the literature.
Country and institutional co-authorship networks identify publication activity and structural connectivity, not funding capacity, scientific leadership, project ownership, equity, or policy influence. Betweenness centrality indicates a bridging position within the observed network, but does not show how funding, labor, data ownership, corresponding authorship, or decision-making were distributed. Geographical centrality also does not directly quantify taxonomic or habitat underrepresentation.
Temporal and biological inference
The periods 1975–2009, 2010–2018, and 2019–2025 were retained as interpretive phases. Segmented modeling did not identify statistically significant publication-growth slope changes at 2010 or 2019. Publication growth cannot be attributed directly to climate events, policy agreements, or funding programs because those variables were not included. Similarly, temporal proximity among clusters or citation bursts does not demonstrate causal succession.
This review maps research activity and critically interprets associated biological literature. It is not a formal risk-of-bias assessment, systematic review of experimental outcomes, or meta-analysis of effect sizes. It cannot determine which species, populations, or life stages are most vulnerable solely from publication counts, bursts, or co-citation clusters. Management implications should therefore be treated as research and policy considerations rather than prescriptions directly validated by scientometric analysis.
Despite these limitations, the large and temporally extensive dataset provides a useful overview of the development, collaboration structure, terminology, citation patterns, and thematic organization of fish-adaptation research. Future syntheses could integrate multiple databases, non-English and grey literature, systematic full-text assessment, normalized keyword frequencies, improved entity disambiguation, and meta-analysis of biological outcomes.
Schlussfolgerungen
This review mapped the development of fish-adaptation research from 1975 to 2025 using a final analytical dataset of 83,614 articles and 4,272,627 cited references. Research expanded from a field strongly centered on experimental physiology, osmoregulation, thermal performance, and established model species toward a broader domain incorporating climate extremes, ecological responses, molecular regulation, disease interactions, oxidative stress, genomics, and field monitoring. These developments represent conceptual accumulation and integration rather than the replacement of earlier physiological foundations.
The three temporal periods provide a useful descriptive framework, but 2010 and 2019 were not statistically supported publication-growth breakpoints. Global participation expanded while output, institutional capacity, and network connectivity remained concentrated among a limited number of countries and organizations. Methodological references and established model species were highly visible, but their prominence should not be equated with biological superiority or causal influence.
Future progress depends on linking molecular mechanisms with whole-organism performance, sensitive life stages, population dynamics, and real-world environmental exposure. Multi-stressor experiments, long-term monitoring, environmental DNA, wider taxonomic and geographical representation, and equitable research partnerships can improve assessments of fish vulnerability and resilience. Scientometric evidence is most valuable as a field-level map that complements systematic reviews, meta-analyses, experiments, and ecological observations. Stronger integration across biological scales can improve the relevance of fish-adaptation research for ecosystem-based fisheries management, climate-resilient aquaculture, biodiversity conservation, and climate-adaptation planning.
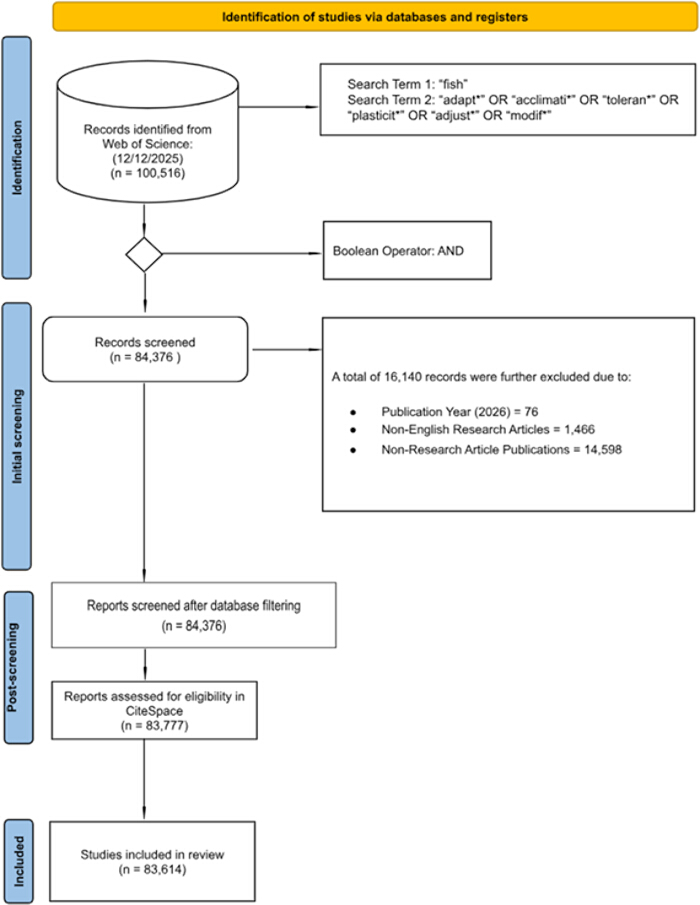
Figure 1: Identification, sequential database filtering, data cleaning, and final inclusion of records in the scientometric analysis. The initial search identified 100,516 records. Following document-type, language, and publication-year filtering, 84,376 records remained. Removal of 599 duplicate records and 163 records without complete cited-reference information produced a final analytical dataset of 83,614 articles and 4,272,627 cited references. Please click here to view a larger version of this figure.
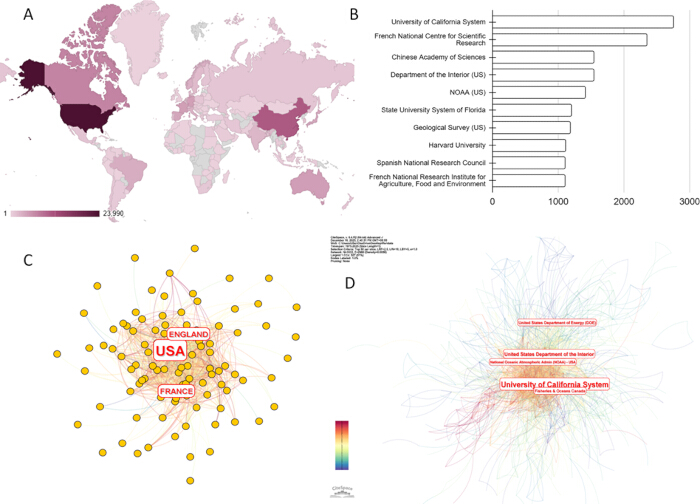
Figure 2: Global collaboration and institutional participation in fish-adaptation research from 1975 to 2025. (A) Global distribution of publications by country, with darker shading indicating greater publication output; countries shown in grey had no publications associated with them in the retrieved dataset. (B) Leading contributing institutions ranked by publication output. (C) Country-level co-authorship network, in which nodes represent countries, node size reflects publication output, and links represent co-authorship relationships. (D) Institutional co-authorship network showing collaborative relationships and major institutional hubs. Network position and centrality represent structural connectivity and should not be interpreted as direct measures of research quality, policy influence, or biological importance. Please click here to view a larger version of this figure.
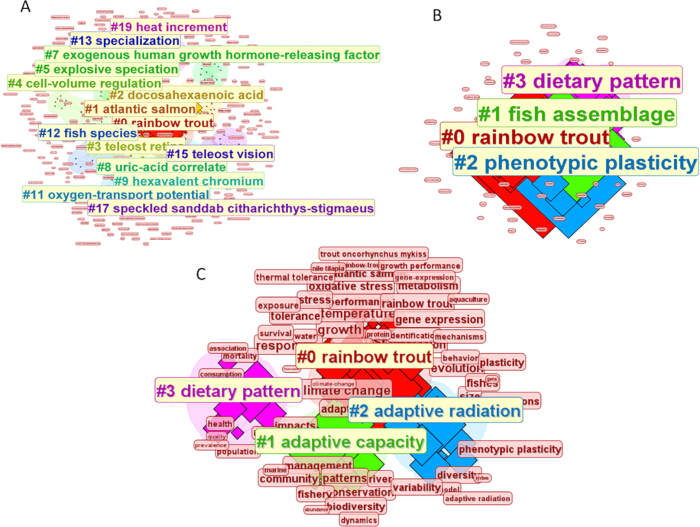
Figure 3: Keyword co-occurrence structure and conceptual evolution of fish-adaptation research from 1975 to 2025. (A) Foundational physiological phase, 1975–2009, characterized by species-specific research, salmonid experimental systems, endocrine physiology, osmoregulation, and life-history processes. (B) Climate-oriented expansion phase, 2010–2018, characterized by climate change, phenotypic plasticity, fish assemblages, dietary patterns, and population- and ecosystem-level perspectives. (C) High-output molecular and integrative phase, 2019–2025, characterized by gene expression, oxidative stress, metabolism, disease, adaptive capacity, adaptive radiation, and the continued prominence of rainbow trout. Node size represents keyword frequency, links represent co-occurrence relationships, and colors indicate temporal or cluster differentiation. Please click here to view a larger version of this figure.
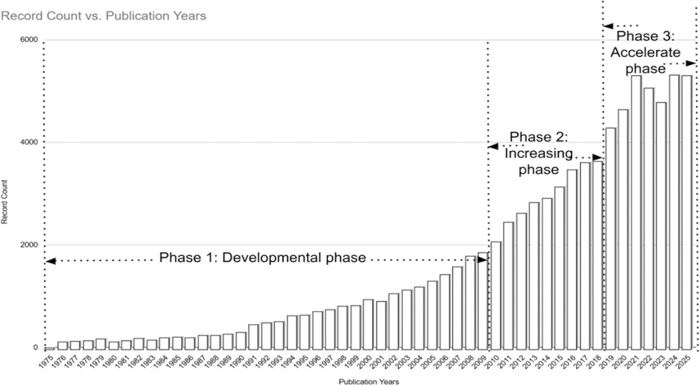
Figure 4: Annual publication output in fish-adaptation research from 1975 to 2025. Annual counts were derived from the 84,376 records retained after database filtering. The final network and citation-based analyses were based on 83,614 articles after duplicate removal and cited-reference completeness assessment. The timeline is presented using three post-analysis descriptive periods: foundational physiological development, 1975–2009; climate-oriented expansion, 2010–2018; and a high-output molecular and integrative phase, 2019–2025. The 2025 publication count may be affected by incomplete publication and indexing coverage. Segmented log-linear analysis did not identify statistically significant slope changes in 2010 or 2019. Please click here to view a larger version of this figure.
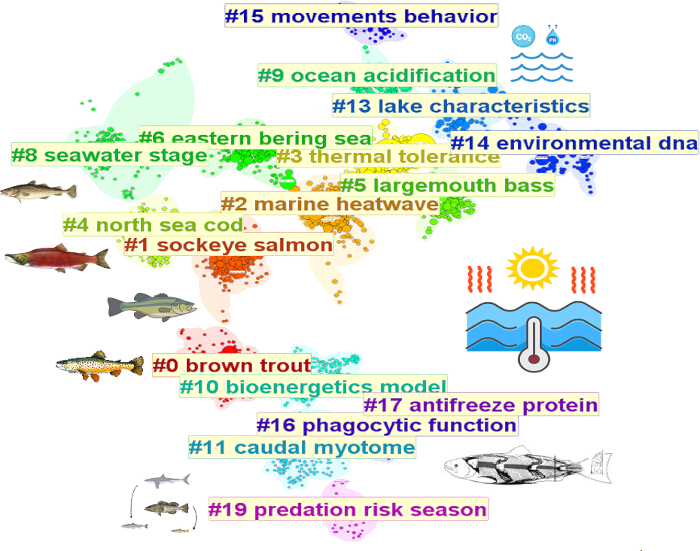
Figure 5: Reference co-citation structure of fish-adaptation research from 1975 to 2025. The network was constructed from 4,272,627 cited references associated with the final dataset of 83,614 articles. Nodes represent cited references, links indicate co-citation relationships, and labeled groups represent major co-citation clusters. Cluster labels provide algorithmically generated summaries and should not be interpreted as exact classifications or direct measures of biological importance. Please click here to view a larger version of this figure.
Table 1: Seventeen references with the strongest citation bursts in fish-adaptation research from 1975 to 2025. Red segments indicate the periods during which each reference experienced a citation burst, while the full horizontal line represents the observation period. Burst strength represents the intensity of a rapid increase in citation attention and does not represent total citation count, research quality, or biological importance. Please click here to download this Table.
Offenlegungen
The authors have nothing to disclose. The funders had no role in the design of the study; the collection, analysis, or interpretation of data; the writing of the manuscript; or the decision to submit the work for publication.
Danksagungen
This work was supported by the Ministry of Higher Education (MOHE), Malaysia, through the Higher Institution Centre of Excellence (HICoE) Phase I research grant awarded to the Institute of Climate Adaptation and Marine Biotechnology (ICAMB), Universiti Malaysia Terengganu (UMT), Vote No. 56069 (to MAG). This study was also supported by the Department of Fisheries Malaysia under the project entitled "Pengukuhan sektor akuakultur bagi menjamin bekalan makanan negara" (reference no. P21300040170109; to MNA) with Vot. No. 57252 entitled "Projek pembangunan manual pengurusan dan ternakan spesies akuakultur marin bagi tiram, ikan jenahak, ikan merah, ikan susu dan udang marin dalam menghadapi perubahan iklim".
Referenzen
- Pörtner HO, Knust R. Climate change affects marine fishes through the oxygen limitation of thermal tolerance. Science. 2007;315(5808):95-97.
- Pörtner HO, Farrell AP. Physiology and climate change. Science. 2008;322(5902):690-692.
- Diaz RJ, Rosenberg R. Spreading dead zones and consequences for marine ecosystems. Science. 2008;321(5891):926-929.
- Ishimatsu A, Hayashi M, Kikkawa T. Fishes in high-CO2, acidified oceans. Mar Ecol Prog Ser. 2008;373:295-302.
- Dahlke FT, Wohlrab S, Butzin M, Pörtner HO. Thermal bottlenecks in the life cycle define climate vulnerability of fish. Science. 2020;369(6499):65-70.
- Oliver ECJ, Donat MG, Burrows MT, et al. Longer and more frequent marine heatwaves over the past century. Nat Commun. 2018;9:1324.
- Wernberg T, Thomsen MS, Burrows MT, et al. Marine heatwaves as hot spots of climate change and impacts on biodiversity and ecosystem services. Nat Rev Biodivers. 2025;1:461-479.
- Ghalambor CK, McKay JK, Carroll SP, Reznick DN. Adaptive versus non-adaptive phenotypic plasticity and the potential for contemporary adaptation in new environments. Funct Ecol. 2007;21(3):394-407.
- Hoffmann AA, Sgrò CM. Climate change and evolutionary adaptation. Nature. 2011;470(7335):479-485.
- Somero GN. The physiology of climate change: how potentials for acclimatization and genetic adaptation will determine winners and losers. J Exp Biol. 2010;213(6):912-920.
- Clark TD, Sandblom E, Jutfelt F. Aerobic scope measurements of fishes in an era of climate change: respirometry, relevance and recommendations. J Exp Biol. 2013;216(15):2771-2782.
- Ramírez-Amaro S, Bassitta M, Picornell A, Ramon C, Terrasa B. Environmental DNA: state-of-the-art of its application for fisheries assessment in marine environments. Front Mar Sci. 2022;9:1004674.
- Yao M, et al. Fishing for fish environmental DNA: ecological applications, methodological considerations, surveying designs, and ways forward. Mol Ecol. 2022;31(20):5132-5164.
- Fraser DJ, Weir LK, Bernatchez L, Hansen MM, Taylor EB. Extent and scale of local adaptation in salmonid fishes: review and meta-analysis. Heredity. 2011;106(3):404-420.
- Zhu CD, Wang ZH, Yan B. Strategies for hypoxia adaptation in fish species: a review. J Comp Physiol B. 2013;183(8):1005-1013.
- Mao N, et al. Adaptive evolution of marine organisms: a bibliometric analysis based on CiteSpace. Water. 2023;15(23):4162.
- Chen C. Science mapping: a systematic review of the literature. J Data Inf Sci. 2017;2(2):1-40.
- Chen C, Song M. Visualizing a field of research: a methodology of systematic scientometric reviews. PLoS One. 2019;14(10):e0223994.
- Birkle C, Pendlebury DA, Schnell J, Adams J. Web of Science as a data source for research on scientific and scholarly activity. Quant Sci Stud. 2020;1(1):363-376.
- Small H. Co-citation in the scientific literature: a new measure of the relationship between two documents. J Am Soc Inf Sci. 1973;24(4):265-269.
- Newman MEJ. Scientific collaboration networks. II. Shortest paths, weighted networks, and centrality. Phys Rev E. 2001;64(1):016132.
- Hou J, Yang X, Chen C. Emerging trends and new developments in information science: a document co-citation analysis (2009-2016). Scientometrics. 2018;115(2):869-892.
- Bornmann L, Mutz R. Growth rates of modern science: a bibliometric analysis based on the number of publications and cited references. J Assoc Inf Sci Technol. 2015;66(11):2215-2222.
- Leydesdorff L, Wagner CS. International collaboration in science and the formation of a core group. J Informetr. 2008;2(4):317-325.
- UNESCO. UNESCO Science Report: The Race Against Time for Smarter Development. Paris: UNESCO Publishing; 2021.
- Pörtner HO, et al., editors. Climate Change 2022: Impacts, Adaptation and Vulnerability. Cambridge: Cambridge University Press; 2022. doi:10.1017/9781009325844.
- Barton BA, Iwama GK. Physiological changes in fish from stress in aquaculture with emphasis on the response and effects of corticosteroids. Annu Rev Fish Dis. 1991;1:3-26.
- Wendelaar Bonga SE. The stress response in fish. Physiol Rev. 1997;77(3):591-625.
- Pörtner HO, et al. Ocean systems. In: Field CB, Barros VR, Dokken DJ, et al., editors. Climate Change 2014: Impacts, Adaptation, and Vulnerability. Part A: Global and Sectoral Aspects. Cambridge: Cambridge University Press; 2014:411-484.
- Harvell CD, et al. Climate warming and disease risks for terrestrial and marine biota. Science. 2002;296(5576):2158-2162.
- Fortunato S, et al. Science of science. Science. 2018;359(6379):eaao0185.
- Tamura K, et al. MEGA5: molecular evolutionary genetics analysis using maximum likelihood, evolutionary distance, and maximum parsimony methods. Mol Biol Evol. 2011;28(10):2731-2739.
- Kumar S, Stecher G, Tamura K. MEGA7: molecular evolutionary genetics analysis version 7.0 for bigger datasets. Mol Biol Evol. 2016;33(7):1870-1874.
- Bolger AM, Lohse M, Usadel B. Trimmomatic: a flexible trimmer for Illumina sequence data. Bioinformatics. 2014;30(15):2114-2120.
- Evans DH, Piermarini PM, Choe KP. The multifunctional fish gill: dominant site of gas exchange, osmoregulation, acid-base regulation, and excretion of nitrogenous waste. Physiol Rev. 2005;85(1):97-177.
- Eliason EJ, et al. Differences in thermal tolerance among sockeye salmon populations. Science. 2011;332(6025):109-112.
- Alfonso S, Gesto M, Sadoul B. Temperature increase and its effects on fish stress physiology in the context of global warming. J Fish Biol. 2021;98(6):1496-1508.
- Jones FC, et al. The genomic basis of adaptive evolution in threespine sticklebacks. Nature. 2012;484(7392):55-61.
- Brawand D, et al. The genomic substrate for adaptive radiation in African cichlid fish. Nature. 2014;513(7518):375-381.
- Reid AJ, et al. Emerging threats and persistent conservation challenges for freshwater biodiversity. Biol Rev Camb Philos Soc. 2019;94(3):849-873.
- Pecl GT, et al. Biodiversity redistribution under climate change: impacts on ecosystems and human well-being. Science. 2017;355(6332):eaai9214.