This protocol describes the use of pressure swing adsorption to evaluate adsorbent performance for gas separation applications, focusing on breakthrough behavior, cycle design, and separation efficiency under representative operating conditions.
Methodenartikel
Vacuum Pressure Swing Adsorption for Hydrogen Purification with Zeolite 5A
In diesem Artikel
Zusammenfassung
Zusammenfassung
Pressure swing adsorption (PSA) is widely used for gas purification, and its performance depends strongly on the adsorbent properties and the cycle design. This study presents a protocol for hydrogen purification using a two-bed vacuum pressure swing adsorption (VPSA) system with zeolite 5A as the adsorbent. The procedure outlines how breakthrough experiments are conducted to support cycle design and explains the key considerations to ensure reliable operation under non‑isothermal and adiabatic conditions. Both breakthrough and VPSA experiments were performed to evaluate the separation performance of zeolite 5A for a H2/CO2 70/30 vol% gas mixture. The results show clear temperature variations within the adsorbent bed due to the exothermic heat of CO₂ adsorption, confirming the non‑isothermal nature of the process. Data analysis is performed for the last 10 cycles once steady‑state operation is achieved. The results highlight the potential to achieve high‑purity hydrogen when the VPSA cycle is designed correctly. The VPSA cycle performed in this study, with a 150 s adsorption step time and 40 s evacuation and purge step, achieves a 97% H2 purity and 80% H2 recovery. However, achieving high-purity hydrogen requires rigorous regeneration and purge steps, which reduce overall recovery, explaining the typical trade-off between purity and recovery in the PSA system. Overall, this work provides a detailed experimental protocol for VPSA hydrogen purification and emphasizes the importance of integrating adsorbent behavior, breakthrough data, and cycle design when developing adsorption‑based separation processes.
Einleitung
Hydrogen is increasingly recognized as a key component in the global shift toward cleaner energy sources. Due to its high energy content and environmentally friendly nature, it can be used in various applications, including fuel cells, industrial processes, and transportation. Currently, hydrogen production is dominated by steam methane reforming (SMR) integrated with the water‑gas shift reaction (WGSR) to enhance hydrogen yield. The product gas from SMR consists of 70–80% H2, 15–25% CO2, 3–6% CH4, 1–3% CO, and traces of N21. Although the SMR product stream contains approximately 70% H2, further separation and purification are still required for most industrial applications. High‑purity hydrogen is particularly critical in sectors such as electronics manufacturing and fuel cell technologies, where purities above 99.9% are typically demanded, posing a continuing technical challenge2.
At present, hydrogen purification is primarily achieved through cryogenic distillation, metal hydride, pressure swing adsorption (PSA), and membrane-based separation processes2. Cryogenic distillation is primarily applied to recover hydrogen from petrochemical off‑gases. In this process, the gas stream is compressed and cooled to extremely low temperatures to condense out the hydrocarbons, allowing hydrogen to be separated2. Although this method is highly energy‑intensive and expensive due to the extremely low operating temperatures, it produces hydrogen that can be readily liquefied, offering a significant advantage. Membrane separation offers high energy efficiency, low operating cost, and flexible design. However, membranes are limited by lower feed flow capacity, medium product purity (90–95%), and moderate recovery rates (85–90%), making them less suited for applications requiring high-purity hydrogen2.
PSA is a cyclic separation process used for continuous hydrogen purification, operating on the principle of selective adsorption of gas mixtures on porous solid adsorbents. The system employs at least two columns operating in an alternating manner: one undergoes adsorption at high pressure, while the other undergoes regeneration at low pressure. The first, simplest two-bed PSA process was introduced by Charles Skarstrom in 1960, for oxygen enrichment3. The basic process cycles for the simplest two-bed PSA process consist of four steps called the Skarstrom cycle, namely, Pressurization, Adsorption, Blowdown or Depressurization, and Purge4,5. Later on, an equalization step was introduced to the cycle, which increased the recovery of the light component, enhanced the purity of the most adsorbed species, and reduced the energy consumption6. Furthermore, the amount of gas adsorbed varies with pressure, temperature, and the adsorbent material. Common adsorbents used in PSA systems include activated carbon (AC), silica gel, and various zeolites, while metal-organic frameworks (MOFs) are emerging as a new class of promising adsorbents2.
Researchers investigated zeolites and activated carbon in various PSA configurations using experimental and simulation methods7,8,9. Among the types of zeolites studied, zeolite 5A7,8,9 and 13X10,11 are widely studied for separating H2 from CO₂, and CH4-containing gas mixtures. A study focusing on H2/CO₂ separation with a 70/30 vol% gas mixture using zeolite 5A in a one-column PSA achieved 99.99% H2 purity and 67.50% recovery12. A recent study investigated a novel 10-bed PSA configuration for H2 purification from SMR (H2/CO₂/CH4/CO = 76/20/3.5/0.5%) using activated carbon and zeolite 5A as adsorbents in a layered bed7. The results showed that at 298 K and 22 bar, a purity of 99.99% H2 can be achieved with 87.63% recovery and a productivity up to 7.82 molH2 kgads-1 h-1. Furthermore, another investigation on binary gas mixtures of H₂/CO₂ with compositions of 60/40 and 80/20 at 298 K and 5 bar using a lab-scale two-bed PSA with layered bed of AC and zeolite 5A, demonstrated that increasing the hydrogen fraction in the feed stream leads to higher hydrogen purity and recovery13. For instances, at a P/F (purge to feed ratio) ratio of 0.1, increasing the hydrogen composition of the feed increased hydrogen purity from 67.47% to 86.50%, while the corresponding hydrogen recovery increased slightly from 83.01% to 84.91%. Moreover, the same study has extensively investigated the influence of the P/F ratio and demonstrated that increasing it leads to higher product purity, though this is accompanied by a significant reduction in recovery. Additionally, they investigated the performance of the Cu-BTC MOF in PSA for H2 purification, comparing it with activated carbon and zeolite 5A13. The simulation results from a feed consisting of (H2/CO₂/CO/CH4= 45.74/31.74/6.22/16.30 %) with high amounts of impurities showed that the use of Cu-BTC leads to hydrogen purity of up to 97.22%, while activated carbon, zeolite 5A, and the layered bed cannot improve the purity beyond 86.46%. In general, when the PSA process is optimized for high purity, the achievable recovery becomes limited. This trade-off between purity and recovery must be considered when designing and evaluating a PSA cycle.
Most studies reported H₂/CO₂ binary gas mixtures with H₂ concentrations ranging from 60–80% and CO₂ concentrations between 20 and 40%, under pressures ranging from 1 bar to 20 bar, and at temperatures typically between 298 K and 323 K4,13,14,15. Considering the limited number of studies available on low-pressure H₂ purification16,17 along with the growing industrial interest in medium-scale SMR systems integrated with PSA units capable of operating under such conditions18,19, this study focuses on investigating H2 purification at low pressure. The aim of the study is to explore the application of PSA for hydrogen purification, focusing on a binary mixture of H₂/CO₂ with a 70/30 vol% ratio at 298 K and 3 bar. Zeolite 5A will be used as the adsorbent, where regeneration of the adsorbent during the cycle requires a vacuum step7. Therefore, a vacuum PSA (VPSA) cycle is designed and studied. Based on existing studies on the effect of the P/F ratio on PSA performance7,20 and to maintain a balanced trade-off between purity and recovery, the P/F ratio is set at 0.1 in this protocol. The detailed protocol of a VPSA experiment for hydrogen purification, including the results analysis, will be presented. In addition, a breakthrough analysis of the gas mixture used in PSA process design will be discussed.
Protokoll
CAUTION: Hydrogen is a highly flammable gas and is handled under pressure, presenting both fire and mechanical hazards. Appropriate personal protective equipment (PPE), including safety glasses, lab coats, and protective gloves, must be worn at all times. All gas lines should be leak‑free, and ignition sources must be strictly avoided. Off‑gases should be safely vented to a well‑ventilated area to prevent accumulation, and proper care must be taken when working with compressed gases and vacuum to avoid sudden pressure release or equipment failure.
1. Experimental unit of vacuum pressure swing adsorption (VPSA)
NOTE: A schematic diagram of the experimental two-bed pressure swing adsorption system is shown in Figure 1, and the actual experimental unit is presented in Supplementary Figure 1. The VPSA unit is equipped with two columns, with an inner diameter of 0.025 m and a height of 0.28 m. The feed flow rate to the VPSA is controlled by mass flow controllers (MFCs). The high pressure in the columns is controlled by a pressure transmitter, a pressure controller, a propionate valve, and the low pressure is achieved by a diaphragm vacuum pump. The system consists of solenoid valves that automatically control gas flow according to a pre-designed PSA cycle. The temperature in the adsorbent bed is measured by two thermocouples positioned at the top and bottom of the bed. The product flow rate of the VPSA unit is measured and recorded using a mass flow meter (MFM). The product gas is further analyzed for gas components and composition using a mass spectrometer (MS). Further details on the materials, tools, and software used in this protocol are included in the Table of Materials.
2. Loading the adsorbent
NOTE: Zeolite 5A (Thermo Fisher Scientific) is employed as the adsorbent for this study, and the specifications of the material are listed in Table 1.
| Specification | |
| Sample name (mesh size) | Molecular sieves 5A (8 to 12 mesh) |
| CAS number | 69912-79-4 |
| Appearance (Form) | Beads |
| Bead size | 1.6–2.6 mm (98%) |
| Bulk density | 766 kg m-3 (680 to 800 kg m-3) |
| Residual water | 1.1% (550°C, 2h) |
| Water adsorption | 22.1% (50% rH, 25°C, 1 bar) |
| From N2 sorption at 77 K | |
| Specific surface area of the beads | 528 m2 g-1 |
| Total pore volume | 0.273 cm3 g-1 |
Table 1: Specification of zeolite 5A beads. The table includes the N2 adsorption characterization data and physical properties.
CAUTION: Care should be taken to prevent the adsorbent from exposure to ambient air, as it adsorbs water vapor, which can affect the results.
- Activate the zeolite in the oven at 250 °C for 12 h. After cooling the zeolite to room temperature, weigh the adsorbent (120.74 ± 1.03 g per column), fill both columns with the adsorbent, and close them tightly.
- Switch on the PSA unit and open the software on the computer.
- Perform a leak test on the unit by pressurizing the column to 3 bar with He.
NOTE: The pressure values in the VPSA are given as absolute pressures.- In the FlowMX software, set the feed flow rate to 500 SmL/min and start flowing the gas (Supplementary File 1, Section 1, and Supplementary Figure 2).
- In the PSA software, open the feed valves (V1-1, V2-1) and product valves (V1-6, V2-6) of the VPSA unit.
NOTE: The respective valves are indicated in the flow diagram as shown in Figure 1. - Close the feed and product valves when the set pressure is reached and stabilized. Wait 30-60 min, observe for a pressure drop (<0.01 bar/h), and also use snoop to check for leaks.
- Open the waste valves (V1–2, V2–2, VW–2) and depressurize the column to 1 bar by removing He. After that, close all the open valves.
- Apply a vacuum by turning on the vacuum pump, opening the vacuum valve (V1–3, V2–3, and VW–3) to completely evacuate manifold and columns. Run the vacuum for 4 h, then close all the valves.
- Purge the adsorbent further with He by sending He through the adsorbent beds using the FlowMX (Supplementary File 1, Section 1) and PSA software (open the feed valves (V1–1, V2–1) and product valves (V1–6, V2–6)). Send the He through the column at a feed flow rate of 500 SmL/min at 1 bar for 2 h (until no additional gases are detected by the mass spectrometer (MS)).
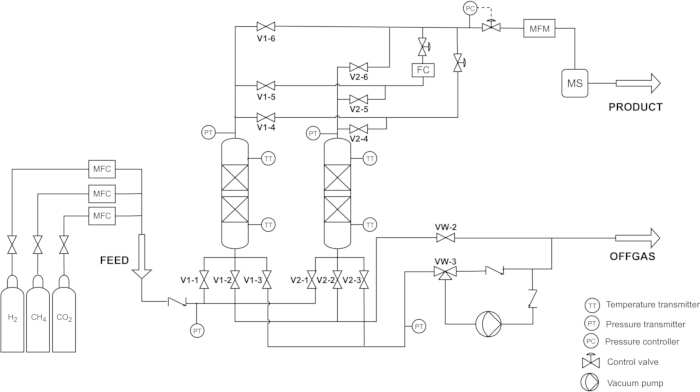
Figure 1: The schematic diagram of the two-column pressure swing adsorption (PSA) system. The diagram shows the complete set of connections from the gas cylinder to the mass spectrometer (MS) detection point, including the purge, backfill, and vacuum lines. Please click here to view a larger version of this figure.
3. Breakthrough study of feed gas
NOTE: A breakthrough study is performed to determine the adsorption/evacuation step time for the VPSA cycle. One column is used for the breakthrough study. In addition, the system lag-time is measured by replacing the column with a tube (negligible volume relative to the column), and a lag-time correction is applied to obtain the final breakthrough time21.
- Pressurize column 1 up to the operating pressure of 3 bar with He by opening the feed valves (V1-1) and the product valves (V1-6) and controlling He by using the FlowMX.
- Once the pressure in the column is reached and stabilized at 3 bar, close all the valves.
- In the FlowMX software, set the feed mixture as 70% H2 (1400 SmL/min), 30% CO2 (600 SmL/min), and separately send the He (466.6 SmL/min) directly to the mass spectrometer (MS).
NOTE: The He flow is diverted directly to the product line (bypassing the column) after pressurizing the column. It does not pass through the adsorbent bed; instead, it is used solely to dilute the product gas before it enters the MS. Direct analysis of pure H2 using an MS is not feasible due to vacuum limitations. In the current setup, one control box is used for all the MFCs (H2, CO₂, and He); therefore, the composition percentages set in the FlowMX software were 56.76% H2, 24.32% CO₂, and 18.92% He with a total flow rate of 2466.6 SmL/min. - Prepare the FlowVision 2 software for the flow rate data recording and start logging the data (Supplementary File 1, Section 2, and Supplementary Figure 3).
- In the PSA software, open the feed valves (V1-1) and the product valves (V1-6), and start sending the feed mixture by clicking “Start Flow” in the FlowMX at the same time.
- Measure the time to breakthrough H2 and CO₂ from the column with online readings from MS with the PV MassSpec software (Supplementary File 1, Section 3, and Supplementary Figure 4).
- Repeat the experiment for column 2 from steps 1 to 6 in this section, including the lag time (empty-apparatus response) measurements by replacing the column with the tube.
NOTE: The breakthrough time should be corrected by deducting the system lag time from the composite curve (system lag time + system with adsorbent). - Based on the corrected CO₂ breakthrough time, decide the adsorption/evacuation time, which should be less than the breakthrough time.
- After the breakthrough experiment depressurize the column to 1 bar. Regenerate the adsorbent by heating at 250 °C in the oven for 20 h. After filling the columns with the adsorbent, send He at 100 SmL/min overnight.
4. Designing and operating the cycle
- Keep the adsorption step time less than the breakthrough time.
NOTE: The breakthrough time for CO₂ was determined to be around 762 s (after lag time correction, see the Results section, Breakthrough results), and the adsorption step time for the PSA cycle was set to 150 s per column, corresponding to 20% of the breakthrough time. An early breakthrough criterion is considered to ensure high-purity hydrogen production and to extend the effective lifetime of the adsorbent. - The time for each step in the PSA cycle is shown in Table 2. The IDLE step is to close the valve in one column and open it in the other column, giving a 1 s step time.
NOTE: In the Table 2, AD = Adsorption: Feed gas is introduced, and heavy product (CO₂) is adsorbed while light product (H2) is obtained. BD = Blowdown: Column is depressurized from 3 bar to 1 bar counter currently, and tail gas is released. EVPG = Evacuation with purge: Column is purged counter currently with a portion of the product gas (H2) while vacuuming the column. BF = Backfill: Column is pressurized to 3 bar counter currently from 0.1 bar, with a portion of light product gas (H2). IDLE = Time to close from one column and open the valves in the other column. - In the PSA software, organize the PSA cycle by setting the step times and the respective valves, according to the designed cycle in Table 2 and Supplementary Figure 5.
- Keep the P/F (purge to feed) ratio as 0.1 by setting the purge flow rate as 200 SmL/min7,20.
- Update the configured cycle to PSA unit with “Update to PSA button”.
- Pressurize the column with H2 to the operating pressure (3 bar).
- Send the feed mixture and run the PSA while recording the data in the PSA software, including the MS from PV MassSpec, and MFM from the FlowVision2 software.
| BED 1 | IDLE | AD | AD | AD | IDLE | BD | EVPG | BF |
| BED 2 | IDLE | BD | EVPG | BF | IDLE | AD | AD | AD |
| Time (s) | 1 | 10 | 40 | 100 | 1 | 10 | 40 | 100 |
Table 2: VPSA cycle steps and step time. The table summarizes the steps and the time allocated to each step. It also illustrates the operating sequence, indicating the corresponding steps of the other column when one column is in the adsorption phase.
5. Calibration curve for mass spectrometer
- Use known compositions of CO₂/H2/He gas mixture and directly send it to the MS.
- Record the signal for each gas in PV MassSpec software and wait for the signal to be stabilized.
- Average the stabilized signal value (Intensity) and the respective gas composition.
- Get the number of data points by changing the composition and repeating the procedure, to plot the calibration curve for each gas (signal value in the y axis and composition in the x axis).
NOTE: The considered ranges for the calibration curves of gases are 0-80% for CO₂, 25–80% for H2 and 5–22% for He. The Supplementary Figures 6, 7, and 8 show the calibration curves for H2, CO₂, and He. Additionally, He is used as a diluent, and the flow is set to 1/3 of the H₂ flow. The He flow rate is maintained constant throughout all experiments. The effect of the He dilution is explained in Supplementary Figure 9. All calibration curves exhibit a linear relationship and are fitted using a standard linear equation of the form y = mx + c. - Use the calibration curve to determine the gas composition in the product line throughout the PSA experiments.
Ergebnisse
Adsorption isotherms provide fundamental information on the equilibrium uptake of gases, working capacity, and the possibility or potential of materials for gas separation. Therefore, isotherms are essential for understanding and validating the selection of adsorbents, operating pressures, and temperatures. Although adsorption isotherm measurements were not included as part of the experimental protocol demonstrated in this article, isotherm data obtained from Belsorp Max II for zeolite 5A at 298 K up to 9 bar are shown in Figure 2. The adsorption uptake reported in the isotherm is given as excess because the Belsorp instrument uses the AFSM (Advanced Free Space Measurement) principle. At the selected operating pressure of 3 bar, zeolite 5A shows CO2 uptake of 3.82 mmol/g, and H2 uptake of 0.06 mmol/g. A comparable difference in uptake between CO2 and H2 already indicates the potential of zeolite 5A for CO2/H2 separation in PSA. However, CO2 exhibits steep uptake below 1 bar, and at 1 bar it reaches 3.53 mmol/g, making desorption from zeolite 5A difficult without a vacuum. Therefore, VPSA is more suitable than conventional PSA, as it maintains effective regeneration throughout the cycle due to the strong affinity of CO2 for zeolite.
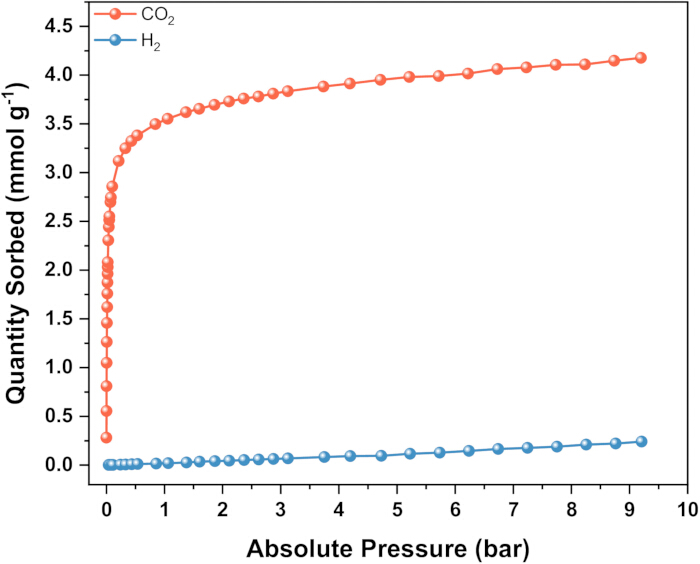
Figure 2: Adsorption isotherms for CO2 (orange), and H2 (blue), at 298 K up to 9 bars. The isotherm data represent the quantity of gas adsorbed in the equilibrium at a given temperature and pressure. The gas uptake values reported in the isotherm are given as excess (not absolute adsorption) because the Belsorp instrument uses the AFSM (Advanced Free Space Measurement) principle. Please click here to view a larger version of this figure.
Breakthrough results
Breakthrough experiments are essential for evaluating adsorbent capacity under dynamic conditions. They also provide critical information for determining appropriate adsorption and blowdown times required for stable PSA operation. Figure 3 shows the breakthrough curves obtained for H2/CO2, 70/30 vol% gas mixture on zeolite 5A at a pressure of 3 bar and a temperature of 298 K with the feed flow rate of 2000 SmL/min. Breakthrough curves for both of columns in the PSA are given in Supplementary Figure 10A. A breakthrough concentration of 0.2% of C/Co (gas component concentration at the exit of the column to the concentration at the inlet of the column) of H2 and 0.2% of C/Co of CO2 exhibit breakthrough times of 42 s and 762 s (after lag time correction), respectively, demonstrating the high adsorption capacity of zeolite 5A for CO2 under dynamic conditions. The given breakthrough time is corrected for the lag time of each individual gas while introducing the gas mixture: 48 s for H2 and 57 s for CO2. The empty-apparatus responses are shown in Supplementary Figure 10B. Breakthrough time of 0.2% of C/Co is considered for both the lag curve and the composite curve (sample + lag curve). The maximum value of C/Co of H2 is greater than one until the breakthrough of CO2 (Figure 3). This overshoot is referred to as a roll-up effect, which demonstrates competitive adsorption of the gas mixture22. In an n-component gas mixture, roll-up behavior will occur for n-1 components, while only the strongest adsorbing species will not exhibit any roll-up.
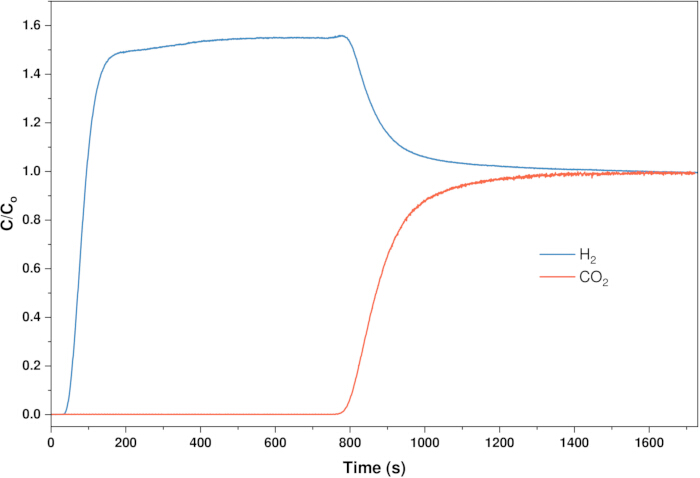
Figure 3: Breakthrough curves for H2/CO2 = 70/30 vol% at 3 bar, 298 K, and flow rate of 2 L/min. The blue curve is for the H2 breakthrough, and the orange curve is for the CO2 breakthrough. C/Co is the gas component concentration at the exit of the column to the concentration at the inlet of the column. A breakthrough concentration of 0.2% of C/Co is considered the breakthrough time in this protocol. Please click here to view a larger version of this figure.
PSA results
The PSA data collected after 25 cycles have been analyzed, and the system's performance is not changing significantly. The last 10 consecutive cycles are further analyzed for pressure, temperature variation, and process performance parameters. Figure 4A represents the pressure variation in a single column over one cycle with a total duration of 302 s. During the adsorption (AD) step, the column operates at 3 bar for 150 s. This is followed by a blowdown (BD) step, in which the pressure decreases from 3 bar to atmospheric pressure (1 bar), then to a vacuum of 0.1 bar. During the vacuum step (EVPG), the column is purged using a portion of the product H2 obtained from the other column. At 202 s within the cycle, the backfill (BF) step begins, during which the pressure is raised from 0.1 bar to 3 bar using a fraction of the product H2. A stable pressure variation over 10 cycles can be observed in Figure 4B. The PSA experiment is performed under non-isothermal and adiabatic conditions. The temperature variations within the adsorbent bed, as shown in Figure 4C–D, reflect the exothermic nature of CO2 adsorption. At the beginning of the cycle, the feed gas comes into contact with the fresh adsorbent, leading to adsorption and the formation of a mass transfer zone (MTZ). The first temperature sensor at the bottom (feed end) shows a rise around 40 s, indicating MTZ movement (Figure 4C). As the bottom adsorbent becomes saturated with CO2, the temperature stabilizes at 311 K. After approximately 90 s, it begins to decrease. Around 80 s, the second temperature sensor at the top of the column shows an increase, reaching approximately 314 K as the MTZ moves upward. After about 150 s, the temperatures at both the bottom and top of the column decrease sharply due to the BD and EVPG steps. The temperature drops to 293 K and 295 K, at the bottom and top of the column, respectively, due to CO2 desorption. Subsequently, the temperature begins to increase again during the BF step as the column is repressurized.
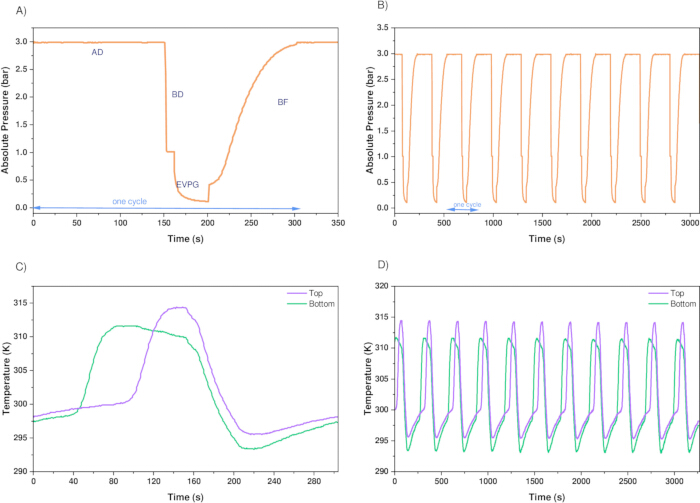
Figure 4: Pressure and temperature variation in the PSA. Pressure variation in (A) one VPSA cycle, (B) 10 VPSA cycles in one column, and temperature variation for (C) one VPSA cycle, (D) 10 VPSA cycles in one column. Temperature is measured at the top and bottom of the column. Please click here to view a larger version of this figure.
PSA performance parameters H2 purity, recovery, and productivity are evaluated with equations 1, 2, and 3, respectively7. The material balance is carried out for H2 and CO2, considering the transient flow data. Helium is excluded, as it does not pass through the column and is used only for dilution purposes. The composition of the product gas is evaluated using the calibration curves for H2, CO2, and He (Supplementary Figures 6–8). The variation in H2 and CO2 composition in the product gas stream over 10 cycles is presented in Supplementary Figure 11. In this study, a 4-step, 2-bed PSA with zeolite 5A achieved 97.49 ± 1.64% H2 purity, 80.14 ± 6.67% recovery, and the productivity of 11.49 ± 0.99 molH2 kgads-1 h-1 at a 0.1 P/F ratio. Another experiment following the same protocol, but with the purge time reduced by 50%, yielded 95.90% purity and 85.11% recovery, indicating a trade-off between purity and recovery. As shown in Figure 5, increasing the purge time by 20 s increases the purity by only 1.59%, whereas the recovery decreases by 4.97%. This relationship indicates that product recovery could be improved by tuning purge time without compromising product purity significantly. Furthermore, results from a comparable study showed that decreasing the P/F ratio from 0.1 to 0.07 reduced the purity from 99.99% to 97.64% and increased the recovery from 67.50% to 94.73%, indicating the trade-off between purity and recovery12. A separate study simulated H2/CO2, 80/20% composition in a two-bed PSA with zeolite 5A at 5 bar13. The column dimensions were 0.313 m in length and 0.021 m in inner diameter, and the feed flow rate was set to 2 SLPM. The obtained purity was 86.50%, with a recovery of 84.91% and a productivity of 12.91 × 10⁻³ mol m-3 h-1 at a P/F ratio of 0.1. A similar study simulated and modeled a 2-bed PSA in a layered configuration using activated carbon and zeolite 5A for the gas mixture of 72.9% H2, 3.6% CH4, 4.5% CO, and 19.0% CO223. They achieved 99.95% purity and 81.9% recovery at 2 MPa pressure and 0.1 P/F ratio23. A comparison between the present results and those reported in earlier studies clearly indicates that PSA performance, particularly product purity, recovery, and productivity, is governed by a wide range of factors, including cycle design, operating pressures, adsorbent properties, and the overall process configuration.
 (1)
 (2)
 (3)
Where Fin and Fout are the flow rates of feed and product streams.  and
 are H2 mole fractions in the feed and product streams, respectively. tcycle and madsorbent are the cycle time and mass of the adsorbent, respectively.
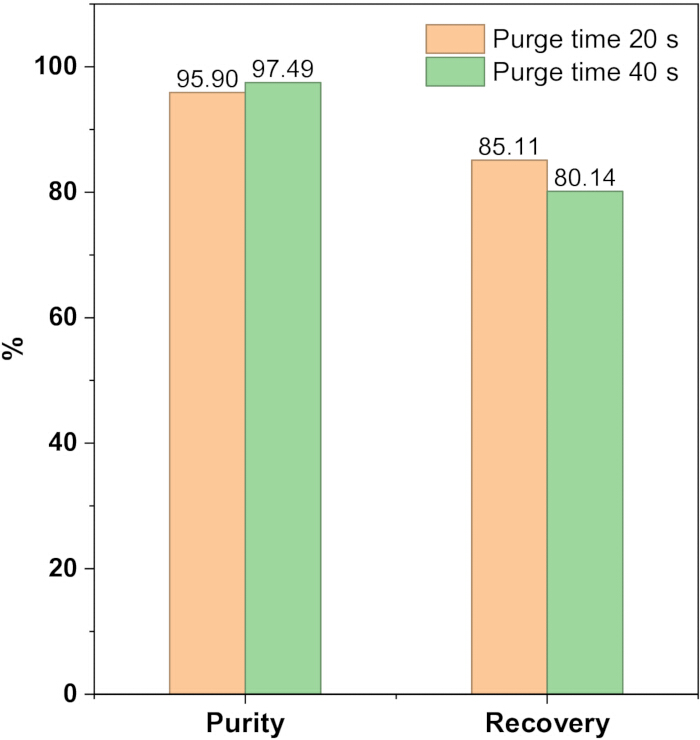
Figure 5: The variation in hydrogen purity and recovery when changing the purge time of the VPSA cycle. In these two experiments, all parameters and conditions are kept the same except for the purge time. Please click here to view a larger version of this figure.
Supplementary File 1: Operational procedure for software. This includes the steps for operating the FlowVision MX-1.4.15, FlowVision v2.1.3, and PV MassSpec software. Please click here to download this file.
Supplementary Figure 1: PSA experimental setup. The two-column experimental PSA setup with MFCs, MFM, and indicating the feed and product lines. Please click here to download this file.
Supplementary Figure 2: User interface of the Flow Vision MX Software. The software is used to create the gas mixture and control the feed gas flow rates. Please click here to download this file.
Supplementary Figure 3: User interface of the FlowVision v2.1.3 software. The software records product gas flow rates over time. Please click here to download this file.
Supplementary Figure 4: User interface of the PV MassSpec software. The software records the gas-mixture composition in the product stream as a time-series signal. Please click here to download this file.
Supplementary Figure 5: PSA operating software. The PSA cycle design is implemented in the software by entering the time and selecting the appropriate valves for each step. Please click here to download this file.
Supplementary Figure 6: Calibration curve from MS for H2. The x-axis data are from the known gas compositions, and the y-axis represents the signal intensity data for that given H2 composition. The H2 data range includes the calibration range of 25–80% composition. Please click here to download this file.
Supplementary Figure 7: Calibration curve from MS for CO2. For CO2, the calibration range was set to 0–80%. Please click here to download this file.
Supplementary Figure 8: Calibration curve from MS for He. The calibration data points cover the composition range of 5–22%. Please click here to download this file.
Supplementary Figure 9: Effect of He dilution on the H2 intensity data. The total flow rate of the H2-He gas mixture and the H2 composition are shown in the figure. The figure presents the MS calibration points at different He dilution ratios across various flow rates. The data points are obtained at various flow rates and H2/He compositions. Results show that the total flow rate of the gas mixture does not affect the intensity measurements. However, increasing the He fraction in the mixture reduces the error and improves the reproducibility of the calibration data. Please click here to download this file.
Supplementary Figure 10: Breakthrough curves and empty-apparatus curve (A) Breakthrough curve for 70% H2 and 30% CO2 in column 1 and column 2, (B) Empty-apparatus response (lag time curve) for H2 and CO2. The empty apparatus is the one in which the column is replaced with a tube. Please click here to download this file.
Supplementary Figure 11: Gas composition in the product stream. H2 and CO2 composition change in the product stream over the VPSA cycle. The observed composition behavior follows the variation in H2 concentration in the product stream at different stages of the cycle. During the vacuum, purge, and backfill steps, in which a portion of the H2 is utilized, the H2 concentration decreases. In contrast, higher H2 concentrations are maintained during the remaining stages of the cycle. Please click here to download this file.
Diskussion
This protocol outlines hydrogen purification in a lab-scale two-bed PSA with zeolite 5A. The important factors to consider in this protocol include maintaining a stable operating pressure, ensuring proper adsorbent packing, and avoiding channeling in the column to ensure accurate breakthrough and PSA experiment results. For the PSA, achieving the cyclic steady state is important to analyze the performance of the cycles of the PSA24,25. Failure to achieve target purity may be caused by inadequate purge flow, insufficient depressurization, or incorrect timing of the adsorption/desorption steps. If the system fails to reach purities above the expected level, adsorption pressure and cycle timing should be reoptimized. In PSA, the P/F ratio is a primary controlling parameter, where insufficient purge leads to poor regeneration and low purity, while excessive purge reduces product recovery5,26. Furthermore, proper leak testing prior to the testing is essential because leaks can alter breakthrough times and PSA product purity.
In addition, the adsorbent material plays a critical role in the behavior of the PSA, strongly affecting the separation efficiency24. For example, a common approach to separating CO₂-containing gas mixtures is to use a layered adsorbent bed comprising activated carbon (AC) and zeolite23,26. CO₂ is preferentially adsorbed in the AC layer, where it can be desorbed more easily and with lower energy input than in zeolites. The PSA cycle needs to be carefully designed to prevent CO₂ from migrating into the zeolite layer, where regeneration would be more energy intensive. This layered approach improves energy efficiency and enhances overall separation performance.
A limitation of the breakthrough experiments is that they provide dynamic capacity under specific conditions but may not fully represent equilibrium capacity, particularly when mass-transfer limitations are present. The PSA process demonstrated here is a simplified representation, with a vacuum and a backfill step, but industrial-scale cycles often incorporate multiple columns and advanced cycle designs with multiple pressure equalization steps, which increase hydrogen recovery27. One of the downsides of this protocol is that MS requires He to dilute the gas mixtures with H2 as the instrument cannot directly handle high concentrations of H₂ due to ionization and detector limitations28. This means the gas mixture entering the MS is not the original stream, and the dilution step can introduce an extra source of uncertainty. However, the composition of the product gas can still be determined accurately by analyzing the sample with gas chromatography (GC), a widely used technique in gas separation research that avoids the need for constant helium dilution.
Despite these limitations, this method can be adapted to a wide range of gas separation problems, including more challenging gas mixtures and compositions, to achieve high-purity products. For example, the recovery of fuel cell-grade H2 from a waste stream in an ammonia synthesis plant has been investigated28. A four-column PSA with zeolite 5A was tested on a gas mixture with a molar composition of 58% H2, 25% N2, 15% CH4, and 2% Ar, and reported 99.25% purity with a recovery of 75.3%. In addition, PSA can be combined with other technologies for enhanced separation efficiency. Hydrogen purification from Coke Oven Gas (COG) was studied by combining PSA and Electrochemical Hydrogen Purification and Compression (EHP/C) unit, where EHP/C removed O2, N2, and CH4 impurities while PSA was utilized for CO and CO₂ removal25. Not only the process, but also the potential of novel adsorbents for gas separation applications can be tested, including activated carbon from waste materials17,29, and MOFs13,30.
Overall, the breakthrough experiments and PSA operation provide a comprehensive evaluation of an adsorbent’s suitability for hydrogen purification. The demonstrated methodology can be readily adapted to other adsorbents, pressures, temperatures, and gas mixtures. The VPSA cycle structure shown in this protocol can also be extended to include additional steps, such as pressure equalization or layered adsorbent beds, to improve efficiency. Optimally integrating material properties with process configuration is key to achieving effective separation performance. Establishing this optimal material–process relationship not only enhances performance but also stimulates innovation in adsorption-based separations.
Offenlegungen
The authors declare no conflicts of interest.
Danksagungen
The Research Council of Norway (project 333151, FME-HyValue) is kindly acknowledged for financial support, and this publication is funded by the Norwegian Directorate for Higher Education and Skills under the program UTFORSK through the project HyTack: “Tackling the Challenges in Hydrogen Economy through Education and Research” (project number UTF-2021/10198).
Materialien
| Name | Unternehmen | Katalognummer | Kommentare |
|---|---|---|---|
| Ball valves (2-way and 3-way) and fittings | Swagelok | - | All valves and fittings are stainless steel and fitted to 1/4" stainless steel tubing. Valves are helium leak tested at a pressure of 1 × 10⁻⁴ Torr. The maximum allowable leak rate is 4 × 10⁻⁹ std cm3/s. The VCR fitting design has been helium leak tested to a maximum leak rate of 4 × 10⁻⁹ std cm3/s with silver-plated. |
| Carbon Dioxide | Nippon | Grade 5.0 | |
| Direct-acting 2-way standard proportional valve | Buerkert | Type 2871, operating pressure up to 10 bar, orifice 0.3 mm, accuracy <0.25% full scale (FS), sensitivity < 0.25% FS, -10 °C…+ 90 °C (with FKM) | |
| Flow vision MX- 1.4.15 (FlowMX) software | Alicat | To control the MFCs | |
| FlowVision v2.1.3 software | Alicat | To get the product stream flow rate data | |
| Helium | Nippon | Grade 5.0 | |
| Hydrogen | Nippon | Grade 5.0 | |
| Mass Flow Controllers (MFC) | Alicat | - | MC series, Range 0 -2 SLPM, ±0.32% uncertainity |
| Mass Flow Meters (MFM) | Alicat | - | MS series, Range 0 -2 SLPM, ±0.32% uncertainity |
| Mass Spectrometer, GSD 350 OminiStar | Pfeiffer Vacuum | - | Mass range 1 - 100 / 1 - 200 / 1 - 300 u, Detection limit < 100 ppb, Gas flow rate 1 - 2 sccm |
| MZ 2 NTDiaphragm pump | VACUUBRAND | Ultimate vacuum = 7 mbar | |
| Pressure Swing Adsorption (PSA) Setup | Amnis Pura | - | Custom build (up to 10 barg) |
| Pressure Transmittor | ifm electronic | Analogue output, pressure measurement = 0 to 10 bar | |
| PV MassSpec software | Pfeiffer Vacuum | Analyze the gas composition in the product stream | |
| Tubes | Swagelok | 1/4 in OD, 0 049 in. tube wall | |
| Type K Mineral Insulated Thermocouple | RS | 262-3266 | 150 mm Length, 1.5 mm Diameter, -40 °C → 1100 °C Max |
| VENTI-Line®, Drying Ovens with Forced Convection | VWR | - | Temperature range = 50 - 300 °C |
| Weighing balance | VWR | 611-4797 | Weighing capacity:220 g, Readability:0,1 mg, Linearity: ±0,2 mg |
| Zeolite 5A | Thermo Fisher Scientific | 197295000 | Table 1 provides further details on the material |
Referenzen
- Sircar S, Golden T. Purification of hydrogen by pressure swing adsorption. Separation Science and Technology. 2000;35(5):667-87.
- Lider A, et al. Materials and techniques for hydrogen separation from methane-containing gas mixtures. International Journal of Hydrogen Energy. 2023;48(73):28390-411.
- Skarstrom CW, inventor; Google Patents, assignee. Method and apparatus for fractionating gaseous mixtures by adsorption, 1960.
- Shabbani HJK, Othman MR, Al-Janabi S, Barron A, Helwani Z. H2 purification employing pressure swing adsorption process: Parametric and bibliometric review. International Journal of Hydrogen Energy. 2024;50:674-99.
- Ruthven DM, Farooq S, Knaebel KS. Pressure swing adsorption: John Wiley & Sons; 1996.
- Ganesan S, Canevesi RL, Grande CA. Pressure Swing Adsorption Configurations for Simultaneous Production of High-Purity Biomethane and Carbon Dioxide from Biogas. Industrial & Engineering Chemistry Research. 2024;63(43):18497-512.
- Wu W, et al. A high-productivity PSA process configuration for H2 purification. Fuel. 2024;356:129566.
- Yang J, Lee C-H, Chang J-W. Separation of hydrogen mixtures by a two-bed pressure swing adsorption process using zeolite 5A. Industrial & engineering chemistry research. 1997;36(7):2789-98.
- Delgado JA, Agueda VI, Uguina MA, Sotelo JL, Brea P. Hydrogen recovery from off-gases with nitrogen-rich impurity by pressure swing adsorption using CaX and 5A zeolites. Adsorption. 2015;21(1):107-23.
- Divekar S, et al. Recovery of hydrogen and carbon dioxide from hydrogen PSA tail gas by vacuum swing adsorption. Separation and Purification Technology. 2021;254:117113.
- Park Y, Kang J-H, Moon D-K, Jo YS, Lee C-H. Parallel and series multi-bed pressure swing adsorption processes for H2 recovery from a lean hydrogen mixture. Chemical Engineering Journal. 2021;408:127299.
- Yang J, Han S, Cho C, Lee C-H, Lee H. Bulk separation of hydrogen mixtures by a one-column PSA process. Separations Technology. 1995;5(4):239-49.
- Jamali S, Mofarahi M, Rodrigues AE. Investigation of a novel combination of adsorbents for hydrogen purification using Cu-BTC and conventional adsorbents in pressure swing adsorption. Adsorption. 2018;24(5):481-98.
- Al-Naddaf Q, Rownaghi AA, Rezaei F. Multicomponent adsorptive separation of CO2, CO, CH4, N2, and H2 over core-shell zeolite-5A@ MOF-74 composite adsorbents. Chemical Engineering Journal. 2020;384:123251.
- Regufe MJ, et al. Syngas purification by porous amino-functionalized titanium terephthalate MIL-125. Energy & Fuels. 2015;29(7):4654-64.
- Lopes FV, Grande CA, Rodrigues AE. Fast-cycling VPSA for hydrogen purification. Fuel. 2012;93:510-23.
- Shamsudin I, Abdullah A, Idris I, Gobi S, Othman M. Hydrogen purification from binary syngas by PSA with pressure equalization using microporous palm kernel shell activated carbon. Fuel. 2019;253:722-30.
- HyGear. Hy.GEN®: Steam Methane Reforming [Available from: https://hygear.com/solutions/hydrogen-production/hygen/.
- HyGear. Hydrogen production: SMR technology [Available from: https://hygear.com/technology/steam-methane-reforming/.
- Ahn S, et al. Layered two-and four-bed PSA processes for H2 recovery from coal gas. Chemical engineering science. 2012;68(1):413-23.
- Nguyen TT, Lin J-B, Shimizu GK, Rajendran A. Separation of CO2 and N2 on a hydrophobic metal organic framework CALF-20. Chemical Engineering Journal. 2022;442:136263.
- Wilkins NS, Rajendran A, Farooq S. Dynamic column breakthrough experiments for measurement of adsorption equilibrium and kinetics. Adsorption. 2021;27(3):397-422.
- Li H, et al. Modelling and simulation of two-bed PSA process for separating H2 from methane steam reforming. Chinese Journal of Chemical Engineering. 2019;27(8):1870-8.
- Grande CA. Advances in pressure swing adsorption for gas separation. International Scholarly Research Notices. 2012;2012(1):982934.
- Van Acht S, et al. Simulation of integrated novel PSA/EHP/C process for high-pressure hydrogen recovery from Coke Oven Gas. International Journal of Hydrogen Energy. 2020;45(30):15196-212.
- Shi W, et al. Two-stage PSA/VSA to produce H2 with CO2 capture via steam methane reforming (SMR). International Journal of Hydrogen Energy. 2018;43(41):19057-74.
- Kang J-H, Ko Y, Jung MY, Lee C-H. Industrial-scale 12-layered-bed vacuum pressure swing adsorption for fuel cell-grade H2 production from carbon-captured steam methane reforming syngas. Chemical Engineering Journal. 2024;499:156068.
- Yáñez M, et al. PSA purification of waste hydrogen from ammonia plants to fuel cell grade. Separation and Purification Technology. 2020;240:116334.
- Mammarella D, Gallucci K, Di Giuliano A. Biochar from Waste Vineyard Pruning as a CO2 Sorbent in Pressure Swing Adsorption: Experimental and Modeling Study. ACS omega. 2025;10(24):25394-404.
- Li C, et al. Equilibrium and dynamic adsorption characteristics of zeolite 5A, LiX, 13X and MOF UTSA-16 adsorbents for hydrogen purification. International Journal of Hydrogen Energy. 2025;140:889-99.
Nachdrucke und Genehmigungen
Dieser Artikel wurde veröffentlicht
Video demnächst verfügbar