This study describes a cross-sectional assessment of workload, trauma exposure, adaptive coping, compassion satisfaction, and compassion fatigue among emergency-department nurses. It also compares logistic regression, Random Forest, and Support Vector Machine classifiers for exploratory internal evaluation rather than clinical or employment use.
Forschungsartikel
Compassion Fatigue in Emergency Department Nurses: A Cross-Sectional Evaluation of Predictive Models
In diesem Artikel
Zusammenfassung
Zusammenfassung
Compassion fatigue (CF) is a potential risk for Emergency Department (ED) nurses when workload increases, they experience repeated exposure to trauma or have a long-term emotional burden. A cross-sectional study was conducted to explore the connection between workload, trauma exposure, coping, and compassion satisfaction, and to assess the performance of logistic regression, Random Forest, and Support Vector Machine for internal binary classification. The sample included 150 full-time registered ED nurses from three tertiary hospitals, who completed a structured self-administered questionnaire. The analyses encompassed descriptive statistics, group comparisons, multiple linear regression, train-test split (80:20), and stratified five-fold cross-validation. The relationships between workload and trauma exposure were positive (r = 0.75 and r = 0.62, respectively), while the relationships between coping mechanisms and compassion satisfaction were negative (r = −0.52 and r = −0.60, respectively) with CF. The four-predictor regression model explained most of the variance in CF (adjusted R2 = 0.852), with coping and compassion satisfaction being the strongest negative predictors (β = −0.25; β = −0.35), and trauma exposure and workload being the strongest positive predictors (β = 0.32; β = 0.42). Random Forest outperformed Support Vector Machine (accuracy 83%, ROC-AUC 0.83) and logistic regression (accuracy 80%, ROC-AUC 0.80) in terms of internal classification (accuracy 85%, precision 82%, recall 80%, F1-score 81%, ROC-AUC 0.84). These findings suggest that the following interventions can be used to reduce compassion fatigue among ED nurses: workload management, trauma-informed support, coping, and compassion satisfaction.
Einleitung
Compassion fatigue (CF) may involve emotional exhaustion, reduced motivation, and distress after continued exposure to the suffering or trauma of others. It is related to secondary traumatic stress and burnout, whereas compassion satisfaction refers to the positive fulfillment gained from helping others1,2,3. Emergency-department practice involves rapid decisions, unpredictable patient flow, severe illness and injury, workplace violence, and frequent contact with distressed patients and families. Workload, work environment, social support, job satisfaction, and psychological resources have been identified as important correlates of CF in emergency and other high-intensity nursing settings4,5.
Workload was understood as the perceived overall demand arising from patient volume and acuity, interruptions, documentation requirements, staffing limitations, shift intensity, and cognitive-emotional demands. This multidimensional definition was used throughout the study because these demands have been linked with professional quality of life, perceived quality of care, and CF6,7,8. Trauma exposure was defined as the perceived frequency and intensity of encounters with severe injury, death, violence, or patient suffering. Workload and trauma exposure were treated as risk-associated factors, while adaptive coping and compassion satisfaction were treated as protective-associated factors. Organizational support and psychological resources have also been linked with lower CF; however, cross-sectional evidence cannot establish whether measures intended to prevent, mitigate, or treat CF caused those differences9,10.
Conventional regression remains useful because it estimates adjusted directions, magnitudes, and uncertainty under explicit assumptions. Machine-learning classifiers can represent nonlinear decision boundaries and interactions, but flexible algorithms may overfit small samples and can be less transparent. Therefore, preprocessing, internal validation, calibration, interpretability, uncertainty, and external validation should be reported before predictive performance is considered practically useful11,12. The literature gap had two related parts: identifying which of the four theory-based factors had the strongest relationship with CF and comparing logistic regression, Random Forest, and Support Vector Machine when classifying the retained binary CF outcome within this sample. The four prespecified inputs were workload, trauma exposure, coping-mechanism score, and compassion-satisfaction score. The models were intended for exploratory internal comparison and hypothesis generation, not diagnosis, disciplinary action, or automatic employment decisions11,13.
Logistic regression offers coefficient-based interpretation, whereas Random Forest and Support Vector Machine require additional interpretability procedures. Because the present study was cross-sectional, the models classified a contemporaneous study label and did not predict when an individual would develop CF. The analysis, therefore, focused on adjusted associations and internal model performance without claiming clinical utility or real-time risk stratification14.
Nursing theoretical framework
Figley compassion stress and fatigue model
Figley explained that caring for people affected by suffering and trauma may carry the cost of compassion fatigue. When opportunities for recovery are inadequate, repeated exposure to distress and continuing caregiving demands may lead to compassion stress1,2.
Stamm professional quality-of-life framework
Stamm's Professional Quality of Life framework separates the positive aspect of caregiving, compassion satisfaction, from adverse dimensions such as burnout and secondary traumatic stress3. This framework allows risk and protective factors to be considered together rather than treating workload as the only cause of CF. We combined the Figley and Stamm frameworks to create Figure 1. In this study, workload and trauma exposure were treated as risk-associated factors, whereas adaptive coping and compassion satisfaction were treated as protective-associated factors.
Study novelty
The study integrates the Figley Compassion Stress and Fatigue Model and the Stamm Professional Quality of Life framework within a prespecified analytical framework that jointly evaluates workload, trauma exposure, coping mechanisms, and compassion satisfaction. Using identical theory-based predictors, the study compares an interpretable logistic regression model with Random Forest and Support Vector Machine classifiers while reporting both adjusted associations and internal predictive performance. The study, therefore, provides a theory-integrative and methodologically transparent framework for evaluating compassion fatigue in emergency department nurses that can serve as a foundation for future prospective validation.
Protokoll
The study was conducted in accordance with the Declaration of Helsinki and was approved by Deyang People's Hospital and the University of Chinese Academy of Sciences. The participants signed informed consent forms, understood the purpose of the study, and recognized that participation was voluntary. They were free to withdraw at any time. To avoid data breaches, all collected data were anonymized. The research ensured that the subjects were not engaged in any activity that could harm their well-being or health, and that their participation in the study did not harm their well-being or professional reputation. Figure 2 shows the protocol workflow.
Study design and setting
The cross-sectional survey was conducted in the emergency departments of three tertiary hospitals. All CF-related variables were measured at one time point, adjusted associations were estimated, and predictive models were compared internally. Reporting was organized according to the STROBE statement15.
Participant recruitment and eligibility
A total of 150 full-time registered nurses employed at three tertiary care hospitals were included. Nurses were eligible if they worked in an emergency department, had at least 1 year of ED experience, and provided informed consent. Observers, students, nurses working outside the ED, nurses with less than 1 year of ED experience, duplicate submissions, and questionnaires without the primary outcome were excluded.
Measurement instrument and scoring
A self-administered structured questionnaire was used to collect demographic information and numerical ratings. The content domains were informed by the Figley and Professional Quality of Life frameworks. Gender was coded categorically, age continuously, and ED experience as an ordinal grouping variable. The four prespecified predictors and the CF outcome were coded according to the ranges reported in Table 1. Complete item wording, expert content review, pilot testing, factor analysis, criterion validity, test-retest reliability, and internal-consistency coefficients were retained. The study-specific scores were therefore interpreted as exploratory operational measures rather than validated clinical constructs.
Materials and analytical resources
The questionnaire, consent form, electronic data-capture file, data dictionary, analysis script, and supporting workbook were prepared for data collection and analysis. Software versions and analytical resources are listed in the Table of Materials.
Questionnaire administration and quality control
Participants completed the questionnaire independently online using standardized instructions. Duplicate submissions, implausible ages, invalid category labels, missing primary outcomes, and scores outside the permitted ranges were checked. Any confirmed corrections were recorded in an audit trail, and range or coding errors were resolved before model fitting.
Data preparation and missing-data handling
Records without the primary CF outcome were excluded. Within each training fold, continuous and ordinal predictors were imputed with the training-fold median, while categorical predictors were imputed with the training-fold mode. Categorical variables were represented with one-hot indicators. Continuous predictors were standardized using training data for logistic regression and Support Vector Machine, and the fitted transformation was then applied to validation and test data. Random Forest predictors were not scaled. No additional feature engineering, dimensionality reduction, or derived interaction variables were performed; all analyses used the four prespecified theory-based predictors.
Data analysis
Data analysis consisted of two stages: descriptive statistical analysis and predictive modeling. Descriptive statistics were used to summarize participant characteristics and the distributions of compassion fatigue, workload, trauma exposure, coping mechanisms, and compassion satisfaction. Correlation analysis was performed to examine associations between the study variables.
Three supervised classification algorithms—Random Forest, Support Vector Machine (SVM), and Logistic Regression—were implemented to develop predictive models. The dataset was randomly partitioned, with 80% allocated for model training and the remaining 20% reserved for independent testing. During model development, five-fold cross-validation was applied to the training subset to optimize hyperparameters and minimize overfitting. Model performance was subsequently assessed using the test dataset based on accuracy, precision, recall, F1-score, and the area under the receiver operating characteristic curve (AUC-ROC). The analytical workflow was implemented using the software and libraries listed in the Table of Materials.
Descriptive and inferential analysis
Categorical variables were described using frequencies and percentages, while continuous variables were summarized by their means and standard deviations. For the dataset, ANOVA assumptions were evaluated using group-specific Shapiro-Wilk tests, Q-Q plots, and Levene's test. Significant omnibus ANOVA results were followed by Tukey HSD comparisons with familywise error-rate control. Differences among coping categories were assessed using the Kruskal-Wallis test, followed by Dunn pairwise comparisons with Bonferroni adjustment. Eta-squared and epsilon-squared were used to measure effect sizes. The multiple regression model reported R2, adjusted R2, the overall F test, standardized regression coefficients with 95% confidence intervals, variance inflation factors, tolerance values, and residual diagnostics covering normality, homoscedasticity, independence, and influential observations.
Predictive model development
Workload, trauma exposure, coping mechanisms, and compassion satisfaction were specified in advance as the four model inputs. None were removed because of their observed correlation with another predictor, as the variables were theory-based and no pairwise coefficient indicated perfect collinearity. Demographic variables were included in the primary classifiers because the stated objective concerned the four prespecified psychosocial and work-related factors.
The data were divided into an 80:20 stratified training-test split using random seed 42. Within the training set, stratified five-fold cross-validation was used, with imputation, encoding, and scaling performed inside each fold. Logistic regression was evaluated with L2 regularization and C values of 0.1, 1, and 10. Random Forest settings included 200 or 500 trees, maximum depth of None, 3, or 5, minimum leaf size of 1, 3, or 5, and square-root feature sampling. A radial-basis-function Support Vector Machine was evaluated with C values of 0.1, 1, and 10 and gamma values of “scale”, 0.1, and 0.01. Balanced class weights were used if class imbalance was present. Mean cross-validated ROC-AUC ranked candidate settings, and the selected setting was assessed once on the held-out test set.
Logistic regression was selected as an interpretable linear benchmark, Random Forest as a nonlinear tree-based model, and Support Vector Machine as a nonlinear margin-based model. Boosting, neural networks, and unsupervised methods were not assessed because the task was supervised binary classification and the sample contained only 150 records with four prespecified predictors.
Model evaluation
Accuracy, precision, recall, F1-score, and ROC-AUC were used to evaluate the model. The reported ordering of predictor strengths was compared with the multiple regression coefficients and pairwise correlations. A confusion matrix, confidence intervals, calibration curve, and alternative decision thresholds were not reconstructed from rounded summary metrics. Because the binary threshold, participant-level predictions, and trained model objects were retained, performance is presented as an aggregate internal result, consistent with TRIPOD+AI reporting priorities16.
Interpretive safeguards
The models were used only for internal comparison. Model outputs were not used for diagnosis, disciplinary action, employment decisions, or automatic workforce screening.
Ergebnisse
Participant and study population
The analytical sample included 150 emergency department nurses with a mean age of 32.0 years (SD = 5.2). Ninety participants (60.0%) were men, and 60 (40.0%) were women. Fifty nurses (33.3%) had 1–5 years of ED experience, 60 (40.0%) had 6–10 years, and 40 (26.7%) had 11–15 years. Mean workload and trauma-exposure scores were toward the upper parts of their study-specific ranges, while coping, compassion satisfaction, and CF scores were near the middle of their respective ranges (Table 2).
Questionnaire outcome and the study variables correlations
Pairwise correlations are shown in Figure 3. CF was positively correlated with workload (r = 0.75) and trauma exposure (r = 0.62). Workload was also positively correlated with trauma exposure (r = 0.68). CF was inversely correlated with coping mechanisms (r = −0.52) and compassion satisfaction (r = −0.60), while coping mechanisms were positively correlated with compassion satisfaction (r = 0.60). All reported correlations had p < 0.001. These pairwise coefficients do not represent interactions, multivariable effects, or causation.
Data quality and preparation
Assumptions were met for the one-way ANOVA, with group-specific Shapiro-Wilk p-values ranging from 0.196 to 0.526 and Levene's test indicating homogeneity of variance, F (2,147) = 1.34, p = 0.266. Compassion fatigue differed across ED-experience groups, F (2,147) = 5.14, p = 0.007, eta-squared = 0.065, as shown in Table 3. Tukey HSD pairwise comparisons showed that the mean compassion-fatigue score was higher in the 11-15-year group than in the 1-5-year group (mean difference = 0.86, adjusted p = 0.005), whereas no other pairwise differences were significant. Compassion fatigue also differed across coping categories, χ2 (2) = 26.81, p < 0.001, η2 = 0.169. Dunn tests with Bonferroni adjustment showed lower compassion-fatigue scores in the high-coping group than in the low-coping group (adjusted p < 0.001) and the moderate-coping group (adjusted p < 0.001). In contrast, the low- and moderate-coping groups did not differ significantly (adjusted p = 0.668), as shown in Table 4 and Figure 4.
Descriptive and inferential results
Mean compassion fatigue was 4.72 among nurses with 1–5 years of ED experience, 5.09 among those with 6-10 years, and 5.58 among nurses with 11–15 years of ED experience, as shown in Figure 5. Workload and trauma-exposure scores increased across the experience groups, whereas coping scores were slightly lower in the most-experienced group, as shown in Table 5 and Figure 5. These descriptive values are based on the N = 150 analysis and do not indicate a causal effect.
Coping mechanisms and compassion fatigue
Mean compassion fatigue was highest in the low-coping group (5.71) and lowest in the high-coping group (4.24). Mean compassion-satisfaction scores were 4.00 in the low-coping group and 5.13 in the high-coping group (Table 6 and Figure 6). This pattern is consistent with an inverse relationship between adaptive coping and compassion fatigue; however, it does not provide evidence of an intervention effect.
Model Evaluation Results
The four-predictor multiple regression model, as shown in Table 7, was statistically significant (R2 = 0.856, adjusted R2 = 0.852; F (4, 145) = 215.16, p < 0.001). Workload showed the largest positive standardized association with compassion fatigue (β = 0.419), followed by trauma exposure (β = 0.323). Coping mechanisms (β = -0.247) and compassion satisfaction (β = -0.350) were negatively associated with compassion fatigue, as presented in Table 8 and Figure 7. Variance inflation factors ranged from 1.33 to 1.45, and tolerance values ranged from 0.69 to 0.75, indicating no serious multicollinearity. As shown in Table 7 and Figure 8, residual diagnostics were satisfactory: Shapiro-Wilk W = 0.983, p = 0.059; Breusch-Pagan p = 0.278; Durbin-Watson = 1.97; and maximum Cook's distance = 0.063.
Predictive model performance
As shown in Table 9 and Figure 9, Random Forest had the highest reported internal performance, with an accuracy of 85%, a precision of 82%, a recall of 80%, an F1-score of 81%, and an ROC-AUC of 0.84. Support Vector Machine achieved an accuracy of 83% and ROC-AUC of 0.83, while logistic regression achieved an accuracy of 80% and ROC-AUC of 0.80. The numerical differences were small and were not accompanied by confidence intervals, fold-level distributions, calibration, or external validation; therefore, they do not establish superiority of Random Forest in other hospitals or populations.
The reported standardized predictor strengths were workload (0.42), compassion satisfaction (0.33 in the inverse direction), trauma exposure (0.31), and coping mechanisms (0.28 in the inverse direction). This ordering agreed with the pairwise and adjusted analyses: workload and trauma exposure were risk-associated, while compassion satisfaction and coping mechanisms were protective-associated.
Data Availability
The authors declare that all data supporting this study are included in the manuscript and Supplementary Table S1.
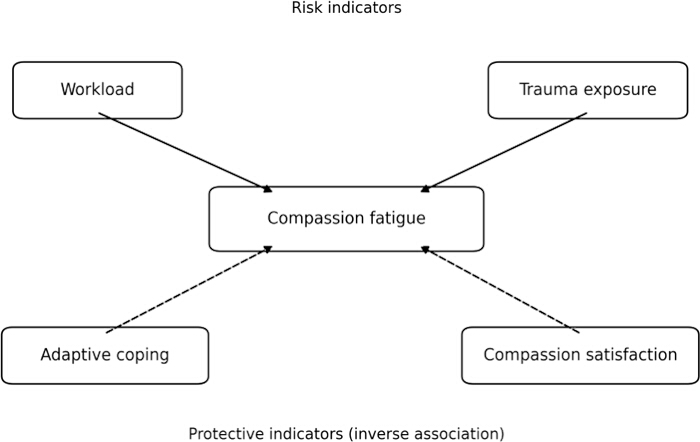
Figure 1. Conceptual framework developed by combining the Figley Compassion Stress and Fatigue Model with the Stamm Professional Quality-of-Life framework. Solid arrows represent risk-associated pathways from workload and trauma exposure, while dashed arrows represent inverse protective-associated pathways involving adaptive coping and compassion satisfaction. Please click here to view a larger version of this figure.
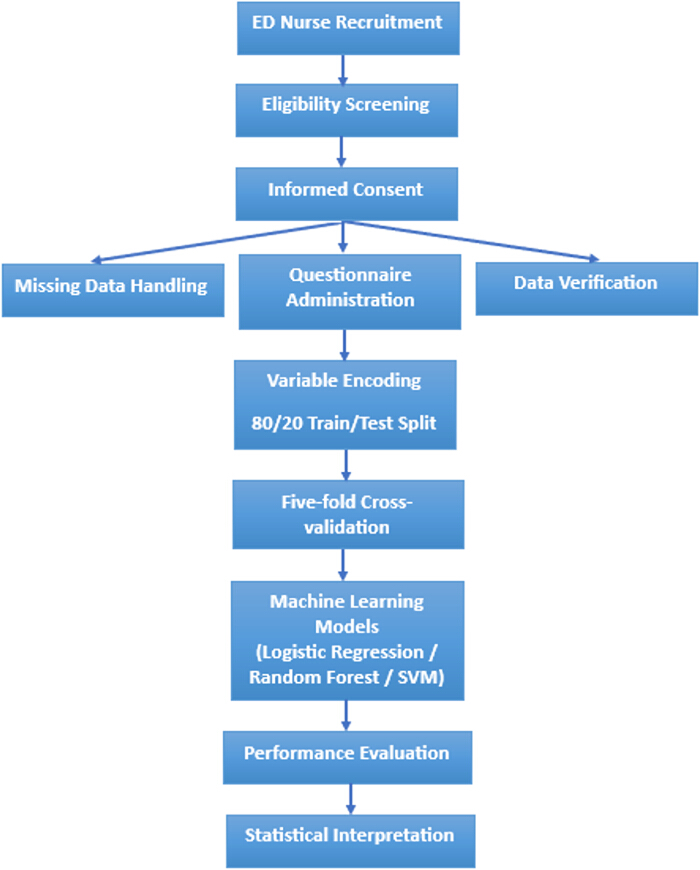
Figure 2. Workflow of the experimental protocol. Please click here to view a larger version of this figure.
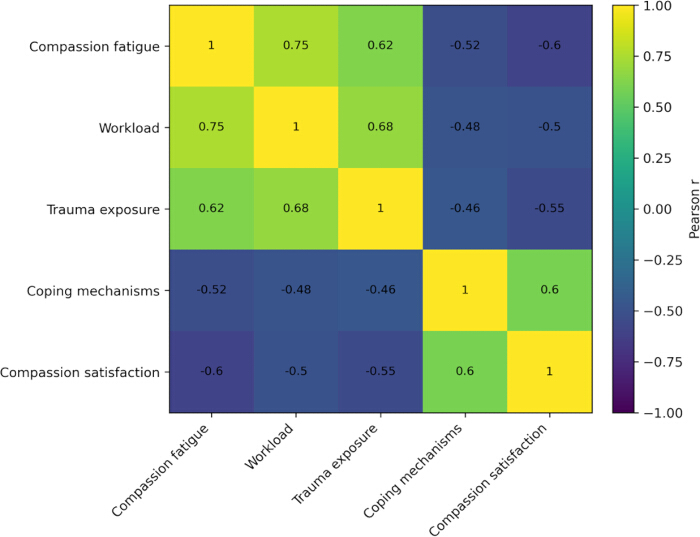
Figure 3. Pairwise correlation heatmap for CF, workload, trauma exposure, coping mechanisms, and compassion satisfaction. Positive values indicate direct pairwise associations and negative values indicate inverse pairwise associations; all displayed correlations had p < 0.001. Please click here to view a larger version of this figure.
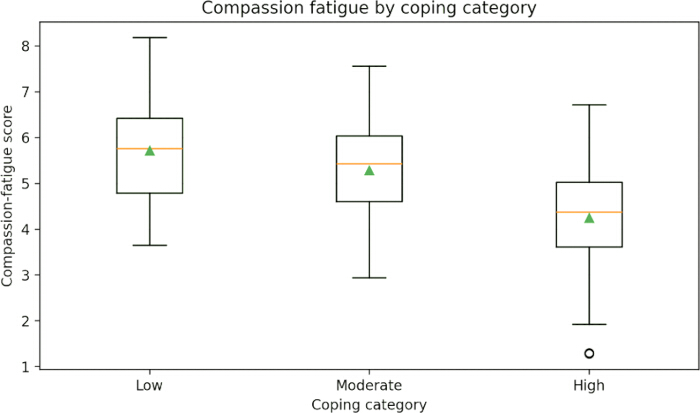
Figure 4. Distribution of compassion-fatigue scores across low, moderate, and high coping categories. Please click here to view a larger version of this figure.
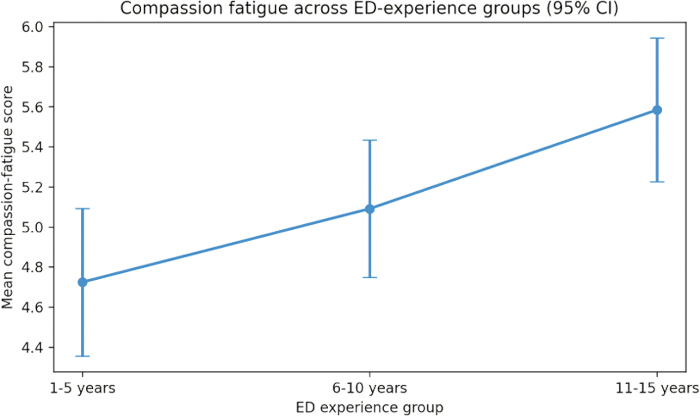
Figure 5. Mean compassion-fatigue scores across ED-experience groups with 95% confidence intervals. Please click here to view a larger version of this figure.
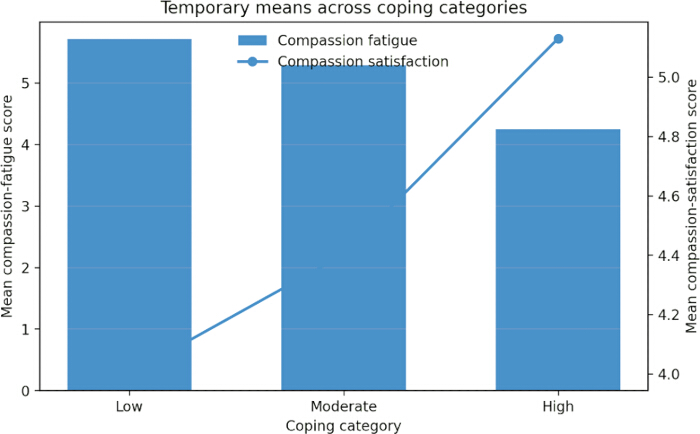
Figure 6. Comparison of mean compassion-fatigue and compassion-satisfaction scores across coping categories. Please click here to view a larger version of this figure.
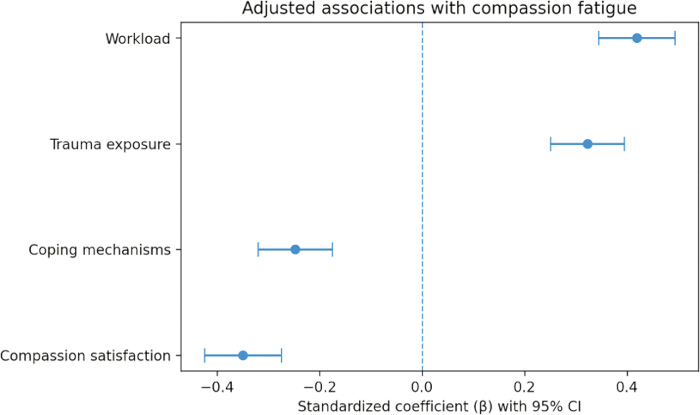
Figure 7. Standardized regression coefficients with 95% confidence intervals. Please click here to view a larger version of this figure.
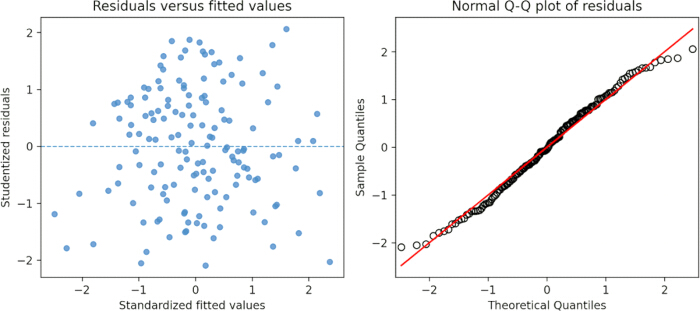
Figure 8. Residual-versus-fitted and normal Q-Q diagnostic plots for the four-predictor regression model. Please click here to view a larger version of this figure.
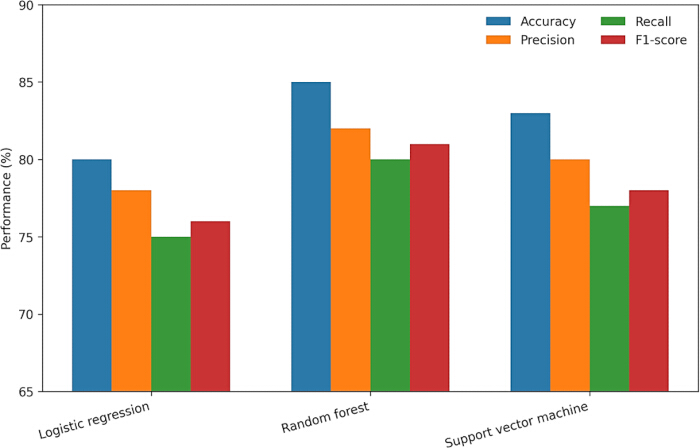
Figure 9. Visual comparison of accuracy, precision, recall, and F1-score across the three classifiers. Please click here to view a larger version of this figure.
| Variable | Operational definition | Scale and direction | Analytical role |
| Gender | Self-reported gender category | Male/Female as reported; categorically encoded | Demographic descriptor |
| Age | Age at study time | Years; continuous | Demographic descriptor |
| ED experience | Completed years working in emergency nursing | 1–5, 6–10, or 11–15 years | Group variable |
| Workload | Perceived cumulative demand from patient volume, acuity, interruptions, documentation, staffing constraints, shift intensity, and cognitive-emotional load | 1–10; high scores indicate high workload | Primary predictor |
| Trauma exposure | Perceived frequency and intensity of encounters with severe injury, death, violence, and patient suffering | 1–10; high scores indicate high exposure | Primary predictor |
| Coping mechanisms | Frequency and effectiveness of adaptive stress-management responses, including support seeking, reflective processing, and recovery practices | 1–5; high scores indicate more adaptive coping | Primary predictor |
| Compassion satisfaction | Positive fulfillment derived from helping patients and performing meaningful nursing work | 1–7; high scores indicate high satisfaction | Primary predictor |
| Compassion fatigue | Study-specific rating of emotional exhaustion, reduced empathic capacity, and distress related to caregiving | 1–10; higher scores indicate greater CF | Primary outcome |
| Binary CF label | Binary outcome used for model comparison | Exact cut-point was not retained | Exploratory classification target |
Table 1: Definitions, score ranges, coding directions, and analytical roles for demographic descriptors, the four prespecified predictors, the continuous CF outcome, and the source binary CF label. The 1-10 CF score was derived from the study-specific questionnaire and was not calculated using the ProQOL instrument; it is used as guidance. The original analysis reported a binary CF outcome; however, because the numerical threshold used to define that outcome was not retained in the available study records, threshold-dependent classification metrics are presented only as exploratory internal results and should not be interpreted as clinically validated risk estimates. Abbreviations: CF = compassion fatigue; ProQOL = Professional Quality of Life.
| Characteristic | Category/value | n | % | Mean | SD |
| Gender | Male | 90 | 60 | - | - |
| Gender | Female | 60 | 40 | - | - |
| Age (years) | Overall | - | - | 32 | 5.2 |
| ED experience | 1–5 years | 50 | 33.3 | - | - |
| ED experience | 6–10 years | 60 | 40 | - | - |
| ED experience | 11–15 years | 40 | 26.7 | - | - |
| Workload | 1–10 scale | - | - | 7.8 | 1.4 |
| Trauma exposure | 1–10 scale | - | - | 6.5 | 1.2 |
| Coping mechanisms | 1–5 scale | - | - | 3.2 | 0.7 |
| Compassion satisfaction | 1–7 scale | - | - | 4.5 | 1.1 |
| Compassion fatigue | 1–10 scale | - | - | 5.1 | 1.3 |
Table 2: Demographic and work-related characteristics of the 150 ED nurses, reported as counts, percentages, means, and standard deviations as applicable.
| Analysis | Statistic | p value(s) | Interpretation |
| Shapiro-Wilk by ED-experience group | W = 0.968, 0.981, 0.975 | p = 0.196, 0.463, 0.526 | Normality acceptable |
| Levene test | F (2,147) = 1.34 | p = 0.266 | Equal variances supported |
| One-way ANOVA | F (2,147) = 5.14 | p = 0.007 | eta-squared = 0.065 |
| Kruskal-Wallis | H (2) = 26.81 | p < 0.001 | epsilon-squared = 0.169 |
Table 3: Assumption checks and omnibus group-comparison results for the N = 150 dataset.
| Method | Comparison | Effect/statistic | Adjusted p | Significant |
| Tukey HSD | 1 vs 2 | 0.367 | 0.2878 | No |
| Tukey HSD | 1 vs 3 | 0.86 | 0.0047 | Yes |
| Tukey HSD | 2 vs 3 | 0.493 | 0.1394 | No |
| Dunn-Bonferroni | 1 vs 2 | z = 1.219 | 0.668 | No |
| Dunn-Bonferroni | 1 vs 3 | z = 4.905 | <0.001 | Yes |
| Dunn-Bonferroni | 2 vs 3 | z = 4.024 | <0.001 | Yes |
Table 4: Pairwise post-hoc comparisons with multiplicity-adjusted p-values
| Experience group | n | Mean CF | Mean workload | Mean trauma exposure | Mean coping |
| 1-5 years | 50 | 4.72 | 7.33 | 6.34 | 3.3 |
| 6-10 years | 60 | 5.09 | 8.01 | 6.35 | 3.21 |
| 11-15 years | 40 | 5.58 | 8.07 | 6.93 | 3.07 |
Table 5: Group sizes and mean compassion-fatigue, workload, trauma-exposure, and coping scores across ED-experience groups.
| Coping category | n | Mean CF | Mean workload | Mean trauma exposure | Mean compassion satisfaction |
| Low | 45 | 5.71 | 7.86 | 6.57 | 4 |
| Moderate | 60 | 5.28 | 8.12 | 6.51 | 4.4 |
| High | 45 | 4.24 | 7.3 | 6.42 | 5.13 |
Table 6: Group sizes and mean compassion-fatigue, workload, trauma-exposure, and compassion-satisfaction scores across coping categories.
| Component | Statistic | Interpretation |
| Model fit | R2 = 0.856; adjusted R2 = 0.852 | F (4, 145) = 215.16, p < 0.001 |
| Residual normality | Shapiro-Wilk W = 0.983 | p = 0.059 |
| Homoscedasticity | Breusch-Pagan LM = 5.09 | p = 0.278 |
| Error independence | Durbin-Watson = 1.97 | Acceptable |
| Influential observations | Maximum Cook's distance = 0.063 | No highly influential case |
Table 7: Overall regression model fit and diagnostic statistics for the N = 150 dataset.
| Predictor | Standardized beta (SE) | 95% CI | p value | VIF | Tolerance |
| Workload | 0.419 (0.038) | [0.344, 0.494] | <0.001 | 1.44 | 0.7 |
| Trauma Exposure | 0.323 (0.036) | [0.251, 0.394] | <0.001 | 1.33 | 0.75 |
| Coping Mechanisms | -0.247 (0.037) | [-0.320, -0.175] | <0.001 | 1.35 | 0.74 |
| Compassion Satisfaction | -0.350 (0.038) | [-0.425, -0.274] | <0.001 | 1.45 | 0.69 |
Table 8: Standardized regression coefficients, 95% confidence intervals, p values, variance inflation factors, and tolerance values for the four-predictor model.
| Model | Accuracy (%) | Precision (%) | Recall (%) | F1-score (%) | AUC-ROC |
| Logistic regression | 80 | 78 | 75 | 76 | 0.8 |
| Random Forest | 85 | 82 | 80 | 81 | 0.84 |
| Support Vector Machine | 83 | 80 | 77 | 78 | 0.83 |
Table 9: Reported aggregate accuracy, precision, recall, F1-score, and ROC-AUC for logistic regression, Random Forest, and Support Vector Machine.
Supplementary Table S1: Dataset supporting the study. Please click here to download this file.
Diskussion
This study evaluated four theory-based factors and compared three classifiers in an internal assessment of ED nurses. Workload and trauma exposure were positively related to CF, whereas adaptive coping and compassion satisfaction were inversely related. Workload was the strongest risk-associated signal and represented a multidimensional ED demand rather than simply being busy4,5,14.
The relationship with trauma exposure is clinically plausible because emergency nurses often encounter severe injury, death, violence, and time-critical care. Recent syntheses and emergency-nursing studies also identify workload, trauma-related demands, and adverse work conditions as important correlates of CF17. Recent nursing evidence also supports inverse relationships of coping, psychological resources, and organizational support with CF. The present cross-sectional findings do not show that increasing coping or compassion satisfaction will reduce CF; prevention, mitigation, and treatment strategies require prospective evaluation9,10,17,18,19,20.
The observed performance differences were small, based on 150 observations, and were not supported by uncertainty intervals, calibration, or external testing. The findings, therefore, permit an internal comparison but do not establish the superiority of one algorithm. TRIPOD+AI emphasizes complete reporting of data handling, model specification, validation, calibration, and performance uncertainty11.
Critical methodological steps included preserving the original scoring rules and binary threshold, performing imputation, encoding, and scaling entirely within training folds, stratifying the folds, and restricting model complexity. Scaling is needed for logistic regression and Support Vector Machine, but not for Random Forest. Hyperparameter tuning and scaling can reduce avoidable overfitting, but they cannot overcome the uncertainty created by a sample of 15016,21.
Operational use would require the four prespecified variables to be measured, a clinically meaningful and prespecified threshold, formal calibration assessment, subgroup performance assessment, confidential supportive follow-up, secure governance, and protection from punitive use. Logistic regression offers coefficient-based interpretation, whereas Random Forest and Support Vector Machine require additional explainability procedures. Cross-sectional classification cannot establish future individual risk16,22,23,24.
There were several limitations to this study. Because of the cross-sectional design of the study, causal or temporal inferences of the observed relationships are not possible. The generalizability of the data is limited to three tertiary hospitals in a single region, with convenience sampling of 150 nurses. There is no psychometric validation of study-specific measures for workload, trauma exposure, coping, and compassion fatigue25. Recall and social desirability bias may occur in self-reported data. The few cases also decrease the stability of the machine-learning classifiers and the external validity of the results.
Practical implications
Implications for nursing education
Nursing education may include recognition of CF, reflective practice, peer support, professional boundaries, and adaptive coping. Education should distinguish individual support from organizational responsibilities, such as adequate staffing, workplace safety, protected recovery time, and confidential assistance.
Implications for nursing practice and management
Nurse leaders, managers, educators, and healthcare organizations should work together to strengthen compassion and reduce modifiable demands. Practical strategies include reviewing staffing and patient-acuity patterns, monitoring shift intensity and trauma exposure, providing non-punitive post-event debriefing and confidential mental-health support, and developing mentorship and meaningful professional-development opportunities. Any screening activity should be supportive, confidential, and non-punitive9,10,22.
Implications for research
Research priorities include validation of an appropriate measurement instrument; pre-specification and justification of a binary threshold; prospective sample-size calculation; preservation of participant-level data, code, metadata, and model objects; calibration assessment; reporting of confusion matrices and uncertainty intervals; prespecified sensitivity and demographic-only comparator analyses where justified; and independent external validation.
Contribution to nursing science
This study links nursing theory to association analysis and internal predictive model comparison by examining workload, trauma exposure, coping, and compassion satisfaction within a single prespecified framework. Its contribution is methodological and exploratory rather than a deployable clinical algorithm.
In conclusion, this cross-sectional study explored the association between emergency department nurse workload, trauma exposure, coping strategies, compassion satisfaction, and compassion fatigue (CF), and compared the internal classification performance of three machine-learning models. Workload and trauma exposure had the strongest positive correlation with CF (r = 0.75) and the largest standardized regression coefficient (β = 0.42), making them the most important risk-associated factors. Coping mechanisms (r = −0.52, β = −0.25) and compassion satisfaction (r = −0.60, β = −0.35) were negatively related to CF and may serve as protective factors. The four-predictor regression model accounted for a significant amount of variance in CF (adjusted R2 = 0.852), supporting the utility of the Figley and Stamm theoretical models as a rich explanatory framework for CF as measured by these four predictors.
There were also some meaningful differences by ED experience and coping category in the level of CF, with nurses with more ED experience and lower coping scores having higher levels of CF, and Random Forest demonstrating the highest internal accuracy (85%) and ROC-AUC (0.84) when compared to Support Vector Machine and logistic regression, suggesting that nonlinear models may capture additional structure within this dataset. However, these comparisons were made within this sample. Overall, these findings support an association between higher workload and trauma exposure and higher compassion fatigue scores, whereas adaptive coping and compassion satisfaction were associated with lower compassion fatigue scores. The results of this study support implementing targeted organizational strategies as practical solutions for emergency nurses to reduce compassion fatigue, including workload strategies, trauma-informed support strategies, and strategies that foster compassion.
Offenlegungen
The authors have no conflicts of interest to declare.
Materialien
| Name | Unternehmen | Katalognummer | Kommentare |
|---|---|---|---|
| Electronic data-capture workbook | Study authors | Study-specific Excel workbook | Data collection and management |
| Matplotlib | Open-source community | Version 3.8; https://matplotlib.org | Figures and diagnostic plots |
| pandas and NumPy | Open-source communities | pandas 2.2, https://pandas.pydata.org; NumPy 1.26, https://numpy.org | Data management and numerical processing |
| Professional Quality of Life conceptual resources | ProQOL/Stamm | Concise ProQOL Manual, 2nd ed.; https://proqol.org | Theoretical guidance; not standard ProQOL scoring |
| Python | Python Software Foundation | Version 3.11; https://www.python.org | Documented analysis environment |
| scikit-learn | Open-source community | Version 1.4; https://scikit-learn.org | Preprocessing, model fitting, validation, and metrics |
| SciPy | Open-source community | Version 1.12; https://scipy.org | Statistical tests |
| Spreadsheet software | Microsoft | Excel (.xlsx); Microsoft 365 Excel | Editable tables and supplementary data |
| Structured study questionnaire | Study authors | Study-specific; no catalog number; questionnaire item wording | Collection of demographics and study variables |
| Study authors | Study authors | Study-specific Excel workbook | Data collection and management |
Referenzen
- Figley CR. Compassion fatigue: coping with secondary traumatic stress disorder in those who treat the traumatized. New York: Brunner/Mazel; 1995.
- Figley CR. Treating compassion fatigue. New York: Brunner-Routledge; 2002.
- Stamm BH. The concise ProQOL manual. 2nd ed. Pocatello (ID): ProQOL.org; 2010.
- Sinclair S, et al. Compassion fatigue: a meta-narrative review of the healthcare literature. Int J Nurs Stud. 2017;69:9-24.
- Maslach C, Leiter MP. Understanding the burnout experience: recent research and its implications for psychiatry. World Psychiatry. 2016;15(2):103-11.
- Coetzee SK, Klopper HC. Compassion fatigue within nursing practice: a concept analysis. Nurs Health Sci. 2010;12(2):235-43.
- Pan Y, Wang X, Jin W. Risk of compassion fatigue among emergency department nurses: a systematic review and meta-analysis. BMC Emerg Med. 2025;25:155.
- Yi L, et al. Prevalence and related factors of compassion fatigue among registered nurses and nursing students during internship: a systematic review and meta-analysis. BMC Nurs. 2024;23:956.
- Kayacan S, Palaz SC. Relationship between compassion fatigue, conscience stress, and perceived quality of care in emergency nurses. Int Emerg Nurs. 2025;78:101543.
- Subih M, Salem H, Al Omari D. Evaluation of compassion fatigue and compassion satisfaction among emergency nurses in Jordan: a cross-sectional study. Int Emerg Nurs. 2023;66:101232.
- Yu H, Gui L. Compassion fatigue, burnout, and compassion satisfaction among emergency nurses: a path analysis. J Adv Nurs. 2022;78(5):1294-304.
- Sprang G, Clark JJ, Whitt-Woosley A. Compassion fatigue, compassion satisfaction, and burnout: factors impacting a professional’s quality of life. J Loss Trauma. 2007;12(3):259-80.
- Adriaenssens J, De Gucht V, Maes S. The impact of traumatic events on emergency room nurses: findings from a questionnaire survey. Int J Nurs Stud. 2012;49(11):1411-22.
- Dall’Ora C, Ball J, Reinius M, Griffiths P. Burnout in nursing: a theoretical review. Hum Resour Health. 2020;18(1):41.
- von Elm E, et al. Strengthening the Reporting of Observational Studies in Epidemiology (STROBE) statement: guidelines for reporting observational studies. PLoS Med. 2007;4(10):e296.
- Collins GS, et al. TRIPOD+AI statement: updated guidance for reporting clinical prediction models that use regression or machine learning methods. BMJ. 2024;385:e078378.
- Liu D, et al. Effect of perceived organizational support and ego-resilience on the relationship between occupational stressors and compassion fatigue in COVID-19 frontline nurses: a cross-sectional study in Sichuan, China. BMC Nurs. 2024;23:817.
- Goktas S, Gezginci E, Kartal H. Effects of motivational messages sent to emergency nurses during the COVID-19 pandemic on job satisfaction, compassion fatigue, and communication skills: a randomized controlled trial. J Emerg Nurs. 2022;48(5):547-58.
- Joyce S, et al. Workplace interventions for common mental disorders: a systematic meta-review. Psychol Med. 2016;46(4):683-97.
- West CP, Dyrbye LN, Erwin PJ, Shanafelt TD. Interventions to prevent and reduce physician burnout: a systematic review and meta-analysis. Lancet. 2016;388(10057):2272-81.
- Riley RD, et al. Minimum sample size for developing a multivariable prediction model: Part II—binary and time-to-event outcomes. Stat Med. 2019;38(7):1276-96.
- Xie D, Zhu X, Zhang X, Jiang Z, Liu T. Impact of support from emergency nurse organizations on compassion fatigue: the mediating role of psychological capital. Front Public Health. 2025;13:1551381.
- Shi H, Liu J, Yang C, Shang J, Zeng Y. Machine learning for predicting burnout among healthcare professionals: a systematic review and meta-analysis. Contemporary Nurse. 2025;25:1-21.
- Xie W, et al. Construction and evaluation of a predictive model for compassion fatigue among emergency department nurses: a cross-sectional study. Int J Nurs Stud. 2023;148:104613.
- Sharma S, et al. Development and psychometric properties of the Compassion Fatigue Assessment Scale for Indian nurses. BMC Nurs. 2025;24:1061.