Diese Studie evaluiert die Behandlung mit Qi-fu-yin (QFY) bei 5xFAD-Mäusen. Die Ergebnisse zeigen, dass die Gabe von QFY mit einer verbesserten Lern- und Gedächtnisleistung, einer verminderten zerebralen Aβ-Ablagerung und zellulären Seneszenz sowie einer abgeschwächten synaptischen Strukturschädigung im zerebralen Kortex assoziiert ist.
Forschungsartikel
Effekte von Qi-fu-yin auf die Verbesserung kognitiver Beeinträchtigungen und die Reduktion der zellulären Seneszenz in den Gehirnen von 5xFAD-Mäusen
* These authors contributed equally
In diesem Artikel
Zusammenfassung
Zusammenfassung
Obwohl der Wirkmechanismus von Qi-fu-yin (QFY), einer Rezeptur der traditionellen chinesischen Medizin, noch nicht vollständig verstanden ist, hat es therapeutisches Potenzial bei Alzheimer-Krankheit (AD) gezeigt. Diese Studie hatte das Ziel, den Zusammenhang zwischen der QFY-Behandlung und kognitiven Beeinträchtigungen bei 5xFAD-Mäusen zu untersuchen. Wir verwendeten die Griffkraft, Gangbild, Kolonienesterung, Shuttle-Box, Morris-Wasser-Maze-Test und ELISA zur Bestimmung der Amyloidspiegelβ Protein 1-42 (Aβ1-42), Aβ1-40, Wachstumsassoziiertes Protein 43 (GAP-43), Synaptophysin (SYN) und postsynaptisches Dichteprotein 95 (PSD-95) in den Gehirnen von 5xFAD-Mäusen. Die Luminex-Zytokinanalyse wurde verwendet, um die Spiegel des seneszenzassoziierten sekretorischen Phänotyps (SASP) im Kortex zu quantifizieren. Die Menge des seneszenzassoziierten β-Galactosidase (SA-β-Gal), Aβ Ablagerung und dendritische Dornen in den Gehirnen der Tiere wurden mittels SA-β-Gal-Färbung, Immunhistochemie bzw. Golgi-Cox-Färbung. Die QFY-Behandlung reduzierte kortikales A dramatischβ Plaque-Belastung und verminderte p21-Expression in 5xFAD-Mäusen, gemäß Immunfluoreszenztests. Bei 5xFAD-Mäusen verbesserte die QFY-Therapie signifikant die Lern- und Gedächtnisleistung, linderte Alterung und erhöhte die Mengen der Proteine GAP-43, PSD-95 und SYN in der Großhirnrinde der Mäuse. Nach der Behandlung mit QFY zeigte sich eine signifikante Abnahme von Aβ Plaque und SA-β-Gal-Aktivität im Gehirn sowie Aβ1-42 und Aβ1-42/Aβ1-40 Spiegel im Hippocampus. Die Spiegel von IL-1α, IL-1β, IL-6, IL-17A und IFN-γ waren im Kortex der 5xFAD-Mäuse deutlich vermindert. PCA- und Pearson-Korrelationsanalysen zeigten eine starke negative Assoziation zwischen SASP-Zytokinen und den Spiegel der synaptischen Proteine. Diese Ergebnisse deuten auf einen Zusammenhang zwischen der QFY-Behandlung und einer Verbesserung altersbedingter kognitiver Beeinträchtigungen sowie zellulärer Seneszenzphänotypen bei 5xFAD-Mäusen hin, begleitet von einer verminderten strukturellen Schädigung der Synapsen. Diese Befunde stützen die weitergehende Untersuchung von QFY als potenziellen therapeutischen Kandidaten für die Alzheimer-Krankheit.
Einleitung
Alzheimer's disease (AD)1 is the most prevalent form of dementia, characterized by amyloid-β protein (Aβ), hyperphosphorylated tau proteins (P-Tau), synaptic loss, and chronic inflammation. Currently available medications for AD have a number of side effects and are unable to stop the disease's progression2,3,4,5.
Senescence, which manifests as organism-wide disruptions across cellular and interstitial microenvironments rather than localized organ-specific alterations, is a key risk factor in AD pathogenesis. This systemic dysregulation distinguishes AD progression from single tissue-pathology models by fundamentally changing homeostatic mechanisms across biological systems6,7. Although cellular senescence initially serves as a homeostatic regulatory mechanism, the accumulation of senescent cells eventually causes progressive tissue degradation and persistent inflammatory cascades, fundamentally disrupting physiological homeostasis8. The ensuing inflammation may harm synapses and impair cognitive function9,10.
Cellular senescence is a complex cellular stress response characterized by telomere shortening, permanent cell-cycle arrest, and altered secretory activity11. Additional hallmarks include enlarged, flattened cell morphology, positive senescence-associated β-galactosidase (SA-β-Gal) staining, lipofuscin accumulation, and secretion of SASP factors12. Memory formation is affected by the notable decline in the levels of proteins associated with synaptic plasticity of axons and dendrites, which occurs with cellular senescence13,14. Because synaptic plasticity is essential for learning and memory, disruptions in synaptic proteins contribute to cognitive impairment. These proteins include GAP-43, SYN, and PSD-95. Undoubtedly, synaptic function is affected by reductions in dendritic numbers and functional abnormalities in the brains of the elderly15.
QFY is a traditional Chinese medicine formula derived from Jing Yue Quan Shu. It is composed of Panax ginseng C.A.Mey (Araliaceae), Polygala tenuifolia Willd (Polygalaceae), Rehmannia glutinosa (Gaertn.) Libosch. ex Fisch. & C. A. Mey (Orobanchaceae), Angelica sinensis (Oliv.) Diels (Apiaceae), Glycyrrhiza uralensis Fisch. ex DC. (Fabaceae), Atractylodes macrocephala Koidz (Asteraceae), Ziziphus jujuba Mill. var. spinosa (Bunge) Hu ex H.F. Chou (Rhamnaceae). Research has demonstrated that QFY significantly ameliorates cognitive dysfunction in rats with diabetes-induced brain injury16. Our previous study found that QFY could improve cognitive learning and memory functions impairment in 5xFAD and APP/PS1 mice. In addition, QFY demonstrated high safety in non-clinical studies, and no obvious acute, subacute, or long-term toxic reactions were observed17,18,19. Analysis of the clinical therapeutic effect of QFY showed that AD patients experienced a significant increase in their capacity for activities of daily living and MMSE scores after QFY treatment20. Following three consecutive days of QFY administration in male Sprague-Dawley rats, ten prototype QFY-derived components, including butylidenephthalide, butylphthalide, 20(S)-ginsenoside Rh1, 20(R)-ginsenoside Rh1, and zingibroside R1, were detected in cerebrospinal fluid21,22. However, the therapeutic mechanism of QFY in AD is still unclear. In this study, we investigated the association between QFY treatment, cellular senescence, and AD-related pathological changes in 5xFAD mice.
Although previous studies have demonstrated the neuroprotective effects of QFY in AD models, the specific involvement of cellular senescence in mediating these effects remains unexplored. Moreover, whether QFY confers cognitive benefits through senescence‑associated synaptic preservation, rather than solely through amyloid‑β reduction, has not been addressed. The present study was therefore designed to investigate whether QFY treatment attenuates cellular senescence and whether this attenuation is associated with improved synaptic plasticity in 5xFAD mice.
Protokoll
Alle Tierversuche wurden von dem Ethikkomitee für Tierversuche der Shandong-Universität für Traditionelle Chinesische Medizin (SDUTCM20221101001) genehmigt.
Arzneimittel
Das QFY-Granulat-Trockencremepulver wurde vom Lunan Pharmaceutical Houpu-Forschungs- und Entwicklungszentrum hergestellt und getestet. Donepezil und Memantin wurden von Shanghai Yuanye Technology bezogen. Männliche 5xFAD-Mäuse mit einem Anfangskörpergewicht von 19–27 g wurden in dieser Studie verwendet. Die QFY-Dosis wurde aus der klinischen Human-Dosis von 43 g/Tag abgeleitet, was nach Anpassung an das QFY-Granulat-Trockencremepulver 16,297 g/Tag entspricht. Die mittlere Dosis für das vorliegende Experiment wurde basierend auf der klinischen Human-Dosis berechnet (16,297 g/70 kg × 9,1 = 2,11861 g/kg/Tag). Die hohe Dosis wurde auf das Doppelte der mittleren Dosis festgelegt (4,24 g/kg/Tag), und die niedrige Dosis auf die Hälfte der mittleren Dosis (1,06 g/kg/Tag). Alle Arzneimittellösungen wurden in einem Volumen von 0,1 mL pro 10 g Körpergewicht verabreicht.
Als positiven Kontrollansatz wurde eine kombinierte Verabreichung von Donepezil und Memantinhydrochlorid verwendet. Die Dosierungen wurden unter Bezugnahme auf die derzeitigen klinischen Applikationsdosen (10 mg/d bzw. 20 mg/d) sowie auf frühere Daten unserer Forschungsgruppe festgelegt, was zu einem Regime von 1,0 mg/kg/d Donepezil in Kombination mit 2,8 mg/kg/d Memantin führte und eine Gesamtdosis von 3,8 mg/kg/d ergab. Die endgültige Konzentration des Donepezil-Memantin-Gemischs wurde auf 0,38 mg/mL eingestellt, berechnet aus 3,8 mg/kg dividiert durch das Applikationsvolumen von 0,1 mL pro 10 g Körpergewicht.
QFY-Lösungen in niedriger, mittlerer und hoher Dosis wurden wie folgt hergestellt: 5,3 g, 10,6 g und 21,2 g QFY-Trockenpulver wurden jeweils in separate 100-mL-Bechergläser gegeben, mit 30 mL gereinigtem Wasser unter gründlichem Rühren vermischt, in Messzylinder überführt und mit gereinigtem Wasser auf ein Endvolumen von 50 mL aufgefüllt, wodurch endgültige Massenkonzentrationen von 0,106 g/mL, 0,212 g/mL bzw. 0,424 g/mL entstanden. Als positiver Kontrolle wurden 5 mg Donepezil und 14 mg Memantin in gereinigtem Wasser gelöst und auf ein Endvolumen von 50 mL eingestellt. Die Tiere jeder Gruppe erhielten einmal täglich über orale Gavage die entsprechende Arzneimittellösung verabreicht.
Tiere
5xFAD-transgene Mäuse [B6. Cg-Tg (APPSwFlLon, PSEN1* M146L* L286V)6799Vas/Mmjax] wurden im Labor gezüchtet. Alle Tiere wurden in einer SPF-Umgebung an der Shandong-Universität für Traditionelle Chinesische Medizin bei einer Temperatur von 22–24 oC, einer Luftfeuchtigkeit von 50–60 % und einem 12-Stunden-Licht-Dunkel-Wechsel gehalten. Den Tieren stand jederzeit Futter und Wasser zur Verfügung.
Männliche 5xFAD-Mäuse im Alter von 2,5 Monaten wurden zufällig fünf Gruppen zugewiesen: unbehandelte 5xFAD-Mäuse, Donepezil in Kombination mit Memantin, niedrig dosiertes QFY, mittel dosiertes QFY und hoch dosiertes QFY. Alterstypische männliche Wildtyp-(WT)-Wurfgenossen dienten als WT-Kontrollgruppe. Die Behandlungen wurden einmal täglich über einen Zeitraum von 220 Tagen verabreicht. (Abbildung 1).
Verhaltensuntersuchungen
Griffkrafttest
Die Kraft der Skelettmuskulatur der Vordergliedmaßen der Mäuse wurde mit einem Griffkraftmessgerät gemessen23. Während des Experiments wurde das Testgerät horizontal positioniert, sodass die Maus parallel zur Tischoberfläche blieb. Nachdem das Gerät eingeschaltet worden war, wurde die Maus vorsichtig auf die Grifffläche gesetzt. Sobald die Maus die Platte sicher ergriffen hatte, wurde ihr Schwanz mit gleichmäßiger Kraft nach hinten gezogen, bis die Maus losließ. Die maximale Griffkraft wurde aufgezeichnet. Diese Messung wurde dreimal wiederholt, und der Mittelwert dieser Werte wurde zur Bestimmung der Griffkraft der Maus verwendet.
Gangtest
Die Gangregelmäßigkeit von Mäusen wurde mit CatWalk XT gemessen. Das Experiment wurde in eine Trainingsphase und eine Testphase unterteilt24. Einen Tag zuvor wurden die Versuchsmäuse in den Versuchsraum verbracht, um ihnen die Anpassung an die neue Umgebung zu ermöglichen. Während der Trainingsphase wurden die Mäuse am Startpunkt platziert und liefen entlang des Kanals zum Endpunkt. Jede Maus wurde dreimal täglich trainiert. Nach drei Tagen Training (bis jede Maus den Kanal schnell durchlaufen konnte), wurden die Mäuse in den Käfig zurückgebracht. Die Testphase war identisch mit der Trainingsphase, und die Computersoftware analysierte automatisch jede Bewegungsbahn. Grüne Punkte wurden angezeigt, wenn die Bahn qualifiziert war, orange Punkte bei nicht qualifizierten Bahnen; mindestens drei grüne Punkte pro Maus mussten vorliegen, die dann mit der CatWalkXT 10.0-Software analysiert wurden.
Shuttle-Box-Test
Der Shuttle-Box-Test wurde verwendet, um die konditionierte aktive Vermeidungsfähigkeit bei Mäusen zu bewerten25. Die Versuchsanordnung bestand aus einer Shuttle-Box (18 cm x 18 cm), die in einer schallgedämpften Kammer untergebracht war. Der Versuch umfasste eine vier Tage dauernde Lernphase, gefolgt von einer eintägigen Testphase. An jedem Lerntag erhielten die Mäuse zunächst eine 120-s-Adaptationsphase in der Shuttle-Box, bevor das Training begann. Jeder Versuchsdurchlauf begann mit einem 6-s-Dauernden konditionierten Reiz (70-dB, 1000-Hz-Ton in Kombination mit einem 500-lux-hellen Licht), gefolgt von einem 3-s-Dauernden, 0,3-mA-Stromschlag, der über den Gitterboden appliziert wurde, und endete mit einer 12-s-Dauernden inter-trial-Pause. Wenn die Maus während des konditionierten Reizes in das gegenüberliegende Fach wechselte, blieb der Stromschlag aus, und die Reaktion wurde als aktive Vermeidung aufgezeichnet. Wenn die Maus während des konditionierten Reizes nicht wechselte, dies aber während des Stromschlags tat, wurde dies als passive Vermeidungsreaktion gewertet. Falls die Maus während des gesamten Durchlaufs nicht wechselte, wurde dies als Fluchtversagen registriert. Das Training wurde vier aufeinanderfolgende Tage lang durchgeführt, mit jeweils 30 Durchläufen pro Tag. Während der Testphase (Tag 5) wurde der Stromschlag weggelassen, während alle übrigen Parameter unverändert blieben. Die Anzahl der aktiven Vermeidungsreaktionen wurde als primäres Maß für Lernen und Gedächtnis erfasst.
Morris-Wasserlabyrinth
Der Morris-Wassernebel-Test wurde verwendet, um die räumlichen Lern- und Gedächtnisfähigkeiten der Versuchstiere zu bewerten26. Das Experiment wurde in einem Becken mit einem Durchmesser von 120 cm und einer Tiefe von 50 cm durchgeführt. Das Becken wurde mit trübem, weißem Wasser gefüllt, und die Temperatur wurde bei 21 °C gehalten. In einem der vier Quadranten wurde ein Plattform mit einem Durchmesser von 10 cm 1 cm unterhalb der Wasseroberfläche angebracht. Um das Becken herum wurden visuelle Hinweise als räumliche Orientierungspunkte für die Mäuse platziert. Der Lernprozess erstreckte sich über vier aufeinanderfolgende Tage, wobei jede tägliche Sitzung in einem von drei Quadranten begann. Die Startpositionen variierten pseudorandomisiert zwischen den vier Himmelsrichtungen. Jeder Versuch endete, sobald das Tier die Plattform erfolgreich erreichte. Eine maximale Versuchsdauer von 60 s wurde festgelegt; falls das Tier innerhalb dieses Zeitraums die Plattform nicht fand, wurde es vorsichtig dorthin geleitet. Nachdem das Tier die Plattform erreicht hatte, erhielt es eine kurze Pause von 10 s, bevor es in seinen Heimkäfig zurückgebracht wurde. Nach Abschluss der Lernphase beginnt die Testphase 24 h später. Am fünften Tag werden die Mäuse aus dem dem Plattformquadranten gegenüberliegenden Quadranten ins Wasser gesetzt. Die Fluchtlatenz während der Testphase, die Verweildauer im Zielquadranten sowie die Anzahl der Querungen des ursprünglichen, unter Wasser liegenden Plattformbereichs wurden aufgezeichnet.
Test zum Koloniebau
Die täglichen Aktivitäten von Versuchstieren wurden mithilfe des Kolonienestungstests27 bewertet. Das Experiment dauerte 24 h und umfasste jeweils drei Tiere pro Gruppe. Nach der Verabreichung des Wirkstoffs am selben Tag wurden neue Käfige eingerichtet, die mit 6 g weichem Papier für die Nestung ausgelegt waren. Fotografien wurden nach 6 h, 12 h und 24 h angefertigt. Am Ende des Experiments war das Papier im gesamten Käfig verstreut, ohne dass Bissspuren erkennbar waren: 1 Punkt. Die Papierstücke waren locker an einer Seite des Käfigs zusammengelegt, ohne geformte Nester, ohne offensichtliches Zerreißen oder Falten: 2 Punkte; Die Papierstücke waren gesammelt und zu einem geformten, aber relativ flachen Nest gefaltet, ohne offensichtliches Zerreißen: 3 Punkte; Ein tiefes Nest aus stark zerkleinertem Papier erhielt die Wertung 4 Punkte. Am Ende des Experiments wurde das verbliebene unzerkaute Gewebe (definiert als Papierfragmente mit einem Gewicht von >0,1 g, die nicht zerkleinert oder in das Nest eingearbeitet wurden) sorgfältig gesammelt, luftgetrocknet und mit einer elektronischen Waage (Genauigkeit: 0,01 g) gewogen.
Probenahme und Probensammlung
Wir sammelten Proben nur aus den WT-, 5xFAD- und QFY-Gruppen (2,12 g/kg/Tag). Nach der CO2-Asphyxiation wurden die Köpfe abgetrennt, die rechte Hemisphäre schnell geöffnet, um Hippocampus und Kortex zu isolieren, mit phosphatgepufferter Kochsalzlösung (PBS) gespült und in 1,5-mL-Gefriertuben in flüssigem Stickstoff aufbewahrt. Die Proben wurden bei -80 oC für biochemische Untersuchungen gelagert. Die linke Hemisphäre wurde durch Einbetten in 4 % Paraformaldehyd für 24 Stunden fixiert, durch Einlegen in absoluten Ethanol dehydriert, in Paraffinwachs eingebettet, in 5-µm-Schnitte aufgeteilt und für die immunhistochemische Detektion entparaffiniert.
Enzymgebundener Immunosorbens-Assay (ELISA)
ELISA-Analysen wurden durchgeführt, um die Konzentrationen der Zielproteine in Gehirngeweben zu quantifizieren. Die Gehalte an Aβ1–40 und Aβ1–42 in homogenisierten Hippocampi wurden mithilfe kommerzieller Kits gemessen, während die kortikalen Konzentrationen von GAP-43, PSD-95 und SYN mit Kits des Unternehmens Jiangsu Enzyme Immunoassay Industry bestimmt wurden. Alle Schritte wurden streng gemäß den Herstellervorschriften durchgeführt. Die Standardreihen wurden durch serielle Verdünnung gemäß den Kit-Anleitungen hergestellt. Das Mikroplatten-Layout umfasste Leerwells, Standardwells, 5xFAD-Probenwells, mit QFY behandelte Probenwells (2,12 g/kg/Tag) und Wildtyp-Wells. Vor dem Beladen wurden alle Proben mit dem bereitgestellten Verdünnungspuffer im Verhältnis 1:1 verdünnt. Die Reagenzien wurden hinzugegeben, wobei die Pipettenspitze senkrecht zum Boden des Wells gehalten wurde, und anschließend vorsichtig geschüttelt, um eine vollständige Durchmischung sicherzustellen.
Nach dem Versiegeln der Platte wurde die erste Inkubation bei 37 °C für 30 min durchgeführt. Während dieses Zeitraums wurde das Waschpuffer durch Verdünnen des konzentrierten Stamms mit ultrareinem Wasser im Verhältnis 1:29 (1 mL Konzentrat zu 29 mL Wasser) hergestellt. Nach der Inkubation wurde der Siegelfilm entfernt, die Flüssigkeit verworfen und die Platte trocken getupft. Jedes Loch wurde anschließend mit 200 µL Waschpuffer gefüllt, 30 s stehengelassen und dann entleert; der Zyklus wurde fünfmal wiederholt. Danach wurde in alle Löcher bis auf die Blindproben jeweils 50 µL enzymmarkiertes Reagenz gegeben, die Platte erneut versiegelt und erneut 30 min bei 37 °C inkubiert, gefolgt von einem identischen Waschschritt mit fünf Zyklen.
Zur Farbentwicklung wurden 50 µL Chromogenlösung A in jede Vertiefung gegeben, gefolgt von 50 µL Chromogenlösung B, wobei nach jeder Zugabe vorsichtig gemischt wurde. Die Platte wurde 10 min bei 37 °C im Dunkeln inkubiert. Die enzymatische Reaktion wurde durch Zugabe von jeweils 50 µL Stopplösung pro Vertiefung beendet, wodurch sich die blaue Farbe prompt in gelb umwandelte. Die Extinktion (optische Dichte) wurde bei 450 nm mit einem Mikroplatten-Reader gemessen, wobei leere Vertiefungen als Referenz dienten; alle Messwerte wurden innerhalb von 15 min nach Beendigung der Reaktion erfasst.
Luminex
Die kortikalen Konzentrationen von SASP-Faktoren wurden mit dem Bio‑Plex Pro Mouse Cytokine 23‑plex Assay-Kit gemessen, wobei alle Schritte gemäß den Herstelleranweisungen durchgeführt wurden. Die Reagenzien wurden aus der Lagerung bei 4 °C entnommen und vor der Verwendung 30 Minuten lang zur Raumtemperatur akklimatisiert. Die Standardstammlösungen wurden seriell verdünnt, um eine Sieben-Punkt-Standardkurve sowie ein Leerwert-Loch gemäß Kit-Protokoll zu erzeugen. Die magnetischen Beads wurden vorgemischt und auf die empfohlene Arbeitskonzentration verdünnt; die Detektionsantikörper wurden als Arbeitslösungen hergestellt; und der Waschpufferkonzentrat wurde mit entionisiertem Wasser auf 1x verdünnt. Das PE‑Streptavidin-Konjugat wurde ebenfalls mit dem beigefügten Verdünnungspuffer auf 1x verdünnt.
Für den Assay wurden 50 µL der Beadsuspension, der Standards, der Qualitätskontrollen und der verdünnten Gewebeproben (5,6 µg/µL) entsprechend dem Plattenlayout nacheinander in die dafür vorgesehenen Vertiefungen gegeben. Die Platte wurde anschließend verschlossen und über Nacht bei 4 °C bei orbitaler Schüttelung mit 800 U/min inkubiert. Nach der Inkubation wurden die Beads dreimal mit jeweils 200 µL Waschpuffer pro Vertiefung gewaschen. Danach wurden 50 µL des vorbereiteten Detektionsantikörpers in jede Vertiefung gegeben, und die Platte wurde 1 h bei Raumtemperatur unter Schütteln mit 800 U/min inkubiert. Nach weiteren drei Waschzyklen wurden 50 µL der PE‑Streptavidin-Arbeitslösung zugegeben, und die Platte wurde weitere 30 min bei Raumtemperatur unter denselben Schüttelbedingungen inkubiert. Ein abschließender Waschschritt (dreimal mit 200 µL Waschpuffer) wurde durchgeführt, woraufhin 150 µL Waschpuffer zu jeder Vertiefung hinzugefügt wurden. Die Platte wurde dann 2 min bei Raumtemperatur mit 800 U/min geschüttelt, bevor sie auf dem Bio‑Plex-Gerät ausgelesen wurde.
SA-β-Gal-Färbung und Immunhistochemie
Die SA-β-Gal-Färbung wurde gemäß der Anleitung des Senescence-β-Galactosidase-Färbekits durchgeführt. Nach der SA-β-Gal-Färbung wurden die Schnitte einer Antigen-Retrieval-Behandlung durch Erhitzen in Citratpuffer (pH 6,0) unterzogen. Die endogene Peroxidase-Aktivität wurde blockiert, indem die Schnitte 10 Minuten bei Raumtemperatur in einer Peroxidase-Blockierungslösung inkubiert wurden. Anschließend wurden die Schnitte über Nacht bei 4 °C mit einem monoklonalen Kaninchen-Antikörper gegen Aβ₁-₄₂ (1:400) inkubiert. Nach dem Waschen wurden die Schnitte 20 Minuten bei Raumtemperatur mit einem sekundären Antikörper gegen Kaninchen/Maus-IgG inkubiert. Nach weiterem Waschen wurde die Immunreaktivität mittels DAB für 2 Minuten sichtbar gemacht. Schließlich wurden die Schnitte dehydriert, geklärt und mit neutralem Harz eingedeckt, um sie mikroskopisch zu untersuchen.
Immunfluoreszenz
Für die Immunfluoreszenzfärbung wurden Paraffinschnitte in Xylol (3 × 15 min) deparaffinisiert und durch eine abgestufte Ethanolreihe (100 %, 95 % und 75 %; jeweils 2 × 5 min) rehydriert. Die Antigenrückgewinnung erfolgte durch Einlegen der Schnitte in 1× Zitratpuffer bei 95 °C für 30 min, gefolgt von einer allmählichen Abkühlung auf Raumtemperatur. Nach dreimaligem Spülen mit Phosphat-gepufferter Salzlösung mit Tween 20 (PBST) (jeweils 5 min) wurden die Schnitte mit 10 % normalem Zieusersum, das 0,3 % Triton X‑100 enthielt, für 90 min bei Raumtemperatur permeabilisiert und blockiert. Anschließend wurden die Schnitte mit primären Antikörpern gegen p21/CIP1/CDKN1A (1:200) und Aβ₁‑₄₂ (1:400) bei 37 °C für 2 h inkubiert. Nach viermaligem Waschen mit PBST (jeweils 5 min) erfolgte die Inkubation mit artübereinstimmenden, mit Alexa Fluor markierten sekundären Antikörpern (1:500) bei 37 °C für 2 h im Dunkeln. Nach weiterem Waschen (4 × 5 min in PBST) wurden die Schnitte mit einem Antifade-Montagemedium, das DAPI enthält, auf Objektträger aufgebracht und mit einem Fluoreszenzmikroskop bildlich erfasst.
Färbung nach Golgi-Cox
Die Golgi-Cox-Färbung wurde mithilfe eines kommerziellen Kits gemäß den Herstelleranweisungen durchgeführt. Lösung A und Lösung B wurden 24 Stunden vor dem Experiment gemischt. Nachdem die Mäuse getötet worden waren, wurden die Gehirngewebe rasch entnommen, mit PBS gespült und in die Mischung aus Lösung A und Lösung B eingetaucht. Die Gewebe wurden 6 Stunden bei Raumtemperatur im Dunkeln gelagert, danach wurde die Imprägnierlösung durch frische Lösung ersetzt und die Inkubation weitere zwei Wochen bei Raumtemperatur im Dunkeln fortgesetzt (mindestens 2 mL Imprägnierlösung pro Gehirngewebe). Anschließend wurden die Gewebe in Lösung C überführt und 24 Stunden lang inkubiert, danach wurde die Lösung durch frische Lösung C ersetzt und die Inkubation weitere 7 Tage bei Raumtemperatur im Dunkeln fortgesetzt. Die Gehirngewebe wurden mit einem Vibratom in Schnitte von 100 µm Dicke zerteilt. Die Schnitte wurden auf mit Gelatine beschichtete Objektträger aufgebracht und drei Tage bei Raumtemperatur trocknen gelassen. Die Objektträger wurden zweimal mit destilliertem Wasser gespült (jeweils 5 Minuten), dann 15 Minuten lang in einer Mischung aus Lösung D, Lösung E und destilliertem Wasser (im Verhältnis 1:1:2) inkubiert. Nach zwei weiteren Spülgängen mit destilliertem Wasser (jeweils 5 Minuten) wurden die Schnitte nacheinander durch abgestufte Ethanol-Lösungen (50 %, 75 % und 95 %; jeweils 5 Minuten) dehydriert, gefolgt von vier Spülgängen in absolutem Ethanol (jeweils 4 Minuten) und drei Spülgängen in Xylol (jeweils 5 Minuten). Abschließend wurden die Schnitte mit Eindeckmedium überdeckt. Die Aufnahmen wurden mit einem Mikroskop angefertigt, und die Dichte der dendritischen Dornen wurde mittels ImageJ quantifiziert.
Statistische Analyse
Alle Ergebnisse wurden als Mittelwert ± Standardabweichung angegeben. Die Daten wurden mit GraphPad Prism 8.1.0 analysiert und grafisch dargestellt. Zum Vergleich von zwei Gruppen wurde der Student’s t-Test verwendet. Bei Vergleichen mit mehreren Gruppen kam eine einfaktorielle ANOVA zum Einsatz, wobei paarweise Vergleiche mit dem Dunnett-Test durchgeführt wurden. Die statistische Signifikanz wurde bei p < 0,05 festgelegt.
Multivariate und Korrelationsanalysen
Die Hauptkomponentenanalyse (PCA) wurde mit GraphPad Prism 8.0.1 durchgeführt, um die gruppenweise Clusterung von SASP-Faktoren (IL-1α, IL-1β, IL-6, IL-17A, IFN-γ, CCL3, CCL4 und CCL5) zwischen den WT-, 5xFAD- und QFY-Gruppen (2,12 g/kg/Tag) zu visualisieren (n = 8 pro Gruppe). Das Score-Plot wurde basierend auf den ersten beiden Hauptkomponenten erstellt. Vor der PCA wurde keine Datentransformation angewendet. Eine Pearson-Korrelationsanalyse wurde durchgeführt, um lineare Zusammenhänge zwischen SASP-Faktoren und synaptischen Proteinen (PSD-95, GAP-43 und SYN) sowie Aβ₁₋₄₀, Aβ₁₋₄₂ und dem Aβ₁₋₄₂/Aβ₁₋₄₀-Verhältnis zu bewerten. Die Analyse erfolgte mit GraphPad Prism bei einer zweiseitigen Signifikanzschwelle von p < 0,05. Korrelationsmatrizen und eine Heatmap wurden erstellt, um Stärke und Richtung der Assoziationen zu visualisieren.
Ergebnisse
Administration of QFY enhances learning and memory in 5xFAD mice
After QFY administration, a shuttle box test was conducted to assess the conditional active avoidance response of mice (Figure 2A–C). The results showed the number of active avoidances on days 1-4 (Figure 2A, p < 0.05) and the area under the curve (AUC) of active avoidance (Figure 2B, p < 0.01) during the learning period, and the number of active avoidances (Figure 2C, p < 0.05) during the test period were significantly reduced in 5xFAD mice compared with WT mice. The administration of donepezil and memantine significantly increased the number of active avoidances on day 2 during the learning period in 5xFAD mice (Figure 2A, p < 0.05). The administration of QFY significantly increased the number of active avoidances on days 3 and 4 (Figure 2A, p < 0.05), and the AUC of active avoidance (Figure 2B, p < 0.01 in QFY high-dose group) during the learning period, and the number of active avoidances (Figure 2C, p < 0.05 in QFY low-dose group) during the test period. This data indicates that the ability to perform an active avoidance response was impaired in 5xFAD mice, whereas QFY administration improved it.
We used the Morris water maze to evaluate spatial learning and memory in mice. The results showed (Figure 2D–I) that the escape latency on the first day (Figure 2D, p < 0.05) and AUC of escape latency (Figure 2E, p < 0.01) during learning period, escape latency in testing period (Figure 2F, p < 0.05) were obviously increased in 5xFAD mice compared with WT mice, the number of platform crossings (Figure 2H, p < 0.05) was reduced significantly in 5xFAD mice compared with WT mice. The administration of donepezil and memantine significantly reduced the AUC of escape latency during the learning period (Figure 2E, p < 0.05) and during the testing period (Figure 2F, p < 0.01). The treatment of QFY significantly reduced the AUC of escape latency during the learning period (Figure 2E, p < 0.05 in QFY low-dose and high-dose groups, p < 0.01 in QFY medium-dose group) and escape latency (Figure 2F, p < 0.01 in three QFY groups) during the testing period, and also prolonged the time in the target quadrant (Figure 2G, p < 0.05 in low-dose QFY group), increased the number of crossings (Figure 2H, p < 0.05 in low-dose QFY), evidently. These results indicate spatial learning and memory deficits in 5xFAD mice and that QFY treatment ameliorated these deficits.
Administration of QFY alleviates aging in 5xFAD mice
After QFY administration, gait, grip strength, and colony nesting tests were used to evaluate mouse aging. The results (Figure 3A) showed that, compared with WT mice, run duration, run maximum variation, and the step sequence regularity index decreased significantly in 5xFAD mice (p < 0.05). Run average speed (Figure 3A, p < 0.05), right forelimb (RF) stand index (Figure 3A, p < 0.01), left hindlimb (LH) stand index (Figure 3A, p < 0.05), RF max contact (Figure 3A, p < 0.01), right hindlimb (RH) swing speed (Figure 3A, p < 0.05), LH swing speed (Figure 3A, p < 0.01) and duty cycle (FIGURE 3A, p < 0.05) in 5xFAD was significant increased. The treatment of donepezil and memantine increased RH, stand index left forelimb (LF) stand index (Figure 3A, p < 0.05) and decreased LH duty cycle (Figure 3A, p < 0.01), also reduced RH initial dual stance (Figure 3A, p < 0.05) and LH terminal dual stance (Figure 3A, p < 0.01) of 5xFAD mice. The administration of QFY reduced LH duty cycle (Figure 3A, p < 0.05 in QFY low- and p < 0.01 in medium-dose group), RH initial dual stance (Figure 3A, p < 0.05 in QFY low-dose and high-dose group, p < 0.01 in QFY medium-dose group) and LH terminal dual stance (Figure 3A, p < 0.05 in QFY low-dose group, p < 0.01, in QFY medium- and high-dose group), also increased the run duration (Figure 3A, p < 0.05 in QFY low-and medium-dose group), run maximum variation (Figure 3A, p < 0.05 in QFY low- and medium-dose group), step sequence regularity index (Figure 3A, p < 0.01 in QFY low- and medium-dose group), LF stand index (Figure 3A, p < 0.05 in QFY low-dose group) and LH stand index (Figure 3A, p < 0.05 in QFY low-dose group) of 5xFAD mice. These results indicate that 5xFAD mice exhibited an abnormal gait, which QFY treatment restored.
After QFY administration, a grip-strength test was conducted to assess forelimb strength. The experimental data (Figure 3B) show that the forelimb strength of the 5xFAD mice was significantly weaker than that of WT mice (p < 0.01). The administration of donepezil and memantine (Figure 3B, p < 0.01), QFY (Figure 3B, p < 0.01, in QFY low-dose and high-dose groups) significantly increased the grip strength of the 5xFAD mice. These studies suggest that forelimb strength in 5xFAD mice has been enhanced by QFY treatment.
The results of colony nesting test showed (Figure 3C–G) that the nesting score of the 5xFAD mice were significantly lower than the WT mice at 6 h (Figure 3C, p < 0.05), 12 h and 24 h after the start of colony nesting (Figure 3DE, p < 0.01), and the untorn tissue weight was significantly higher of 5xFAD mice (Figure 3F, p < 0.01). Administration with donepezil and memantine just decreases the untorn tissue weight (Figure 3F, p < 0.01). The treatment with QFY increased nesting scores at 12 h (Figure 3D; QFY p < 0.05 in the QFY medium-dose group) and 24 h (Figure 3E; QFY p < 0.05 in the QFY low- and medium-dose groups). Moreover, the untorn tissue weight was significantly lower in the QFY low- and medium-dose groups (Figure 3F, p < 0.01) and in the QFY high-dose group (Figure 3F, p < 0.05). These results indicated that QFY treatment enhanced daily activity in 5xFAD mice.
Treatment of QFY reduces the synaptic structure damage in the cerebral cortex of 5xFAD mice
After QFY treatment, the cerebral cortex of mice was collected to measure the protein levels of GAP-43, PSD-95, and SYN by ELISA. The results (Figure 4A–C) showed that the contents of GAP-43 (Figure 4A, p < 0.05), PSD-95 (Figure 4B, p < 0.01), and SYN (Figure 4C, p < 0.01) in the cerebral cortex of the 5xFAD mice were significantly lower than those in WT mice. The protein content of GAP-43 (Figure 4A, p < 0.05), PSD-95 (Figure 4B, p < 0.01), and SYN (Figure 4C, p < 0.01) significantly increased after the treatment of QFY. The results of Golgi-Cox staining (Figure 4D) showed that the length of dendrites in the cerebral cortex of the 5xFAD mice was shorter (Figure 4G, p < 0.05) than that of WT mice. The treatment with QFY tended to increase the length, number, and density of dendritic spines.
Treatment of QFY reduced Aβ deposition and cellular senescence in the brains of 5xFAD mice
Aβ deposition and cellular senescence play important roles in AD pathogenesis. We used a combination of SA-β-Gal staining and Aβ immunohistochemistry to assess co-localization between SA-β-Gal and Aβ plaques. The result showed there was a large amount of SA-β-Gal aggregation and Aβ plaque deposition in the cerebral cortex of 5xFAD mice (Figure 5A), while only a few SA-β-Gal aggregations and Aβ plaque depositions were found after QFY treatment (Figure 5A). In addition, there was co-localization of SA-β-Gal and Aβ plaque.
Immunofluorescence assays revealed that 5xFAD mice brains were heavily laden with both Aβ plaques and p21-positive cells (Figure 5B,C). Administration of QFY significantly curtailed cortical Aβ plaque and attenuated p21 expression in these animals (Figure 5B,C). The results of ELISA showed that compared with WT mice, the content of Aβ1-42 and the ratio of Aβ1-42/ AΒ1-40 was significantly increased in the hippocampus of 5xFAD mice (Figure 5D,F, p < 0.01), while the treatment of QFY reduced them obviously (Figure 5D, p < 0.01; Figure 5F, p < 0.05, respectively).
Senescent cells typically secrete large amounts of SASP factors. The results of Luminex analysis showed the contents of IL-1α (Figure 5G, p < 0.05), IL-1β (Figure 5H, p < 0.01), IL-17A (Figure 5J, p < 0.05), CCL3 (Figure 5K, p < 0.01), CCL4 (Figure 5L, p < 0.01), CCL5 (Figure 5M, p < 0.01) and IFN-γ (Figure 5N, p < 0.01) were significantly increased in cortex of 5xFAD mice. QFY treatment decreased the contents of IL-1α (Figure 5G, p < 0.05), IL-1β (Figure 5H, p < 0.05), IL-6 (Figure 5I, p < 0.05), IL-17A (Figure 5J, p < 0.05), and IFN-γ (Figure 5N, p < 0.01) in the cortex significantly.
These data indicate that cellular senescence appeared in the brain of 5xFAD mice, while the treatment of QFY reduced cellular senescence in 5xFAD mice.
Effects of QFY ameliorating cognitive impairment and reducing the aging of brain cells in 5xFAD mice correlated with synaptic damage
Principal component analysis (PCA) was performed to assess the overall SASP expression profiles (IL‑1α, IL‑1β, IL‑6, IL‑17A, CCL3, CCL4, CCL5, and IFN‑γ) among WT, 5xFAD, and QFY‑treated groups (Figure 6A). The first two principal components accounted for 44.11% and 23.46% of the total variance, respectively. As shown in the PCA score plot (Figure 6A), the WT group was clearly separated from the 5xFAD group. Notably, the QFY‑treated group showed an intermediate position, clustering more closely with the WT group than with the 5xFAD group, suggesting partial normalization of the SASP profile after QFY treatment. Statistical analysis of PC1 scores (Figure 6B) revealed that the 5xFAD group exhibited significantly higher PC1 values than the WT group. PC2 scores (Figure 6C) also showed significant differences between the 5xFAD and WT groups. Loading plot analysis (Figure 6D) indicated that IL‑1α, IL‑1β, and IFN‑γ were the major contributors to PC1, whereas IL‑6 and CCL3 contributed more substantially to PC2.
We performed Pearson correlation analyses between IL-1α, IL-1β, and IFN-γ and the contents of PSD-95, GAP-43, and SYN in the cortex, as well as the contents of Aβ1-40 and Aβ1-42 and the ratio of Aβ1-42/Aβ1-40 in the hippocampus, and developed heatmaps to visualize the interplay between synaptic-associated protein and SASP function. IL-1α, IL-1β, and IFN-γ levels positively correlated with the contents of Aβ1-40 and Aβ1-42 and the ratio of Aβ1-42/Aβ1-40 (Figure 6E, p < 0.05), and negatively correlated with the content of SYN protein. The levels of IL-1α and IFN-γ were negatively correlated with the content of GAP-43 protein, and IL-1β was negatively correlated with PSD-95 protein (Figure 6E, p < 0.05). These data suggest that IL-1α, IL-1β, and IFN-γ are major contributors to synaptic dysfunction.
Data Availability:
All raw data supporting the findings of this study have been deposited in Figshare and are accessible via the private reviewer link: https://doi.org/10.6084/m9.figshare.33208029.
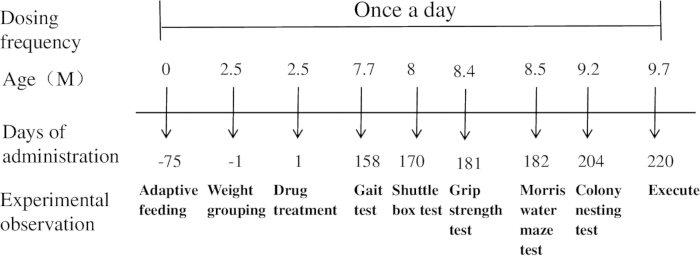
Figure 1: Schematic diagram of the experimental procedure. Please click here to view a larger version of this figure.
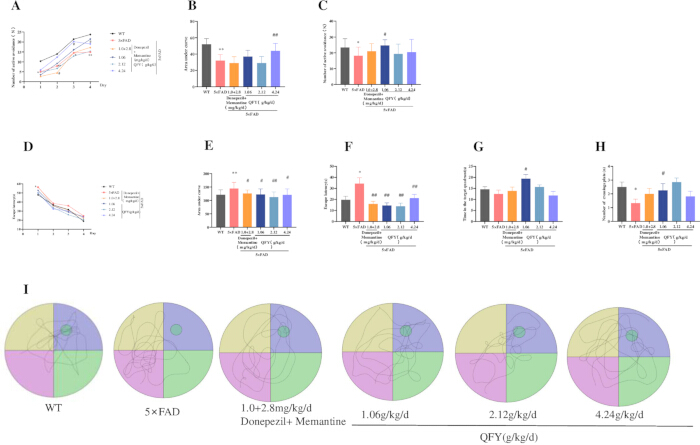
Figure 2: QFY administration improves learning and memory performance in 5xFAD mice. (A–C) Shuttle box test: (A) Number of active avoidance responses during the learning period. (B) Area under the curve (AUC) for active avoidance responses during the learning period. (C) Number of active avoidance responses during the test period. (D–I) Morris water maze test: (D) Escape latency during the learning period. (E) AUC for escape latency during the learning period. (F) Escape latency during the test period. (G) Time spent in the target quadrant. (H) Number of platform crossings. (I) Movement trajectories during the test period. Mean ± SD, n = 11–20 per group, with exact n indicated in each bar. * = p < 0.05, vs WT, Student`s t-test; # = p < 0.05, ## = p < 0.01, vs 5xFAD; One-way ANOVA followed by Dunnett's multiple comparisons test. Please click here to view a larger version of this figure.
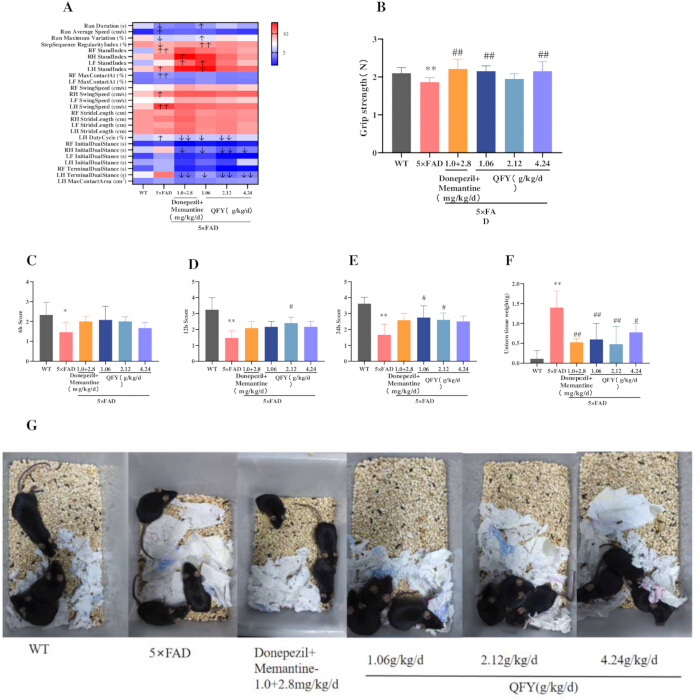
Figure 3: Effects of QFY administration on aging-associated functional measures in 5xFAD mice. (A) Gait heat map. The color scale is based on row‑wise Z‑score normalization, where red indicates values above the group mean, blue indicates values below the group mean, and white represents the mean level. (B) Grip strength test. (C–G) Colony nesting test: (C) Nesting score 6 h, (D) Nesting score at 12 h. (E) Nesting score at 24 h. (F) Untorn tissue weight. (G) Representative images of nests at 24 h. Mean ± SD, n = 3 per group, with exact n indicated in each bar. * = p < 0.05, ** = p < 0.01, vs WT, Student`s t-test; # = p < 0.05, ## = p < 0.01, vs 5x FAD, One-way ANOVA followed by Dunnett's multiple comparisons test. Please click here to view a larger version of this figure.
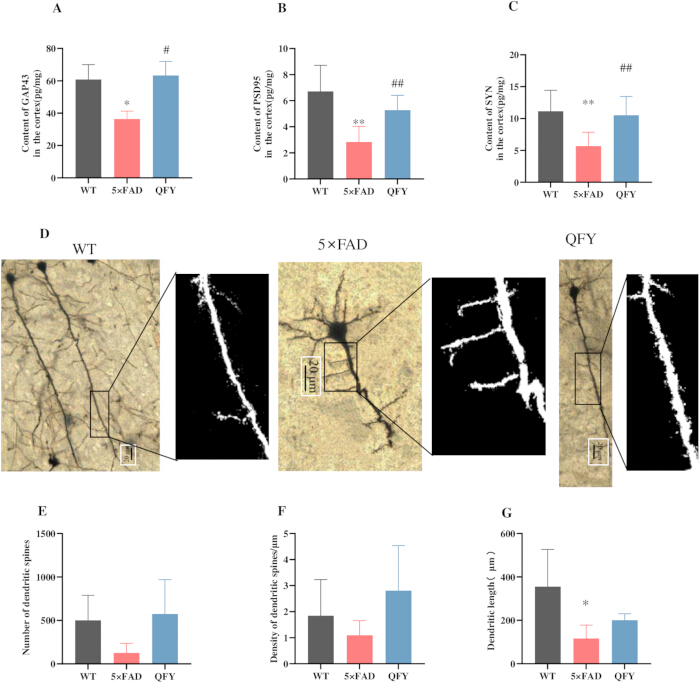
Figure 4: QFY attenuates synaptic structural alterations in the cerebral cortex of 5xFAD mice. (A) Content of GAP-43 in the cortex. (B) Content of PSD-95 in the cortex. (C) Content of SYN in the cortex. (D) Golgi-Cox staining. (E) Number of dendritic spines. (F) Density of dendritic spines. (G) Dendritic length. Mean ± SD, n = 3–14 per group, with exact n indicated in each bar. * = p < 0.05, ** = p < 0.01, vs WT, Student`s t-test; # = p < 0.05, ## = p < 0.01, vs 5xFAD, Student`s t-test. Please click here to view a larger version of this figure.
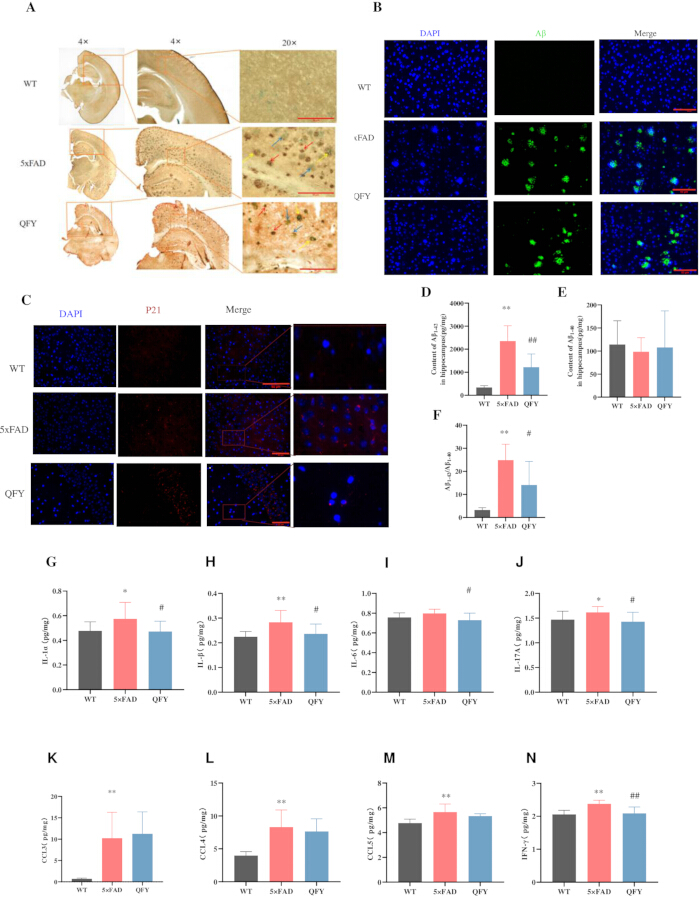
Figure 5: QFY reduced Aβ deposition and cell senescence in the brains of 5xFAD mice. (A) Combined SA-β-Gal staining and Aβ immunohistochemistry, SA-β-Gal (green, blue arrow), Aβ (brown, red arrow), SA-β-Gal + Aβ (yellow arrow), n = 3, Scale bar = 10 µm, 20x objective. (B) Immunofluorescence images showing Aβ in the cerebral cortex after treatment of QFY, n = 3, Scale bar = 50 µm, 40x objective. (C) Immunofluorescence images showing p21in the cerebral cortex after treatment of QFY. n = 1, Scale bar = 50 µm, 40x objective. (D–F) ELISA. (D) Content of Aβ1-42 in the hippocampus. (E) Content of Aβ1-40 in the hippocampus. (F) Aβ1-42/ Aβ1-40. (G–N) Luminex cytokine analysis. (G) Content of IL-1α in the cortex. (H) Content of IL-1β in the cortex. (I) Content of IL-6 in the cortex. (J) Content of IL-17A in the cortex. (K) Content of CCL3 in the cortex. (L) Content of CCL4 in the cortex. (M) Content of CCL5 in the cortex. (N) Content of IFN-γ in the cortex. Mean ± SD, n = 8–14 per group, with exact n indicated in each bar. * = p < 0.05, ** = p < 0.01, vs WT, Student’s t-test; # = p < 0.05 ## = p < 0.01, vs 5xFAD, Student’s t-test. Please click here to view a larger version of this figure.
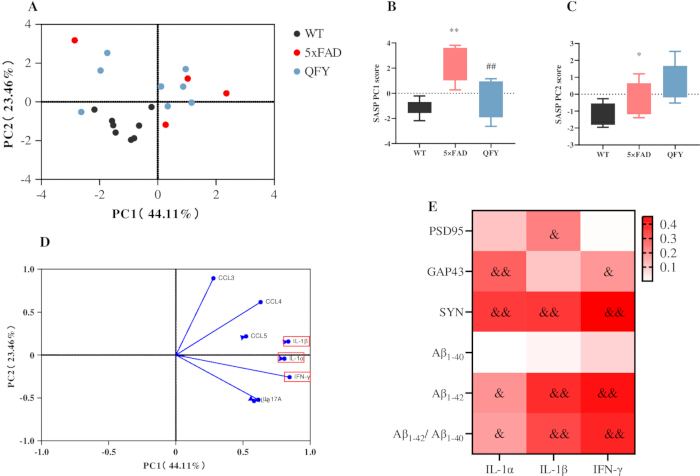
Figure 6: Principal component and correlation analyses of SASP factors, synaptic proteins, and Aβ levels in 5xFAD mice following QFY treatment. (A–D) Principal component analysis (PCA) of SASP factors. (A) PCA score plot. (B) PC1 scores. (C) PC2 scores. (D) PCA loading plot. (E) Heatmap generated from the correlation analysis between the SASP and PSD-95, GAP-43, SYN, Aβ1-40, Aβ1-42, and the ratio of Aβ1-42/Aβ1-40. Colors closer to red indicate higher R-values, while colors closer to white indicate lower R-values. Mean ± SD; n = 8 per group. * = p < 0.05, ** = p < 0.01,vs WT; ## = p < 0.01, vs 5xFAD, & = p < 0.05, && = p < 0.01, indicates a significant correlation. Pearson correlation analysis was used to assess associations between variables. Please click here to view a larger version of this figure.
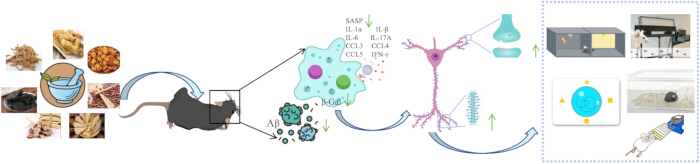
Figure 7: Proposed model of the effects of QFY on age-related cognitive decline and cellular senescence-associated phenotypes in 5xFAD mice. Please click here to view a larger version of this figure.
Diskussion
Die neuronale synaptische Plastizität spielt eine Schlüsselrolle bei der kognitiven Funktion. Im Gehirn von AD-Patienten breiten sich Aβ-Ablagerungen über verschiedene Regionen aus und verursachen direkt strukturelle Schäden an Synapsen, Verlust erregender Synapsen und kognitiven Abbau28. GAP-43 (ein präsynaptisches Membranprotein)29, PSD-95 (ein Gerüstprotein in der postsynaptischen Membran)30 und SYN (ein Phosphoprotein, das mit synaptischen Vesikeln assoziiert ist)31 spielen eine wichtige Rolle bei der synaptischen strukturellen Plastizität und der Pathogenese der AD32. Die vorliegende Studie zeigte, dass die Behandlung mit QFY das Lernen und Gedächtnis verbesserte, die Aβ-Plaque-Belastung verringerte und die synaptische Struktur durch Erhöhung der Anzahl dendritischer Dornen sowie der Proteinspiegel von GAP-43, PSD-95 und SYN im Gehirn von 5xFAD-Mäusen wiederherstellte.
Das Altern ist ein entscheidender Risikofaktor für die Entwicklung der Alzheimer-Krankheit (AD) und fördert die Produktion von Aβ. Zu den Kennzeichen des Alterns gehören abgenommene Muskelkraft, Gangunsicherheit und eingeschränkte Grundfunktionen des täglichen Lebens33,34. Die zelluläre Seneszenz, charakterisiert durch SA-β-Gal, wurde mit dem Altern sowie mit dem Auftreten altersbedingter Erkrankungen wie der AD in Verbindung gebracht11,35. Die selektive Beseitigung seneszenter Zellen verlängert die gesunde Lebensspanne und verzögert altersbedingte Erkrankungen36. Die Entfernung seneszenter Zellen durch genetische oder pharmakologische Ansätze verringerte die Aβ-Ablagerung und verbesserte Lern- und Gedächtnisfunktionen bei AD-Mausmodellen37. Eine Kombinationstherapie mit Dasatinib und Quercetin (D+Q) reduziert die Seneszenz von Oligodendrozyten-Vorläuferzellen, lindert Neuroinflammation, verringert Aβ-Plaques und SA-β-Gal-Aktivität, verhindert Aβ-Akkumulation und kognitive Beeinträchtigungen bei APP/PS1-Mäusen37. Die Behandlung mit Memantin senkte die SA-β-Gal-Aktivität im Gehirn von SAMP8-Mäusen signifikant und verbesserte das räumliche Lernen und Gedächtnis; denselben Effekt zeigte die Kombination von Memantin mit Donepezil38. Die vorliegende Studie zeigte, dass die QFY-Behandlung den Gang verbesserte, die Vordergliedmaßenmuskulatur stärkte und die Fähigkeiten in den Grundfunktionen des täglichen Lebens verbesserte, insbesondere durch die Minderung zellulärer Seneszenz, wie durch SA-β-Gal-Färbung im Gehirn von 5xFAD-Mäusen nachgewiesen.
Sowohl AD-Patienten als auch Tiermodelle weisen seneszente Astrozyten, Mikroglia, endotheliale Zellen und Neuronen auf39,40. Die Sekretion des SASP, zu dem Chemokine und entzündliche Zytokine gehören, ist ein charakteristisches Merkmal der zellulären Seneszenz; eine übermäßige SASP-Sekretion kann zu chronischer Entzündung führen, die Gewebeschäden und weitere zelluläre Seneszenz verursacht41. Die kontinuierliche Freisetzung von SASP, einschließlich IL-1α, IL-1β, IL-6, IL-8, IFN-γ, CCL2, CCL3, CCL4, CCL5, CXCL1 usw., fördert chronische Entzündungen, parakrine Seneszenz normaler Zellen, Veränderungen des zellulären Stoffwechsels und der epigenetischen Regulation sowie die anhaltende Produktion von Aβ42,43,44,45. Die Konzentrationen von IL-1α, IL-1β, IL-6, IL-17A und IFN-γ sind im Gehirn von AD-Patienten und AD-Modellen signifikant erhöht46. Untersuchungen haben gezeigt, dass D+Q die Sekretion entzündlicher Faktoren, einschließlich IL-1α und IFN-γ, hemmen sowie Aβ-Plaques und SA-β-Gal-Aktivität in APP/PS1-Mäusen reduzieren kann37. Die Studie ergab, dass QFY die Expression mehrerer SASP-Faktoren, darunter IL-1α, IL-1β, IL-6, IL-17A und IFN-γ, verringerte und dadurch das seneszente entzündliche Phänotyp abschwächte.
p21 gehört zur CIP/KIP-Familie der zyklusabhängigen Kinasen-Inhibitoren und wirkt als unmittelbare Bremse für Cyclin-CDK2/4-Komplexe, wodurch es eine G1/G2-Arrest vermittelt, wenn zellulärer Stress, DNA-Schäden und Alterung auftreten. Ein anhaltender Anstieg der p21-Konzentration wird weithin als Eintritt in ein stabiles seneszentes Programm interpretiert47,48. Aktuelle Daten zeigen, dass 5xFAD-Mäuse eine ungewöhnlich hohe zerebrale p21-Belastung aufweisen, die sich nach kombinierter Behandlung mit D+Q deutlich verringert49. In Übereinstimmung damit fand die vorliegende Studie, dass die Gabe von QFY die kortikalen Aβ-Plaques signifikant reduzierte und die p21-Expression bei diesen Tieren abschwächte.
Insgesamt deuten diese Befunde auf einen Zusammenhang zwischen der QFY-Behandlung und einer Verbesserung altersbedingter kognitiver Beeinträchtigungen sowie zellulärer Seneszenzphänotypen bei 5xFAD-Mäusen hin, verbunden mit einer verminderten synaptischen strukturellen Schädigung (Abbildung 7).
Mehrere Einschränkungen dieser Studie sollten anerkannt werden. Erstens wurden nur männliche 5xFAD-Mäuse verwendet, und es bleibt abzuklären, ob die beobachteten Effekte geschlechtsabhängig sind. Zweitens haben die vorliegenden Daten zwar starke Assoziationen zwischen abgeschwächten, seneszenzbezogenen Phänotypen und kognitiver Verbesserung gezeigt, wir haben jedoch keine direkten mechanistischen Interventionsstudien durchgeführt, um Kausalität zu belegen. Drittens ist die Übertragbarkeit der Ergebnisse auf die menschliche Alzheimer-Krankheit durch artspezifische Unterschiede und das Fehlen klinischer pharmakokinetischer Daten eingeschränkt. Zukünftige Studien, die weibliche Tiere, seneszenzspezifische Interventionen und sorgfältig geplante klinische Studien einbeziehen, sind erforderlich, um die Befunde zu erweitern.
Offenlegungen
Die Autoren erklären, dass keine Interessenkonflikte bestehen.
Danksagungen
Diese Arbeit wurde durch Zuschüsse der Nationalen Naturwissenschaftlichen Stiftung Chinas (82205078, 82374062), der Natürlichen Wissenschaftlichen Stiftung der Provinz Shandong (ZR2026MS1293, ZR2021QH157), des Projekts für Wissenschaft und Technologie der Traditionellen Chinesischen Medizin der Provinz Shandong (M20251730), der Wissenschafts- und Technologieprojekte der Autonomen Region Xizang, China (XZ202601ZY0167), sowie des Programms zur Technologieinnovationsförderung der Provinz Shandong (Fonds für die von der Zentralregierung geleitete wissenschaftliche und technologische Entwicklung auf lokaler Ebene) (YDZX2023137) unterstützt, mit dem Projekt mit dem Titel „Entwicklung und Industrialisierungsforschung von Tongli-Enterikumhüllten Kapseln als neuartige traditionelle chinesische Arzneimittel der Klasse 1“.
Materialien
| Name | Unternehmen | Katalognummer | Kommentare |
|---|---|---|---|
| Arzneimittel | |||
| Donepezil | Shanghai Yuanye Technology | lot.J15HB188725 | |
| Memantin | Shanghai Yuanye Technology | lot. J21HB189391 | |
| Qi-fu-yin | Forschungs- und Entwicklungscenter Houpu, Lunan Pharmaceutical | lot. 2209001 | |
| Verhaltensuntersuchungen | |||
| CatWalk XT | Noldus | CatWalkXT 10.0-Software | |
| Kraftmessgerät für den Griff | Bileadbiosci | BLD-ZL-20 | |
| Morris-Wasserlabyrinth | Shanghai Xinruan Information Technology Co., Ltd | 120 cm | |
| Shuttle-Box | Shanghai Xinruan Information Technology Co., Ltd | XR-XC404 | |
| Antikörper | |||
| Anti-Aβ1-42-Antikörper | Abcam | Cat# ab201061 | |
| Anti-p21/CIP1/CDKN1A-Antikörper | Novus Biologicals | Cat# NBP3-15661 | |
| Test-Kits | |||
| Aβ1-40-ELISA-Kit | Thermo Fisher Scientific | Cat# KHB3482 | |
| Aβ1-42-ELISA-Kit | Thermo Fisher Scientific | Cat# KHB3442 | |
| Bio-Plex Pro Mouse Cytokine 23-plex Assay-Kit | R&D Systems | Cat# LXLBM23-1 | |
| GAP-43-ELISA-Kit | Jiangsu Enzyme Immunoassay Industry | Cat# MM-47506M1 | |
| Golgi-Cox-Färbekit | BeiJing Biolead Biology Sci & Tech Co | Cat# PK401 | |
| PSD-95-ELISA-Kit | Jiangsu Enzyme Immunoassay Industry | Cat# MM-45953M1 | |
| Seneszenz-β-Galactosidase-Färbekit | Beyotime | Cat# C0602 | |
| Synaptophysin (SYN)-ELISA-Kit | Jiangsu Enzyme Immunoassay Industry | Cat# MM-46504M1 | |
| Chemikalien & Reagenzien | |||
| Anti-Kaninchen- und Maus-IgG (sekundärer Antikörper) | Starter | Cat# S0C1001 | |
| DAB-Chromogen | Starter | Cat# S0C1001 | |
| Software | |||
| CatWalk XT | Noldus Information Technology | Version 10.0 | |
| ImageJ | National Institutes of Health (NIH) | Version 1.53 |
Referenzen
- Joe E, Ringman JM. Cognitive symptoms of Alzheimer's disease: clinical management and prevention. BMJ. 2019;367:l6217.
- Scheff SW, et al. Synaptic alterations in CA1 in mild Alzheimer disease and mild cognitive impairment. Neurology. 2007;68(18):1501-8.
- Muralidar S, et al. Role of tau protein in Alzheimer's disease: the prime pathological player. Int J Biol Macromol. 2020;163:1599-617.
- Hardy JA, Higgins GA. Alzheimer's disease: the amyloid cascade hypothesis. Science. 1992;256(5054):184-5.
- Calsolaro V, Edison P. Neuroinflammation in Alzheimer's disease: current evidence and future directions. Alzheimers Dement. 2016;12(6):719-32.
- Campisi J. Senescent cells, tumor suppression, and organismal aging: good citizens, bad neighbors. Cell. 2005;120(4):513-22.
- Yao R. An in-silico assessment suggests the potential effects of goji (fruit of Lycium barbarum L.) against aging-related diseases. Food Med Homol. 2025;2(2):9420036.
- Campisi J, d'Adda di Fagagna F. Cellular senescence: when bad things happen to good cells. Nat Rev Mol Cell Biol. 2007;8(9):729-40.
- Salminen A, Kaarniranta K, Kauppinen A. ER stress activates immunosuppressive network: implications for aging and Alzheimer's disease. J Mol Med (Berl). 2020;98(5):633-50.
- Mirabella F, et al. Prenatal interleukin 6 elevation increases glutamatergic synapse density and disrupts hippocampal connectivity in offspring. Immunity. 2021;54(11):2611-31.e8.
- Baker DJ, Petersen RC. Cellular senescence in brain aging and neurodegenerative diseases: evidence and perspectives. J Clin Invest. 2018;128(4):1208-16.
- Lucas V, Cavadas C, Aveleira CA, Hook V. Cellular senescence: from mechanisms to current biomarkers and senotherapies. Pharmacol Rev. 2023;75(4):675-713.
- Bloss EB, et al. Evidence for reduced experience-dependent dendritic spine plasticity in the aging prefrontal cortex. J Neurosci. 2011;31(21):7831-9.
- Ye XS, et al. The food and medicine homologous Chinese medicine from Leguminosae species: a comprehensive review on bioactive constituents with neuroprotective effects on nervous system. Food Med Homol. 2025;2(2):9420033.
- Dickstein DL, Weaver CM, Luebke JI, Hof PR. Dendritic spine changes associated with normal aging. Neuroscience. 2013;251:21-32.
- Wang SY, et al. Qifu-Yin attenuates AGEs-induced Alzheimer-like pathophysiological changes through the RAGE/NF-kappaB pathway. Chin J Nat Med. 2014;12(12):920-8.
- Yang X, et al. Qi-fu-yin attenuated cognitive disorders in 5xFAD mice of Alzheimer's disease animal model by regulating immunity. Front Neurol. 2023;14:1183764.
- Xiao QY, et al. Effects of Qi-Fu-Yin on aging of APP/PS1 transgenic mice by regulating the intestinal microbiome. Front Cell Infect Microbiol. 2023;12:1048513.
- Chen K, et al. Safety and toxicity of Qi-Fu Yin, a classical traditional Chinese medicine prescription: a nonclinical research. J Appl Toxicol. 2025;45(9):1811-38.
- Wang L, Qiao P, Yue L, Sun R. Is Qi Fu Yin effective in clinical treatment of dementia? A meta-analysis of 697 patients. Medicine (Baltimore). 2021;100(5):e24526.
- Li H, et al. Identification of chemical components of Qi-Fu-Yin and its prototype components and metabolites in rat plasma and cerebrospinal fluid via UPLC-Q-TOF-MS. Evid Based Complement Alternat Med. 2021;2021:1995766.
- Lei X, et al. Integrating network pharmacology and component analysis to study the potential mechanisms of Qi-Fu-Yin Decoction in treating Alzheimer's disease. Drug Des Devel Ther. 2023;17:2841-58. doi:10.2147/DDDT.S402624.
- Takeshita H, et al. Modified forelimb grip strength test detects aging-associated physiological decline in skeletal muscle function in male mice. Sci Rep. 2017;7:42323.
- Caggiano V, et al. Midbrain circuits that set locomotor speed and gait selection. Nature. 2018;553(7689):455-60.
- Ehret B, et al. Population-level coding of avoidance learning in medial prefrontal cortex. Nat Neurosci. 2024;27(9):1805-15.
- Curdt N, et al. Search strategy analysis of Tg4-42 Alzheimer mice in the Morris water maze reveals early spatial navigation deficits. Sci Rep. 2022;12:5451.
- Deacon RMJ. Assessing nest building in mice. Nat Protoc. 2006;1(3):1117-9.
- Tu S, Okamoto SI, Lipton SA, Xu H. Oligomeric Aβ-induced synaptic dysfunction in Alzheimer's disease. Mol Neurodegener. 2014;9:48.
- Benowitz LI, Routtenberg A. GAP-43: an intrinsic determinant of neuronal development and plasticity. Trends Neurosci. 1997;20(2):84-91.
- Dore K, et al. PSD-95 protects synapses from β-amyloid. Cell Rep. 2021;35(9):109194.
- Kokotos AC, et al. Synaptophysin sustains presynaptic performance by preserving vesicular synaptobrevin-II levels. J Neurochem. 2019;151(1):28-37.
- Martin SB, et al. Synaptophysin and Synaptojanin-1 in Down syndrome are differentially affected by Alzheimer's disease. J Alzheimers Dis. 2014;42(3):767-75.
- Namioka N, et al. Oxidative stress and inflammation are associated with physical frailty in patients with Alzheimer's disease. Geriatr Gerontol Int. 2016;17(6):913-8.
- Kojima G, Liljas A, Iliffe S, Walters K. Prevalence of frailty in mild to moderate Alzheimer's disease: a systematic review and meta-analysis. Curr Alzheimer Res. 2017;14(12):1256-63.
- Dimri GP, et al. A biomarker that identifies senescent human cells in culture and in aging skin in vivo. Proc Natl Acad Sci U S A. 1995;92(20):9363-7.
- Baker DJ, et al. Naturally occurring p16Ink4a-positive cells shorten healthy lifespan. Nature. 2016;530(7589):184-9.
- Zhang P, et al. Senolytic therapy alleviates Abeta-associated oligodendrocyte progenitor cell senescence and cognitive deficits in an Alzheimer's disease model. Nat Neurosci. 2019;22(5):719-28.
- Ota H, Ogawa S, Ouchi Y, Akishita M. Protective effects of NMDA receptor antagonist, memantine, against senescence of PC12 cells: a possible role of nNOS and combined effects with donepezil. Exp Gerontol. 2015;72:109-16.
- Herdy JR, et al. Increased post-mitotic senescence in aged human neurons is a pathological feature of Alzheimer's disease. Cell Stem Cell. 2022;29(12):1637-52.e6.
- Hu Y, et al. Replicative senescence dictates the emergence of disease-associated microglia and contributes to Abeta pathology. Cell Rep. 2021;35(10):109228.
- Tchkonia T, et al. Cellular senescence and the senescent secretory phenotype: therapeutic opportunities. J Clin Invest. 2013;123(3):966-72.
- Guerrero A, De Strooper B, Arancibia-Cárcamo IL. Cellular senescence at the crossroads of inflammation and Alzheimer's disease. Trends Neurosci. 2021;44(9):714-27.
- Acosta JC, et al. A complex secretory program orchestrated by the inflammasome controls paracrine senescence. Nat Cell Biol. 2013;15(8):978-90.
- Wang B, Han J, Elisseeff JH, Demaria M. The senescence-associated secretory phenotype and its physiological and pathological implications. Nat Rev Mol Cell Biol. 2024;25(12):958-78.
- Gaikwad S, Senapati S, Haque MA, Kayed R. Senescence, brain inflammation, and oligomeric tau drive cognitive decline in Alzheimer's disease: evidence from clinical and preclinical studies. Alzheimers Dement. 2024;20(1):709-27.
- Si Z, Sun L, Wang X. Evidence and perspectives of cell senescence in neurodegenerative diseases. Biomed Pharmacother. 2021;137:111327.
- Chen X, et al. Senescence-like changes induced by expression of p21Waf1/Cip1 in NIH3T3 cell line. Cell Res. 2002;12(3-4):229-33.
- Engeland K. Cell cycle regulation: p53-p21-RB signaling. Cell Death Differ. 2022;29(5):946-60.
- Choi I, et al. Autophagy enables microglia to engage amyloid plaques and prevents microglial senescence. Nat Cell Biol. 2023;25(7):963-74.