Diese Studie stellt RareCode vor, ein unüberwachtes Deep-Learning-Framework, das Anomalien in histopathologischen Bildern des kolorektalen Karzinoms erkennt, indem es die Seltenheit der Codebucharaktivierung (CAR) analysiert, und das Potenzial besitzt, die Vorscreening-Phase ohne beschriftete Trainingsdaten zu unterstützen.
Forschungsartikel
RareCode: Ein Framework für unüberwachtes Deep Learning zur Anomalieerkennung in histopathologischen Bildern von kolorektalem Karzinom
In diesem Artikel
Zusammenfassung
Zusammenfassung
Die unüberwachte Anomalieerkennung in histopathologischen Bildern wurde bisher häufig mithilfe rekonstruktionsbasierter Ansätze erforscht, die Rekonstruktionsfehler messen, doch diese Methoden versagen oft beim Erfassen subtiler, semantischer pathologischer Variationen aufgrund der inhärenten Heterogenität der Gewebestrukturen. Um diese Einschränkung zu überwinden, stellt diese Studie RareCode vor, ein auf Vektorquantisierung basierendes Framework, das das Erkennungsparadigma über die pixelbasierte Rekonstruktion hinaus erweitert und stattdessen die Analyse der semantischen Codebuchaktivierung einbezieht. Die zentrale Innovation ist die Codebuch-Aktivitäts-Seltenheitsbewertung (Codebook Activation Rarity, CAR), die die Aktivierungshäufigkeit jedes Codebucheintrags während des Trainings ausschließlich mit normalen Proben erfasst und bei der Inferenz seltene Aktivierungen als Anomalieindikatoren markiert, wodurch Rekonstruktionsfehler durch semantische Differenzierung ergänzt werden. Aufbauend auf diesem einstufigen CAR-Mechanismus wird ein mehrstufiges hierarchisches Codebuch-Modul (Multi-scale Hierarchical Codebook, MHC) eingeführt, das Codebücher unterschiedlicher Größe mit lernbaren Fusionsgewichten verwendet, um pathologische Muster abzudecken, die von groben gewebebasierten Strukturen bis hin zu feinen zellulären Details reichen. Unter Nutzung des mehrstufigen Designs werden hierarchische Anomalie-Heatmaps auf jeder Codebuch-Granularitätsebene generiert, die Pathologen interpretierbare, mehrdimensionale visuelle Lokalisierungshinweise liefern, aus denen hervorgeht, wo und auf welcher strukturellen Ebene Anomalien auftreten. Eine Fünf-fache Kreuzvalidierung an einem klinisch annotierten Datensatz histopathologischer Bilder von kolorektalem Karzinom, erhoben am Shenzhen People's Hospital, zeigt, dass RareCode eine Fläche unter der Kurve (AUC) von 96,82 % erreicht und damit die Baseline-Methoden übertrifft. Die klassenspezifische Analyse ergab eine bessere Leistung bei der Krebserkennung (AUC = 99,44 %, Spezifität = 94,21 %) im Vergleich zur Entzündungserkennung (AUC = 94,30 %, Spezifität = 60,44 %). Diese Ergebnisse deuten darauf hin, dass die CAR-Analyse einen aussichtsreichen unüberwachten Ansatz für die histopathologische Anomalieerkennung darstellen könnte und möglicherweise die klinische Vorscreening-Diagnostik beim kolorektalen Karzinom unterstützen kann.
Einleitung
Die zuverlässige histopathologische Untersuchung auf Darmkrebs bleibt durch die Notwendigkeit sachkundiger Annotationen und manueller Überprüfung eingeschränkt, insbesondere wenn entzündliche Läsionen und Malignome eine überlappende Morphologie aufweisen1,2. Diese Einschränkungen motivieren unüberwachte computergestützte Ansätze, die aus normalem Gewebe lernen, ohne umfassende Annotationen von Abnormalitäten zu erfordern3,4.
Die klinische Dringlichkeit einer automatisierten histopathologischen Untersuchung wird durch das wachsende Missverhältnis zwischen diagnostischem Bedarf und verfügbarer pathologischer Expertise unterstrichen, wobei die diagnostische Arbeitslast pro US-Pathologe innerhalb eines Jahrzehnts um über 40 % gestiegen ist, während die Zahl der Pathologen weiter abnimmt5. Bei Darmkrebs (CRC) wurden organisierte Früherkennungsprogramme mit einer Verringerung der Sterblichkeit um 29–68 % assoziiert6, doch die Kapazität für manuelle pathologische Befundung bleibt durch die Verfügbarkeit des Personals begrenzt. Ein automatisiertes Vorscreening-System, das verdächtige Fälle zuverlässig zur Prioritätsprüfung identifiziert, könnte diese Belastung verringern und die diagnostische Durchlaufzeit verbessern. Allerdings erfordert der Einsatz solcher Systeme sowohl eine hohe Sensitivität, um echte positive Befunde nicht zu übersehen, als auch eine ausreichende Spezifität, um übermäßige Fehlalarme zu vermeiden7.
Die unüberwachte Anomalieerkennung (UAD) gewinnt in der medizinischen Bildanalyse zunehmend an Bedeutung8, da sie normale Gewebemuster ohne die Notwendigkeit abnormer Trainingslabels modellieren kann3,9,10. Rekonstruktionsbasierte Modelle, darunter Autoencoder, Variational Autoencoder, Generative Adversarial Networks und speichererweiterte Varianten, identifizieren Anomalien anhand von Rekonstruktionsfehlern, doch leistungsstarke Decoder können abnorme Bereiche dennoch mit hoher Genauigkeit rekonstruieren11,12,13,14,15,16,17. Merkmalsbasierte Verfahren wie PatchCore und PaDiM nutzen vortrainierte Repräsentationen, wobei jedoch aus natürlichen Bildern gelernte Merkmale möglicherweise mikroskopische Atypien in der histopathologischen Analyse nicht vollständig erfassen18,19,20,21. Auf Pathologie spezialisierte Grundmodellarchitekturen und diffusionsbasierte Anomalieerkennungssysteme bieten leistungsfähige Alternativen, ihre Datennutzung oder hohen Rechenkosten können jedoch die direkte Anwendung in Hochdurchsatz-Screenings einschränken22,23. Neuere automatisierte und evolutionäre Ansätze wie EvoAAE24 und MoARNN-AM25 verdeutlichen weiterhin den Nutzen adaptiver Modelloptimierung für die Anomalieerkennung, wobei sich ihre Anwendungskontexte von der histopathologischen Bildanalyse unterscheiden. Im Gegensatz dazu erzwingen vektorquantisierungsbasierte (VQ) Methoden diskrete Codebucheinschränkungen, die Identitätsabbildungen reduzieren können; bestehende VQ-basierte Ansätze stützen sich jedoch weiterhin hauptsächlich auf räumliche Rekonstruktionsfehler und nutzen die semantische Information in den Codebuch-Aktivierungsmustern unzureichend aus26,27.
Obwohl die oben genannten Methoden in allgemeinen Bereichen vielversprechende Leistungen zeigen, ergeben sich bei ihrer Anwendung auf komplexe histopathologische Szenarien spezifische Herausforderungen. Histopathologische Bilder zeichnen sich durch komplexe Gewebeheterogenität über mehrere strukturelle Ebenen hinweg aus28. In der Praxis erfolgt die Bildanalyse typischerweise an lokalen Bildausschnitten, die aus Gewebeschnitten extrahiert werden, und die pathologische Diagnose ist per se mehrskalig: Pathologen bewerten die Drüsen- und Gewebemorphologie bei geringer Vergrößerung, während sie bei hoher Vergrößerung das nukleäre Pleomorphismus und Mitosefiguren untersuchen29. Wir identifizieren drei wesentliche Einschränkungen der derzeitigen Ansätze: Erstens weisen pathologische Anomalien und normales Gewebe eine hohe Ähnlichkeit in visuellen Merkmalen niedriger Stufe wie Färbungsstilen und lokalen Texturen auf, wodurch rekonstruktionsbasierte Methoden versagen, subtile Anomalien zu erkennen, da sowohl normale als auch anormale Proben eine ähnliche Rekonstruktionsqualität auf semantischer Ebene erzeugen können. Zweitens verwenden die meisten bestehenden Methoden eine einheitliche, einstufige Merkmalsextraktion, wodurch es schwierig ist, anomale Merkmale gleichzeitig auf Gewebe- und Zellebene zu erfassen30,31. Drittens können gängige Methoden zwar pixelgenaue Heatmaps erzeugen, erfassen jedoch oft nicht intuitiv die hierarchischen Eigenschaften von Anomalien, was die Nützlichkeit solcher Modelle als klinische Diagnosehilfen einschränkt.
Um die oben genannten Herausforderungen zu bewältigen, schlagen wir RareCode vor, ein UAD-Framework, das Aktivierungsmuster von Codebüchern und hierarchische Merkmalsdarstellungen auf mehreren Abstraktionsebenen untersucht. Das Framework führt drei Hauptkomponenten ein: (1) Codebook Activation Rarity (CAR) Scoring-Mechanismus, der Seltenheitswerte basierend auf Aktivierungshäufigkeiten von Einträgen berechnet, die ausschließlich an normalen Proben trainiert wurden, um normale von anomalen Proben auf semantischer Ebene zu unterscheiden und komplementäre diskriminative Signale gegenüber traditionellen räumlichen Rekonstruktionsfehlern bereitzustellen. (2) Multi-Skalen-Hierarchische Codebuch (MHC)-Fusionsarchitektur, die pathologische Merkmale auf mehreren Granularitätsebenen – von groben Strukturmustern bis hin zu feinkörnigen zellulären Details – erfasst, indem Codebücher mit unterschiedlichen Kapazitäten eingesetzt werden, wobei eine adaptive Fusion durch lernbare Gewichtungen erreicht wird. (3) Hierarchisches interpretierbares Lokalisierungsmodul, das die Multi-Skalen-Architektur nutzt, um Anomalie-Heatmaps auf unterschiedlichen Granularitätsstufen zu erzeugen und Pathologen multi-skalierte, semantisch interpretierbare diagnostische Referenzen zur Verfügung zu stellen.
Die primäre Hypothese dieser Studie war, dass Aktivierungshäufigkeitsprofile von Codebüchern, die ausschließlich anhand normaler histopathologischer Kolorektalbilder trainiert wurden, semantische Informationen erfassen, die über den pixelbasierten Rekonstruktionsfehler hinaus für Anomalien relevant sind, und dass die Integration dieser komplementären Signale auf mehreren Skalen die Unterscheidung von Bildern mit bösartigem oder entzündlichem Gewebe von normalen Bildern im Vergleich zu repräsentativen UAD-Methoden verbessert, gemessen hauptsächlich anhand der AUC. Um diese Hypothese zu überprüfen, bewerteten wir RareCode mittels 5-facher Kreuzvalidierung an einem klinisch annotierten CRC-Datensatz und führten Ablations- und Lokalisierungsanalysen durch, um die Beiträge und die Interpretierbarkeit seiner Kernkomponenten zu untersuchen.
Protokoll
This study was approved by the Clinical Research Ethics Committee of Shenzhen People's Hospital (Approval No. LL-KY-2025300-01). The requirement for informed consent was waived by the ethics committee because this retrospective study used existing histopathological images and clinical materials without direct patient contact or intervention. All clinical data and histopathological images were de-identified before analysis, and no personally identifiable information was used in this study. All data used in this research were handled in accordance with the ethical standards of the institutional and national research committees.
Framework overview
The overall architecture of the proposed UAD framework, RareCode, is illustrated in Figure 1. The framework employs a parallel dual-branch architecture. For each 512 x 512 input image, non-overlapping 32 x 32 and 64 x 64 patches are extracted as fine- and coarse-scale inputs, respectively. The 64 x 64 patches are resized to 32 x 32 before being passed to the network so that both branches share the same encoder-decoder input size while preserving different receptive fields. Encoders in each branch map the extracted features into a latent space, where the MHC module imposes discretization constraints. Subsequently, decoders reconstruct the image from quantized features to compute spatial-domain reconstruction errors. The CAR mechanism then measures the degree of semantic-level anomaly by profiling codebook activation frequencies. Finally, the model fuses reconstruction scores and CAR scores through a weighted combination to obtain image-level anomaly scores. The RareCode framework is trained end-to-end using only normal samples, requiring no anomaly annotations. The dual-branch design was used to capture both local cellular features and broader glandular structures. The MHC module was used to model these features with codebooks of different capacities.
Encoder-decoder architecture
RareCode constructs structurally independent encoders and decoders for the fine- and coarse-scale branches. Each branch uses the same encoder-decoder design but does not share parameters. The encoder consists of four convolutional blocks, each including a 3 x 3 convolution, batch normalization, ReLU activation, and dropout. The channel width increases from 64 to 128, then to 256, and the final feature map is flattened and projected into a 64-dimensional latent embedding. The decoder mirrors the encoder with a fully connected projection layer followed by four transposed convolution layers, reconstructing each patch to the original input size of the network. Reconstruction error is calculated as the mean squared error between the input and reconstructed patches. By combining this encoder-decoder structure with discrete codebook constraints, RareCode learns compact representations of normal tissue and measures deviations during inference.
Multi-scale hierarchical codebook
To capture pathological features at multiple levels of abstraction—from broad tissue patterns to localized cellular variations—the MHC module employs K discrete codebooks  with varying capacities n1, n2, ..., nK. In the final FourScales configuration, each branch contains four codebooks with 64, 128, 256, and 512 entries, respectively, and each codebook entry has a 64-dimensional embedding. For each encoded patch feature, the nearest codebook entry is selected according to Euclidean distance. The quantized outputs from different codebooks are then fused using learnable weights normalized across codebooks. Smaller codebooks, due to stronger compression constraints, are expected to encode coarse-grained prototypical patterns that abstract away local variations, whereas larger codebooks preserve finer-grained features that capture more specific structural characteristics. For each codebook
  , where ek(i)
  Rd denotes the i-th embedding vector in the k-th codebook, continuous features are mapped to the discrete codebook space via nearest neighbor lookup (Eq. 1 and 2):


To achieve adaptive fusion of multi-scale features, we introduce learnable weights . After softmax normalization, weighted summation is performed over the quantized outputs from each codebook (Eq. 3):

where σ(·) denotes the softmax function, ensuring that weights satisfy Σk σ(wk) = 1. This design enables the model to automatically adjust the contribution ratios of codebooks at different granularities based on the semantic content of the input features.
To optimize codebook learning, we adopt the standard VQ loss function (Eq. 4):

where sg[·] denotes the stop-gradient operation, and β = 0.25 is the commitment loss weight coefficient. The first term encourages codebook vectors to move toward encoder outputs, while the second term encourages encoder outputs to remain consistent with their corresponding codebook vectors. The complete mechanism of multi-scale VQ is illustrated in Figure 2.
Codebook activation rarity scoring
CAR measures semantic-level anomalies based on codebook activation statistics estimated from normal training samples. After model training, all normal training images were passed through the encoder and MHC module without data augmentation. For each branch and each codebook, the assignment index of every patch feature was recorded, and the number of assignments to each codebook entry was counted. The counts were then normalized to obtain the activation-frequency distribution for that codebook (Eq. 5):

During inference, each test image was processed through the same patch extraction, encoding, and nearest-neighbor codebook assignment procedure. For each assigned codebook entry, the rarity score is calculated as the negative logarithm of its activation frequency in the normal training set (Eq. 6):

where ε is a small constant used for numerical stability. A low-frequency codebook entry, therefore, receives a higher rarity score, suggesting that the corresponding patch feature is less consistent with the learned normal-tissue distribution. Patch-level rarity scores were averaged within each image and across the fine- and coarse-scale branches to obtain an image-level rarity response.
To complement activation-frequency rarity, we also compute a percentile-based quantization distance score (Eq. 7):

This score is derived from the Euclidean distance between each encoded feature vector and its nearest codebook entry. The distance distribution is estimated from normal training samples, and test-sample distances are converted into percentile scores. Larger percentile scores indicate that the encoded feature is more difficult to represent using the learned normal codebook prototypes.
The final CAR score combines activation rarity and quantization distance across all codebooks using the learnable codebook weights (Eq. 8):

The same normalized codebook weights used for multi-scale feature fusion are applied to score-level fusion, maintaining consistency between representation learning and anomaly scoring. The resulting CAR score is calculated at the image level and is then combined with the reconstruction score to obtain the final anomaly score. The overall CAR scoring mechanism is illustrated in Figure 3.
Final anomaly score computation
We fuse spatial-domain reconstruction errors with semantic-level CAR scores. Before fusion, both scores are separately normalized using percentile-based min-max normalization to reduce the influence of extreme outliers. The final image-level anomaly score is then defined as (Eq. 9):

where Srecon denotes the normalized mean squared reconstruction error, reflecting sample reconstruction quality in pixel space; SCAR is the CAR score described above, capturing degrees of semantic-level anomaly. The hyperparameter α [0,1] controls the relative weighting between the two components, with optimal values determined on validation sets.
Training objective
The RareCode framework is trained end-to-end using only normal samples. The total training loss comprises the following components (Eq. 10):

Each term is defined as follows: Reconstruction Loss:  , measuring the mean squared error between input patches p and reconstructed patches D(zq) after quantization. This loss is applied separately to the 32 × 32 patch branch (
 ) and 64 × 64 patch branch (
 ) to ensure effective learning of features at both spatial scales.
Dataset description
To evaluate RareCode, experiments were conducted on a clinically annotated CRC histopathological image dataset comprising images of colorectal tissue sections stained with hematoxylin and eosin (H&E), obtained from Shenzhen People's Hospital. All images in this dataset originate from real clinical cases. Images were digitized at 40x magnification with an original resolution of 1024 × 1024 pixels. To ensure annotation reliability and quality, all sample category labels were jointly reviewed and confirmed by two or more senior professional pathologists following a double-blind protocol.
Based on histopathological characteristics, the dataset was categorized into three classes: normal tissue (1,226 images), cancer (1,215 images), and inflammation (1,214 images). In the binary UAD setting, cancer and inflammation samples were treated as anomalous, while normal samples served as the reference distribution. This formulation reflects the intended triage task of separating cases requiring further pathological review from those that are morphologically normal.
All H&E-stained images were resized to 512 × 512 pixels before being used as network input. Stratified 5-fold cross-validation was used for evaluation. In each fold, the normal samples were first divided into training, validation, and held-out test subsets. RareCode was trained only on the training normal samples. The validation subset, which also contained only normal samples, was used for model selection, hyperparameter tuning, and selection of the fusion weight α. The held-out test set, consisting of unseen normal samples and anomalous samples including cancer and inflammation, was used only for final performance evaluation and was not used for model training, hyperparameter selection, or α selection. The representative categories, dataset structure, and validation protocol are shown in Figure 4.
Implementation details
The proposed RareCode framework and comparison baselines were implemented using PyTorch. All experiments were conducted on a workstation equipped with a single NVIDIA GeForce RTX 4060 Ti GPU (16 GB). For network architecture configuration, to capture features at different spatial extents, the dual-branch architecture processes non-overlapping patches at two scales: 32 × 32 pixels (smaller receptive field, capturing local texture patterns) and 64 × 64 pixels (larger receptive field, capturing broader spatial context), respectively. The continuous feature embedding dimension produced by both branch encoders is uniformly set to 64. In the MHC module, we configure four codebooks with different capacities for each branch, with discrete prototype quantities of 64, 128, 256, and 512, respectively.
During optimization, the network was trained end-to-end for 50 epochs with a batch size of 8. We employ the AdamW optimizer for weight updates, with an initial learning rate of 5 × and weight decay of to prevent overfitting. Additionally, to ensure smooth training convergence, a cosine annealing learning rate schedule was used, enabling finer optimization in later training stages. Patch sizes and codebook sizes were selected to balance multi-scale representation and computational cost. The final FourScales configuration was supported by ablation analysis, and α was selected on the validation set before test-set evaluation.
For the decoder-complexity ablation, a complex-decoder variant was implemented based on the FourScales configuration. This variant used the same data split, codebook sizes, training epochs, optimizer, learning rate, validation-based α selection, and evaluation metrics as the FourScales model. The basic decoder was replaced with an EMCAD-style decoder containing multi-scale depthwise convolution blocks and Convolutional Block Attention Modules (CBAM). After each of the first three transposed-convolution upsampling stages, parallel 3 × 3, 5 × 5, and 7 × 7 depthwise convolutions were applied, followed by 1 × 1 pointwise fusion, batch normalization, ReLU activation, a residual connection, and CBAM attention. CBAM included channel attention based on average- and max-pooling descriptors and spatial attention using a 7 × 7 convolution. The final stage used transposed convolution and sigmoid activation to reconstruct 32 × 32 patches.
Ergebnisse
Comparison with baseline methods
To evaluate the RareCode framework, multiple representative UAD methods were selected as baselines, spanning reconstruction-based methods (CAE32, VAE12, SAE33, MAE34, PatchSAE35), memory-augmented reconstruction (MemAE36), knowledge distillation (STFPM37), synthetic anomaly generation (DRAEM38), and pretrained feature extraction (PatchCore18). Baseline selection focused on methods that can be trained or applied under comparable computational budgets and data assumptions (access only to unlabeled normal training samples), thereby ensuring that performance differences reflect methodological contributions rather than disparities in pretraining data scale. To ensure fair comparison, all methods were evaluated using the same 5-fold data splits, preprocessing pipeline, evaluation metrics, and computational environment. Models were trained under the same UAD protocol using only normal training samples, with hyperparameters and thresholds selected on the validation set and final performance assessed only on the held-out test set. Table 1 summarizes 5-fold cross-validation results, and Figure 5 provides multi-metric radar chart comparisons.
As shown in Table 1 and Figure 5, RareCode achieves favorable detection performance and statistical stability on the CRC dataset. In terms of AUC, RareCode (96.82 ± 0.23%) outperforms multiple reconstruction-based baseline models, including MemAE (94.97 ± 0.81%). Statistical analysis confirms that RareCode outperforms all reconstruction-based baselines (paired t-tests, p < 0.05), with the improvement over MemAE reaching statistical significance (p < 0.01). RareCode exhibits low performance variance (standard deviation of 0.23%), indicating consistent cross-fold stability. The limited effectiveness of DRAEM, based on synthetic anomalies, likely reflects the fact that simple texture overlay strategies cannot adequately simulate complex pathological atypia.
Regarding specificity, RareCode achieves 58.24 ± 5.99%, outperforming all comparison methods in reducing false positive rates. This represents approximately a 25-percentage-point improvement over the reconstruction-only baseline (NoCAR, 33.76%), demonstrating the CAR mechanism's contribution to reducing false positives. The lower specificity of STFPM and PatchCore, which rely natural-image-pretrained features, may partially reflect the domain gap between natural and histopathological images. Notably, STFPM and DRAEM exhibit high specificity variance (±33.53% and ±7.09%), with per-fold specificity ranging from near-zero to moderate levels, raising concerns about their deployment reliability.
Per-class detection performance
Per-class analysis was conducted by separately comparing cancer and inflammation samples against normal samples (Table 2). RareCode achieved higher performance for cancer detection (AUC = 99.44 ± 0.12%, recall = 98.13 ± 0.29%, specificity = 94.21 ± 2.22%) than for inflammation detection (AUC = 94.30 ± 0.44%, recall = 96.55 ± 0.78%, specificity = 60.44 ± 4.34%). These findings suggest that RareCode may show stronger discrimination for malignant abnormalities than for inflammatory changes, whereas the inflammation-normal boundary appears to contribute substantially to the reduced overall specificity.
Ablation study
To investigate the contributions of key components within the RareCode framework, ablation experiments were conducted to assess the impact of the CAR mechanism and the MHC module on detection performance. Results are detailed in Table 3. As shown in Figure 6A, adding CAR to the reconstruction-only baseline improved AUC from 92.81% to 95.92%, and multi-scale codebook fusion further increased AUC to 96.82%. Figure 6B shows that CAR also improved specificity, increasing it from 33.76% in the NoCAR baseline to 58.24% in the full FourScales model. These results support the complementary value of codebook activation rarity and multi-scale fusion.
Additionally, a decoder-complexity ablation was conducted using the FourScales configuration. As shown in Table 3, the complex-decoder variant with multi-scale depthwise convolution blocks and Convolutional Block Attention Modules (CBAM) showed lower AUC than the basic FourScales model (95.17 ± 0.44% vs. 96.82 ± 0.23%). This result suggests that, within the present VQ-AE-based RareCode setting, increasing decoder capacity did not improve anomaly detection performance and may reduce the effectiveness of the codebook-constrained representation.
Hierarchical spatial response analysis
To examine the spatial responses generated by RareCode, patch-level reconstruction error and codebook rarity maps were aggregated at the image level and compared between normal and anomalous samples. Energy ratio, Cohen's d, and AUC were used to quantify image-level response separation. Detailed results are presented in Table 4 and Figure 7 and Figure 8.
Results show that codebook rarity scores at all scales exhibit response elevation on anomalous samples (energy ratios > 1). Smaller-capacity codebooks (Codebook 64) achieve stronger localization-level discrimination (78.79% AUC), consistent with the expectation that higher compression rates encourage learning of more abstract prototypical patterns that are more sensitive to deviations from normal tissue archetypes. Reconstruction error alone provides substantial anomaly capture capability (93.31% AUC), while CAR scores offer complementary signals from the semantic frequency dimension.
Qualitative examination of Figure 7 showed that elevated responses in cancer samples overlapped with irregular and crowded glands, nuclear enlargement, hyperchromasia, pseudostratification, and loss of epithelial polarity. In inflammatory samples, stronger responses were observed around distorted crypts and dense inflammatory-cell infiltrates. Lower-capacity codebooks tended to capture broader architectural deviations, whereas higher-capacity codebooks produced more localized cellular-level responses. These findings provide qualitative morphological interpretation but not pixel-level validation.
Fusion parameter analysis
The fusion weight α balances the contributions of spatial reconstruction error and the CAR score to the final anomaly score. Optimal α values for each fold were determined via a grid search (step size 0.05) on the validation sets, with the results presented in Table 5 and Figure 9. Optimal α values primarily concentrate in the 0.85-0.95 range, with a mean of 0.90 ± 0.05. Under optimal configurations, the model achieves an average AUC of 96.82 ± 0.23% on test sets. Higher optimal weights (approximately 0.90) suggest that CAR scores contribute more to final detection than reconstruction error, while reconstruction error provides auxiliary local constraints. Compared with the α = 0 setting in the sensitivity analysis (AUC = 93.29%), the validation-selected fusion setting improved AUC by approximately 3.53 percentage points.
To summarize the present work presents the RareCode framework for unsupervised anomaly detection in histopathological images, aiming to mitigate the identity-mapping problem encountered by traditional generative models. The CAR mechanism reduces over-reliance on pixel-level reconstruction errors, while the MHC module provides hierarchical feature representations at multiple granularities, enabling complementary anomaly discrimination at different levels of abstraction. Experiments on the CRC dataset demonstrate that RareCode achieves 96.82% AUC, with per-class analysis showing effective cancer detection (AUC = 99.44%) and stronger discrimination for cancer than inflammation, suggesting that inflammation-normal overlap remains a major challenge. Ablation studies confirm that integrating discrete semantic features from VQ with multi-scale tissue morphological representations improves detection performance. RareCode's high recall (98.40%) and moderate specificity (58.24%) suggest its potential as a pre-screening tool for prioritizing suspicious histopathological images; however, its actual effect on pathologist workload will require prospective workflow evaluation.
Data Availability:
The CRC histopathological image dataset used in this study was obtained from Shenzhen People's Hospital under institutional ethics approval (Approval No. LL-KY-2025300-01). Due to patient privacy and institutional data sharing policies, the dataset is not publicly available. Access may be granted upon reasonable request to the corresponding author, subject to institutional approval and data use agreements. The source code for the RareCode framework is publicly available at https://github.com/XL-alg/RareCode.
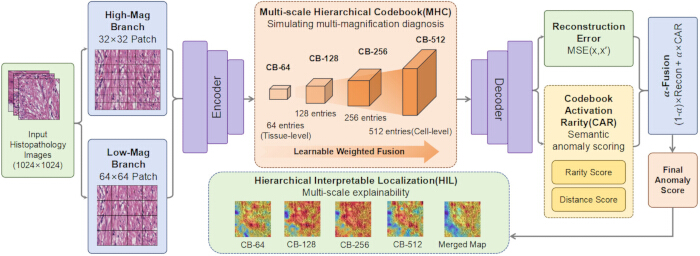
Figure 1: Overall architecture and data flow of the RareCode framework. A 512 × 512 H&E-stained histopathological image is divided into non-overlapping 32 × 32 and 64 × 64 patches as fine- and coarse-scale inputs. The two branches encode patches into latent embeddings, apply Multi-scale Hierarchical Codebook (MHC) discretization, and reconstruct patches to compute reconstruction-error scores. In parallel, the Codebook Activation Rarity (CAR) mechanism estimates semantic rarity from codebook activation-frequency profiles learned from normal training samples. Normalized reconstruction and CAR scores are then fused to generate the final image-level anomaly score, while patch-level responses are projected back to the image plane for hierarchical localization. Please click here to view a larger version of this figure.
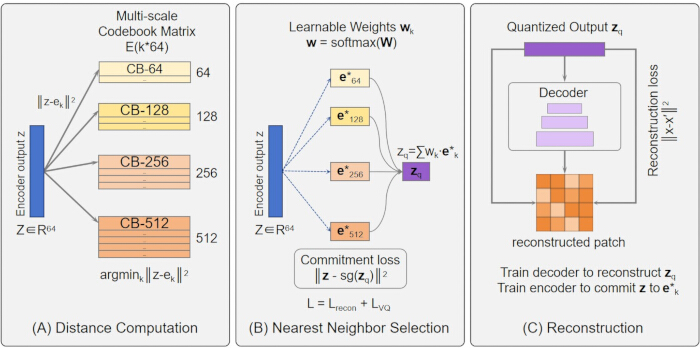
Figure 2: Multi-scale vector quantization mechanism. (A) Distance computation between encoder output features and codebook embedding vectors. (B) Nearest neighbor selection and weighted fusion across codebooks with capacities of 64, 128, 256, and 512. (C) Reconstruction from quantized features via transposed convolutional decoder. Please click here to view a larger version of this figure.
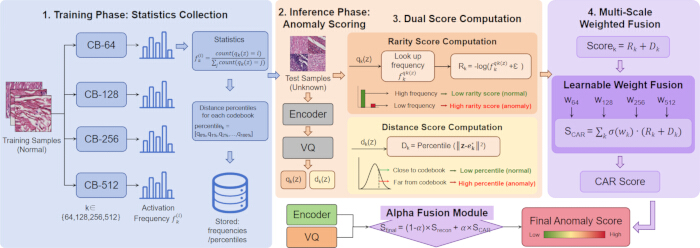
Figure 3: CAR scoring mechanism. This figure illustrates four stages: Stage 1: activation frequency statistics are computed solely on normal training samples. Stage 2: test samples obtain activation indices and distances through encoder and vector quantization. Stage 3: rarity scores and distance scores are computed based on training-set frequency profiles. Stage 4: scores from each codebook scale are fused through learnable weights to produce the final CAR score. Please click here to view a larger version of this figure.
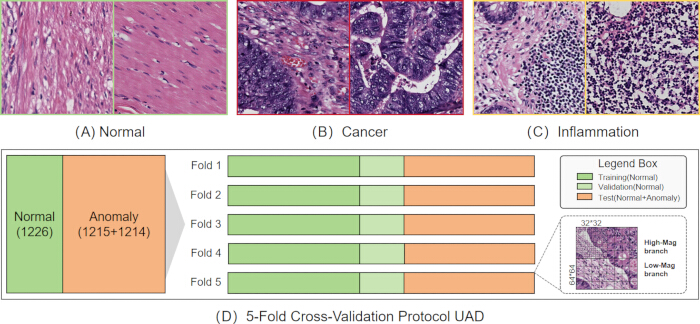
Figure 4: CRC dataset composition and experimental protocol. (A–C) Representative H&E-stained histopathological images of normal colorectal tissue, colorectal cancer, and colorectal inflammation. (D) 5-fold cross-validation protocol for UAD, in which normal samples were used for training and validation, while held-out normal and anomalous samples were used for testing. Images were digitized at 40x magnification and processed into 32 x 32 and 64 x 64 patches. Green, light green, and orange indicate training, validation, and test sets, respectively. Please click here to view a larger version of this figure.
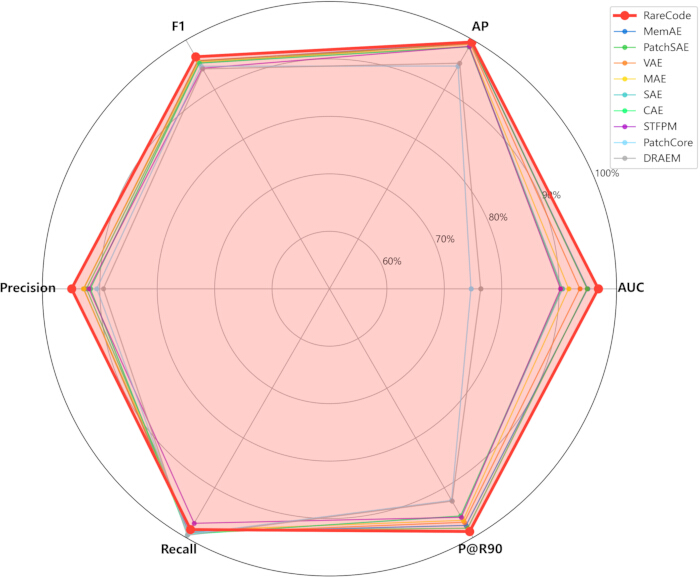
Figure 5: Multi-metric comparison radar chart of anomaly detection methods. Radar chart comparing RareCode against baseline methods across AUC, average precision (AP), F1-score, precision, recall, and precision at 90% recall (P@R90). All values represent mean performance across 5-fold cross-validation. Please click here to view a larger version of this figure.
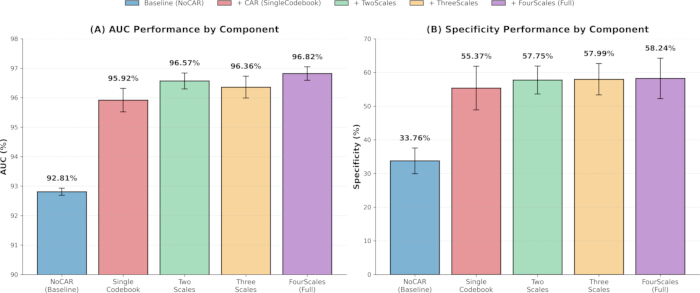
Figure 6: Incremental contribution analysis of ablation study components. (A) AUC performance comparison showing the progressive improvement from reconstruction-only baseline (NoCAR) through single-codebook to multi-scale configurations. (B) Specificity performance comparison demonstrating the CAR mechanism's effect on false positive reduction. All error bars represent standard deviation (SD) across 5-fold cross-validation. Please click here to view a larger version of this figure.
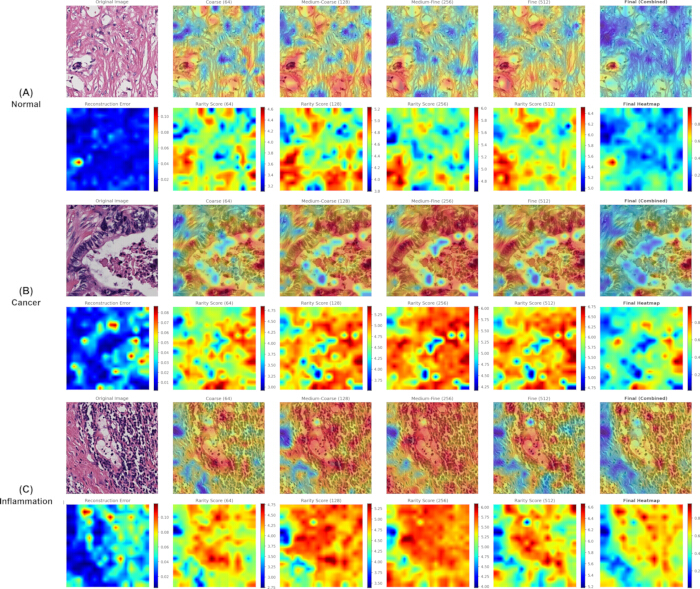
Figure 7: Multi-scale codebook hierarchical localization heatmaps. Representative examples are shown for (A) normal, (B) cancer, and (C) inflammation samples. Each row includes the original image, overlay, reconstruction-error map, rarity-score maps from codebooks of different capacities (64, 128, 256, and 512), and the final fused localization map. Smaller-capacity codebooks highlight coarse-grained patterns through stronger compression abstraction, whereas larger-capacity codebooks preserve finer structural details. High-response regions qualitatively correspond to cancer- or inflammation-related histopathological features, but were not validated with pixel-level expert annotations. Please click here to view a larger version of this figure.
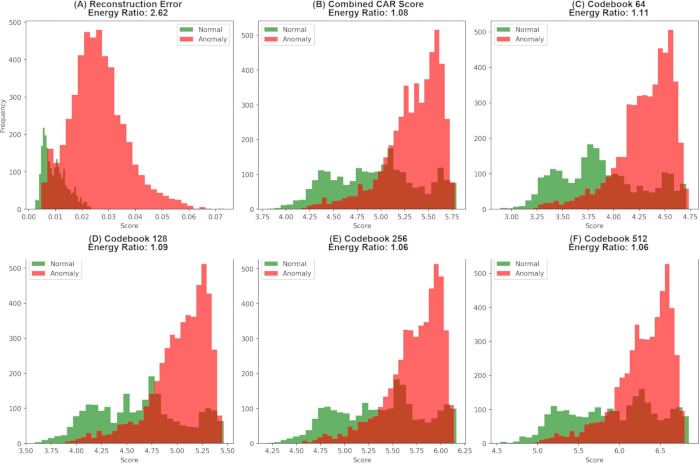
Figure 8: Distribution histograms of different score types. Histograms compare score distributions between normal and anomalous samples for (A) reconstruction error, (B) combined CAR score, (C) Codebook 64, (D) Codebook 128, (E) Codebook 256, and (F) Codebook 512. Green and red histograms indicate normal and anomalous samples, respectively. Please click here to view a larger version of this figure.
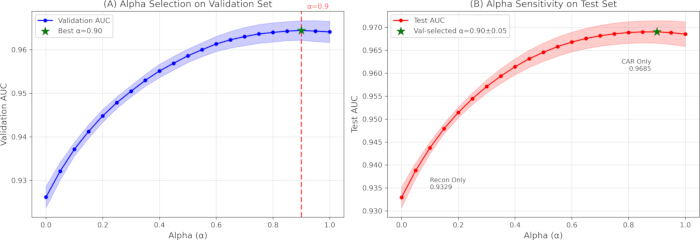
Figure 9: Alpha parameter sensitivity analysis. (A) Validation-set AUC used for α selection. (B) Test-set AUC under different α values. The validation-selected α values ranged from 0.85 to 0.95, with a mean of 0.90 ± 0.05, consistent with Table 5. AUC variation remained below 0.5% when α varied within the [0.70, 1.00] range, indicating stable performance across a wide parameter range. Please click here to view a larger version of this figure.
| Method | AUC (%) | AP (%) | F1 (%) | Precision (%) | Recall (%) | Specificity (%) | P@R90 (%) |
| CAE | 90.37 ± 0.94 | 98.62 ± 0.18 | 95.34 ± 0.15 | 91.64 ± 0.40 | 99.35 ± 0.22 | 28.14 ± 3.88 | 95.66 ± 0.32 |
| SAE | 90.58 ± 0.94 | 98.66 ± 0.18 | 95.34 ± 0.15 | 91.67 ± 0.40 | 99.32 ± 0.24 | 28.46 ± 3.97 | 95.71 ± 0.30 |
| VAE | 93.60 ± 0.82 | 99.13 ± 0.12 | 95.86 ± 0.19 | 92.81 ± 0.49 | 99.12 ± 0.29 | 39.07 ± 4.70 | 96.94 ± 0.43 |
| MAE | 91.65 ± 2.75 | 98.76 ± 0.50 | 95.61 ± 0.60 | 92.87 ± 1.56 | 98.55 ± 0.55 | 39.74 ± 14.32 | 96.55 ± 0.97 |
| MemAE | 94.97 ± 0.81 | 99.35 ± 0.11 | 95.78 ± 0.33 | 92.82 ± 1.07 | 98.95 ± 0.60 | 39.15 ± 9.99 | 97.57 ± 0.33 |
| PatchSAE | 94.86 ± 0.36 | 99.34 ± 0.05 | 95.39 ± 0.13 | 92.32 ± 0.27 | 98.67 ± 0.12 | 34.91 ± 2.57 | 98.13 ± 0.24 |
| STFPM | 90.23 ± 3.05 | 98.70 ± 0.44 | 94.32 ± 0.21 | 91.90 ± 3.51 | 97.14 ± 3.38 | 29.82 ± 33.53 | 95.93 ± 1.96 |
| DRAEM | 76.34 ± 2.82 | 95.34 ± 0.90 | 94.19 ± 0.07 | 89.39 ± 0.65 | 99.56 ± 0.65 | 6.19 ± 7.09 | 92.69 ± 0.57 |
| PatchCore | 74.64 ± 1.82 | 94.76 ± 0.55 | 94.73 ± 0.05 | 90.52 ± 0.15 | 99.36 ± 0.12 | 17.49 ± 1.54 | 92.54 ± 0.15 |
| RareCode | 96.82 ± 0.23 | 99.59 ± 0.03 | 96.63 ± 0.15 | 94.93 ± 0.67 | 98.40 ± 0.48 | 58.24 ± 5.99 | 98.80 ± 0.10 |
Table 1: Comparison results with baseline methods (5-fold cross-validation). Detection performance of RareCode and nine baseline UAD methods on the CRC dataset. Metrics include AUC, average precision (AP), recall, specificity, F1-score, precision at 90% recall (P@R90), and precision. All values represent mean ± SD across 5-fold cross-validation. Bold values indicate the best performance for each metric.
| Category | AUC (%) | AP (%) | F1 (%) | Recall (%) | Specificity (%) |
| Cancer | 99.44 ± 0.12 | 99.86 ± 0.03 | 98.34 ± 0.17 | 98.13 ± 0.29 | 94.21 ± 2.22 |
| Inflammation | 94.30 ± 0.44 | 98.48 ± 0.12 | 93.44 ± 0.29 | 96.55 ± 0.78 | 60.44 ± 4.34 |
Table 2: Per-class detection performance across anomaly subtypes. Separate evaluation of RareCode's detection performance for cancer and inflammation samples against normal samples. Per-class metrics, including AUC, AP, F1-score, recall, and specificity, were computed using class-specific optimal thresholds.
| Variant | Codebook Config | CAR | AUC (%) | AP (%) | F1 (%) | Specificity (%) | P@R90 (%) |
| NoCAR |  | | 92.81 ± 0.12 | 99.05 ± 0.02 | 95.30 ± 0.08 | 33.76 ± 3.82 | 96.72 ± 0.12 |
| SingleCodebook | [256] |  | 95.92 ± 0.40 | 99.47 ± 0.05 | 96.25 ± 0.14 | 55.37 ± 6.51 | 98.31 ± 0.43 |
| TwoScales | [128, 512] | | 96.57 ± 0.27 | 99.56 ± 0.04 | 96.45 ± 0.12 | 57.75 ± 4.14 | 98.75 ± 0.12 |
| ThreeScales | [128, 256, 512] | | 96.36 ± 0.37 | 99.53 ± 0.05 | 96.52 ± 0.17 | 57.99 ± 4.65 | 98.60 ± 0.23 |
| FourScales | [64, 128, 256, 512] | | 96.82 ± 0.23 | 99.59 ± 0.03 | 96.63 ± 0.15 | 58.24 ± 5.99 | 98.80 ± 0.10 |
| FourScales + complex decoder | [64, 128, 256, 512] | | 95.17 ± 0.44 | 99.39 ± 0.06 | 95.32 ± 0.20 | 53.83 ± 21.45 | 98.40 ± 0.37 |
Table 3: Ablation study results. Performance comparison of RareCode configurations with progressive addition of components: reconstruction-only baseline (NoCAR), single-codebook CAR (SingleCodebook), and multi-scale configurations (TwoScales, ThreeScales, FourScales). An additional decoder-complexity ablation using the FourScales configuration is also included. Metrics include AUC, average precision (AP), F1-score, specificity, and precision at 90% recall (P@R90).
| Score Type | Energy Ratio | Cohen's d | AUC (%) |
| Reconstruction Error | 2.623 | 2.006 | 93.31 |
| Combined CAR | 1.078 | 1.002 | 74.85 |
| Codebook 64 | 1.109 | 1.207 | 78.79 |
| Codebook 128 | 1.085 | 1.067 | 76.19 |
| Codebook 256 | 1.065 | 0.916 | 72.80 |
| Codebook 512 | 1.064 | 0.833 | 70.38 |
Table 4: Image-level analysis of localization-derived responses. Image-averaged reconstruction error and codebook rarity responses were compared between normal and anomalous samples using the energy ratio, Cohen's d, and AUC.
| Fold | Optimal α | Val AUC (%) | Test AUC (%) |
| 1 | 0.95 | 96.22 | 96.91 |
| 2 | 0.9 | 96.38 | 96.39 |
| 3 | 0.85 | 96.71 | 96.82 |
| 4 | 0.85 | 96.22 | 96.93 |
| 5 | 0.95 | 96.72 | 97.05 |
| Mean | 0.90 ± 0.05 | 96.45 ± 0.23 | 96.82 ± 0.23 |
Table 5: Optimal alpha values across folds. Optimal fusion weight alpha determined via grid search (step size 0.05) on validation sets for each cross-validation fold, with mean and SD statistics.
Diskussion
Die Ergebnisse deuten darauf hin, dass Aktivierungsmuster von Codebüchern ergänzende Informationen zu räumlichen Rekonstruktionsfehlern liefern können. Die Verbesserung von NoCAR hin zum vollständigen FourScales-Modell unterstreicht das mögliche Beitragspotenzial der CAR-Bewertung, während die ausgewählten Fusionsgewichte darauf hindeuten, dass semantische Seltenheit eine wichtige Rolle bei der endgültigen Anomaliebewertung spielen könnte. Eine mögliche Erklärung ist, dass CRC-bezogene Abnormalitäten verschiedene morphologische Maßstäbe umfassen können, von nuklearer Atypie bis hin zur Störung der drüsenförmigen Architektur, und daher von Merkmalsdarstellungen auf mehreren Granularitätsstufen profitieren könnten14. Das aktuelle Modell erfasst unterschiedliche räumliche Ausdehnungen mithilfe von 32 × 32 und 64 × 64 großen Ausschnitten auf derselben Vergrößerungsstufe; eine zukünftige Integration in Rahmenwerke zur Verarbeitung von Ganzpräparatbildern (WSI) könnte die hierarchische Analyse auf Slide-Ebene weiter unterstützen39.
Klinisch betrachtet, sollte RareCode am besten als Vorscreening-Triage-Tool und nicht als autonomes Diagnosesystem angesehen werden. Die hohe Sensitivität (98,40 %) deutet auf ein vergleichsweise geringes Risiko hin, auffällige Fälle zu übersehen40, während die moderate Spezifität (58,24 %) wahrscheinlich die Schwierigkeit widerspiegelt, entzündliche Veränderungen von normalem Gewebe in einem unbeaufsichtigten Szenario zu unterscheiden. Die höhere krebs-spezifische Spezifität (94,21 %) legt zudem nahe, dass Fehlalarme für den klinisch bedeutsamsten Subtyp seltener auftreten. Diese Leistungsmerkmale untermauern das Potenzial von RareCode als Vorscreening-Instrument zur Priorisierung von Fällen, die eine fachkundige Beurteilung erfordern, und zur Effizienzsteigerung der pathologischen Überprüfung5,6.
Die Ergebnisse pro Klasse können die potenzielle Rolle von RareCode bei der Triage weiter unterstützen. Die vergleichsweise stärkere Leistung bei Krebs im Vergleich zu Entzündungen könnte die deutlicher ausgeprägten architektonischen und zytologischen Abweichungen widerspiegeln, die bei malignem Gewebe häufig beobachtet werden, einschließlich des Verlusts der Polarität, nukleärer Pleomorphie und stromaler Desmoplasie14,39. Im Gegensatz dazu können entzündliche Veränderungen stärker mit benignen Gewebevariationen überlappen, was die geringere entzündungsspezifische Spezifität teilweise erklären könnte. Daher sollte die Gesamtspezifität mit Vorsicht interpretiert werden, wobei die Krebsdetektion als klinisch wichtiger Anwendungsfall dient, nicht jedoch als definitive autonome Diagnose.
Die potenziellen Fehlermodi von RareCode sollten im Kontext seines Ein-Klasse-Lernziels interpretiert werden. Da das Modell Muster normalen Gewebes und nicht krankheitsspezifische Kategorien erlernt, können auch nicht-neoplastische Veränderungen wie regeneratives Epithel, Fibrose, Nekrose oder ausgeprägte Entzündungen hohe Anomalie-Scores erhalten. Umgekehrt können subtile Dysplasien oder gut differenzierte Karzinome mit nahezu normaler drüsenförmiger Architektur schwächere Reaktionen hervorrufen. Technische Faktoren wie Färbungsvariationen, Gewebefalten, Schnittartefakte, Unschärfe und Bildkompression können ebenfalls die Rekonstruktionsfehler und die Aktivierungshäufigkeiten des Codebuchs beeinflussen. Diese Überlegungen legen nahe, dass eine klinische Übertragung eine Bildqualitätskontrolle, Harmonisierung der Färbung, kalibrierte, scannerspezifische Anpassung und eine multizentrische Validierung erfordern würde39,41.
Umfang der Basisvergleiche. Die experimentelle Bewertung dieser Studie konzentriert sich auf Methoden, die unter vergleichbaren Daten- und Rechenannahmen arbeiten – insbesondere auf Methoden, die vollständig end-to-end nur anhand kleiner Mengen ungekennzeichneter Normalproben trainiert werden können, ohne auf externe Vortrainingskorpora angewiesen zu sein. Dieser Umfang umfasst die wichtigsten Paradigmen der unüberwachten Anomalieerkennung: rekonstruktionsbasierte Ansätze (CAE, VAE, SAE, MAE, PatchSAE), speichererweiterte Verfahren (MemAE), Wissensdistillation (STFPM), synthetische Erweiterung (DRAEM) und Abgleich vortrainierter Merkmale (PatchCore). Wir weisen darauf hin, dass zwei Kategorien von Methoden nicht als direkte Basisvergleiche einbezogen wurden. Erstens nutzen pathologische Grundmodelle (UNI, CONCH, CTransPath) ein Vortraining auf Millionen kuratierter pathologischer Bilder, und ihre Leistungsvorteile resultieren hauptsächlich aus Umfang und Vielfalt der Vortrainingsdaten, nicht aus dem Anomalieerkennungsmechanismus; ein direkter Vergleich würde daher den Einfluss der Vortrainingsdaten mit dem der Erkennungsmethodik vermischen. Die suboptimale Leistung von STFPM und PatchCore – beide nutzen auf ImageNet vortrainierte Backbones – veranschaulicht empirisch die Auswirkung der Domänendiskrepanz, wenn allgemeine vortrainierte Merkmale auf histopathologische Szenarien angewendet werden, und legt nahe, dass eine auf die Pathologie spezialisierte Vortraining diese Diskrepanz verringern könnte. Zweitens erfordern an Diffusionsmodellen orientierte Anomalieerkennungsverfahren, trotz ihres vielversprechenden Potenzials, während der Inferenz deutlich höheren Rechenaufwand (typischerweise Hunderte iterativer Rauschreduktionsschritte), was ihre Anwendbarkeit in klinischen Hochdurchsatz-Screening-Workflows einschränkt, in denen Verarbeitungseffizienz eine praktische Anforderung darstellt. Zukünftige Arbeiten werden untersuchen, ob die Integration pathologiespezifischer vortrainierter Encoder in die RareCode-Architektur – als Ersatz für den derzeit end-to-end trainierten Encoder – die Erkennungsleistung weiter verbessern kann, ohne die interpretierbaren Vorteile des CAR-Mechanismus aufzugeben.
Mehrere Einschränkungen sollten berücksichtigt werden. Erstens war die Validierung auf einen Einzelzentren-Datensatz von CRC beschränkt, und weitere multizentrische Bewertungen über verschiedene Institutionen, Scanner und Färbeprotokolle hinweg sind erforderlich. Zweitens war, obwohl die krebs-spezifische Spezifität ermutigend war, die Gesamtspezifität weiterhin von der Grenze zwischen Entzündung und Normalgewebe beeinträchtigt. Drittens standen pixelgenaue Expertenannotationen nicht zur Verfügung; daher konnten Dice- und IoU-Werte nicht berechnet werden, und die Lokalisierungsbewertung beschränkte sich auf qualitative Visualisierung sowie eine analysenbasierte Auswertung der aggregierten räumlichen Antworten auf Bildebene. Viertens sind formelle Leserstudien noch erforderlich, um zu bestimmen, ob hierarchische Heatmaps die diagnostische Genauigkeit oder die Effizienz der Befundung verbessern können. Schließlich führt RareCode derzeit Analysen auf Patch- und Bildebene durch, und ein Einsatz auf Ebene von Ganzpräparatbildern (WSI) würde eine Integration in zusätzliche Verarbeitungsframeworks erfordern39,41,42.
Zukünftige Arbeiten sollten RareCode an öffentlichen Benchmark-Datensätzen und multizentrischen Kohorten evaluieren, nachdem es in WSI-Verarbeitungs-Frameworks integriert wurde. Prospektive Leserstudien könnten dazu beitragen, den potenziellen Einfluss auf die diagnostische Genauigkeit, die Überprüfungszeit und die Übereinstimmung zwischen Beobachtern zu bewerten42. Weitere Forschungsrichtungen umfassen die Verbesserung der Recheneffizienz, die Erweiterung des Modells hin zur multiklassigen Anomalie-Subtypisierung sowie die Integration von Multiple-Instance-Learning für die Diagnose auf Slide-Ebene28,39.
Offenlegungen
Die Autoren erklären, dass sie keine bekannten konkurrierenden finanziellen Interessen oder persönlichen Beziehungen haben, die den in dieser Arbeit berichteten Arbeiten gegenübergestanden haben könnten. Während der Erstellung dieser Arbeit verwendeten wir ChatGPT, um die Sprache und Lesbarkeit des Manuskripts zu verbessern und bei der Erstellung von Code für Datenvisualisierungen zu unterstützen. Nach der Nutzung dieses Tools überprüften und bearbeiteten wir den Inhalt nach Bedarf und übernehmen die volle Verantwortung für den veröffentlichten Artikel.
Danksagungen
Diese Forschung wurde unterstützt durch die Arbeitsstelle des Wissenschaftlers Yong Dai (Diagnostische Technologie für Autoimmunerkrankungen) (Wan Ke Wissenschaft und Technologie [2023] Nr. 317), das Projekt des Graduierten-Innovationsfonds des Gemeinsamen Forschungszentrums für Gesundheitswissenschaft und Technologie Hefei und des Offenen Fonds für Arbeitsmedizin und Gesundheit (Nr. OMH-2023-04) sowie das Projekt zur klinischen und translationale Forschung der Provinz Anhui (Nr. 202427610020132).
Materialien
| Name | Unternehmen | Katalognummer | Kommentare |
|---|---|---|---|
| GeForce RTX 4060 Ti GPU | NVIDIA | N/V | 16 GB VRAM; zur Durchführung aller Experimente wurde eine einzelne GPU verwendet (RRID:SCR_022858) |
| Matplotlib | Matplotlib-Entwicklungsteam | Version 3.8.4 | Datendarstellung und Erstellung von Abbildungen (RRID:SCR_008624) |
| NumPy | NumPy-Entwickler | Version 1.26.4 | Numerische Berechnungen und Array-Operationen (RRID:SCR_008633) |
| pandas | pandas-Entwicklungsteam | Version 2.2.3 | Datenorganisation und Verarbeitung tabellarischer Ergebnisse (RRID:SCR_018214) |
| Pillow | Python Imaging Library / Pillow-Mitwirkende | Version 10.3.0 | Bildladen und Vorverarbeitung |
| Python | Python Software Foundation | Version 3.12.3 | Programmiersprache für Modellentwicklung und Datenanalyse (RRID:SCR_008394) |
| PyTorch | Meta Platforms, Inc. | Version 2.7.0+cu118 | Tiefenlern-Framework für Implementierung und Training des Modells (RRID:SCR_018536) |
| scikit-learn | scikit-learn-Entwickler | Version 1.4.2 | Kreuzvalidierung, Aufteilung in Trainings- und Testdatensätze sowie Evaluierungsmetriken (RRID:SCR_002577) |
| SciPy | SciPy-Entwickler | Version 1.13.1 | Statistische Analyse (RRID:SCR_008058) |
| torchvision | PyTorch-Projekt | Version 0.22.0+cu118 | Bildvorverarbeitung und Datentransformation |
| tqdm | tqdm-Entwickler | Version 4.66.4 | Überwachung des Fortschritts während Training und Evaluierung |
Referenzen
- Fan J, Sun Q, Di Y, et al. DIPathMamba: A domain-incremental weakly supervised state space model for pathology image segmentation. Med Image Anal. 2025;103:103563.
- Nan T, Zheng S, Qiao S, et al. Deep learning quantifies pathologists' visual patterns for whole slide image diagnosis. Nat Commun. 2025;16(1):5493.
- Lagogiannis I, Meissen F, Kaissis G, et al. Unsupervised pathology detection: a deep dive into the state of the art. IEEE Trans Med Imaging. 2024;43(1):241-252.
- Tian Y, Liu F, Pang G, et al. Self-supervised pseudo multiclass pre-training for unsupervised anomaly detection and segmentation in medical images. Med Image Anal. 2023;90:102930.
- Metter DM, Colgan TJ, Leung ST, et al. Trends in the US and Canadian pathologist workforces from 2007 to 2017. JAMA Netw Open. 2019;2(5):e194337.
- Shaukat A, Levin TR. Current and future colorectal cancer screening strategies. Nat Rev Gastroenterol Hepatol. 2022;19(8):521-531.
- Ancker JS, Edwards A, Nosal S, et al. Effects of workload, work complexity, and repeated alerts on alert fatigue in a clinical decision support system. BMC Med Inform Decis Mak. 2017;17(1):36.
- Litjens G, Kooi T, Ehteshami Bejnordi B, et al. A survey on deep learning in medical image analysis. Med Image Anal. 2017;42:60-88.
- Stepec D, Skocaj D. Unsupervised detection of cancerous regions in histology imagery using image-to-image translation. In: Proceedings of the IEEE/CVF Conference on Computer Vision and Pattern Recognition Workshops. 2021:3785-3792.
- Li Y, Lao Q, Kang Q, et al. Self-supervised anomaly detection, staging and segmentation for retinal images. Med Image Anal. 2023;87:102805.
- Hinton GE, Salakhutdinov RR. Reducing the dimensionality of data with neural networks. Science. 2006;313(5786):504-507.
- Kingma DP, Welling M. Auto-encoding variational Bayes. In: Proceedings of the 2nd International Conference on Learning Representations (ICLR). 2014.
- Goodfellow IJ, Pouget-Abadie J, Mirza M, et al. Generative adversarial nets. In: Advances in Neural Information Processing Systems. 2014;27:2672-2680.
- Lu S, Zhang W, Zhao H, et al. Anomaly detection for medical images using heterogeneous auto-encoder. IEEE Trans Image Process. 2024;33:2770-2782.
- Yang Z, Zhang T, Soltani Bozchalooi I, et al. Memory-augmented generative adversarial networks for anomaly detection. IEEE Trans Neural Netw Learn Syst. 2022;33(6):2324-2334.
- Huyan N, Quan D, Zhang X, et al. Unsupervised outlier detection using memory and contrastive learning. IEEE Trans Image Process. 2022;31:6440-6454.
- Jézéquel L, Beaudet J, Histace A, et al. Unified anomaly detection via multi-scale contrasted memory. IEEE Trans Image Process. 2026;35:2802-2815.
- Roth K, Pemula L, Zepeda J, et al. Towards total recall in industrial anomaly detection. In: Proceedings of the IEEE/CVF Conference on Computer Vision and Pattern Recognition. 2022:14298-14308.
- Defard T, Setkov A, Loesch A, et al. PaDiM: a patch distribution modeling framework for anomaly detection and localization. In: International Conference on Pattern Recognition. Cham: Springer; 2021:475-489.
- Zingman I, Stierstorfer B, Lempp C, et al. Learning image representations for anomaly detection: application to discovery of histological alterations in drug development. Med Image Anal. 2024;92:103067.
- Jiang Y, Cao Y, Shen W. Prototypical learning guided context-aware segmentation network for few-shot anomaly detection. IEEE Trans Neural Netw Learn Syst. 2025;36(7):12016-12026.
- Wang X, Zhao J, Marostica E, et al. A pathology foundation model for cancer diagnosis and prognosis prediction. Nature. 2024;634(8035):970-978.
- Frotscher A, Kapoor J, Wolfers T, et al. Unsupervised anomaly detection in medical imaging using aggregated normative diffusion. Med Image Anal. 2026;109:103895.
- Zeng GQ, Yang YW, Lu KD, et al. Evolutionary adversarial autoencoder for unsupervised anomaly detection of industrial Internet of Things. IEEE Trans Reliab. 2025;74(3):3454-3468.
- Lu KD, Zhang BX, Xu Y, et al. MoARNN-AM: multi-objective automated recurrent neural network with attention mechanism for cyber-attack detection of UAV. IEEE Trans Consum Electron. 2026;72(1):1738-1749.
- van den Oord A, Vinyals O, Kavukcuoglu K. Neural discrete representation learning. In: Advances in Neural Information Processing Systems. 2017;30:6306-6315.
- Ghafourian A, Shui H, Upadhyay D, et al. Targeted collapse regularized autoencoder for anomaly detection: black hole at the center. IEEE Trans Neural Netw Learn Syst. 2025;36(6):10348-10358.
- Gao Z, Mao A, Dong Y, et al. SMMILe enables accurate spatial quantification in digital pathology using multiple-instance learning. Nat Cancer. 2025;6(12):2025-2041.
- Wang X, Liu H, Zhang Y, et al. Joint modeling histology and molecular markers for cancer classification. Med Image Anal. 2025;102:103505.
- Jin H, Shen J, Cui L, et al. Dynamic graph based weakly supervised deep hashing for whole slide image classification and retrieval. Med Image Anal. 2025;101:103468.
- Schmitz R, Madesta F, Nielsen M, et al. Multi-scale fully convolutional neural networks for histopathology image segmentation: from nuclear aberrations to the global tissue architecture. Med Image Anal. 2021;70:101996.
- Masci J, Meier U, Ciresan D, et al. Stacked convolutional auto-encoders for hierarchical feature extraction. In: International Conference on Artificial Neural Networks. Berlin: Springer; 2011:52-59.
- Ng A. Sparse autoencoder. CS294A Lecture Notes. 2011;72:1-19.
- He K, Chen X, Xie S, et al. Masked autoencoders are scalable vision learners. In: Proceedings of the IEEE/CVF Conference on Computer Vision and Pattern Recognition. 2022:16000-16009.
- Lim H, Choi J, Choo J, et al. Sparse autoencoders reveal selective remapping of visual concepts during adaptation. In: Proceedings of the 13th International Conference on Learning Representations (ICLR). 2025.
- Gong D, Liu L, Le V, et al. Memorizing normality to detect anomaly: memory-augmented deep autoencoder for unsupervised anomaly detection. In: Proceedings of the IEEE/CVF International Conference on Computer Vision. 2019:1705-1714.
- Wang G, Han S, Ding E, et al. Student-teacher feature pyramid matching for anomaly detection. In: Proceedings of the 32nd British Machine Vision Conference (BMVC). 2021.
- Zavrtanik V, Kristan M, Skocaj D. DRAEM: a discriminatively trained reconstruction embedding for surface anomaly detection. In: Proceedings of the IEEE/CVF International Conference on Computer Vision. 2021:8330-8339.
- Niazi MKK, Parwani AV, Gurcan MN. Digital pathology and artificial intelligence. Lancet Oncol. 2019;20(5):e253-e261.
- Raab SS, Grzybicki DM, Janosky JE, et al. Clinical impact and frequency of anatomic pathology errors in cancer diagnoses. Cancer. 2005;104(10):2205-2213.
- Schömig-Markiefka B, Pryalukhin A, Hulla W, et al. Quality control stress test for deep learning-based diagnostic model in digital pathology. Mod Pathol. 2021;34(12):2098-2108.
- Steiner DF, MacDonald R, Liu Y, et al. Impact of deep learning assistance on the histopathologic review of lymph nodes for metastatic breast cancer. Am J Surg Pathol. 2018;42(12):1636-1646.