This protocol demonstrates how Danshen injection (DI), alone and in combination with 5-fluorouracil (5-FU), induces apoptosis in parental and 5-FU-resistant gastric cancer cell lines (SGC7901 and BGC823) and suppresses tumor growth in a xenograft mouse model.
Forschungsartikel
Danshen Injection for 5-Fluorouracil-Resistant Gastric Cancer: Mitochondrial Apoptosis and Enhanced Drug Activity
* These authors contributed equally
In diesem Artikel
Zusammenfassung
Zusammenfassung
Gastric cancer ranks among the leading causes of cancer-related death worldwide, and the progressive emergence of 5-fluorouracil (5-FU) resistance represents a critical barrier to the efficacy of conventional chemotherapy, particularly 5-FU-based regimens. Danshen injection (DI), a clinically approved intravenous preparation derived from Salvia miltiorrhiza, has demonstrated preliminary antineoplastic activity; however, the mechanistic basis underlying its reversal of 5-FU resistance in gastric cancer has not been systematically defined. This study aimed to evaluate the antitumor efficacy of DI and its potential for enhanced combined activity with 5-FU in human gastric cancer cell lines (SGC7901 and BGC823), their 5-FU-resistant variants, and a xenograft mouse model. DI significantly induced apoptosis in both parental and drug-resistant cell lines, while CCK-8 assays confirmed markedly elevated IC50 values in resistant variants, validating the chemoresistant phenotype. The combination of DI and 5-FU produced enhanced antitumor effects superior to either agent alone, as demonstrated by increased apoptotic rates, upregulated expression of cleaved PARP and cleaved caspase-3, impaired mitochondrial membrane potential by JC-10 assay, and reduced colony formation. Mechanistically, DI promoted cytochrome c translocation from mitochondria to the cytoplasm, and elevated cleaved caspase-9 levels, effects that were further amplified upon co-treatment with 5-FU. Consistent antitumor activity was validated in vivo, with the combination regimen demonstrating superior tumor suppression compared with monotherapy. Collectively, these findings demonstrate that DI exerts meaningful antitumor activity and produces a greater combined effect with 5-FU in 5-FU-resistant gastric cancer. This study provides a preclinical rationale for incorporating DI into chemotherapy-based strategies for the management of 5-FU-resistant gastric cancer.
Einleitung
Gastric cancer is one of the most prevalent and lethal malignancies globally, representing a major contributor to cancer-related morbidity and mortality across diverse geographic and ethnic populations1. Despite multimodal treatment advances, the clinical management of advanced gastric cancer remains profoundly challenging; systemic chemotherapy is hampered by dose-limiting toxicity, poor tumor selectivity, and the progressive acquisition of drug resistance, all of which contribute to persistently poor long-term survival outcomes2,3. Novel therapeutic strategies capable of circumventing these barriers are therefore urgently needed3. Traditional Chinese medicine (TCM) and its pharmacologically active constituents have garnered increasing interest as complementary oncological agents with multitargeted mechanisms of action, including documented applications in gastric cancer models4. However, rigorous mechanistic characterization, robust preclinical validation, and systematic quality standardization remain essential prerequisites for the broader clinical integration of TCM-derived preparations.
Danshen (Salvia miltiorrhiza) is a widely used medicinal herb in TCM, valued for its established cardiovascular and anti-inflammatory properties; emerging evidence further indicates that its principal bioactive constituents—tanshinones and salvianolic acids—exhibit antineoplastic activity in multiple tumor models5. Nevertheless, the inhibitory efficacy of Danshen injection (DI) specifically against gastric cancer, both in vitro in cell lines and in vivo in animal tumor models, has not yet undergone rigorous and comprehensive experimental validation6,7. This gap in mechanistic understanding constrains the translational potential and broader clinical acceptance of DI8,9. Of particular clinical relevance is 5-FU resistance, a multifactorial phenomenon that underlies both primary treatment failure and acquired 5-FU resistance in gastric cancer; the capacity of DI to counteract 5-FU resistance, and the underlying molecular mechanisms by which it might do so, remain to be definitively established10.
In this study, we systematically investigated the antitumor effects of Danshen injection on gastric cancer, with a particular focus on its activity in 5-FU-resistant gastric cancer and the underlying mechanisms. Our results reveal that Danshen injection exerts significant antitumor activity and promotes apoptosis in gastric cancer cells. This research offers promising prospects for advancing therapeutic strategies and enhancing the clinical efficacy of Danshen in overcoming 5-FU resistance.
Protokoll
All animal experiments were conducted in accordance with the institutional guidelines and approved by the Animal Care and Use Committee of the First Affiliated Hospital of Anhui University of Chinese Medicine (Ethics Registration No. 202505A003).
Cell lines and cell culture
The identity of the human gastric cancer cell lines SGC7901 and BGC823 was verified by short tandem repeat (STR) profiling before experimental use (Supplementary File 1). SGC7901 and BGC823 parental human gastric cancer cell lines were maintained in RPMI-1640 medium containing 10% fetal bovine serum, 100 U/mL penicillin, and 100 μg/mL streptomycin. Cultures were incubated at 37 °C in a humidified atmosphere with 5% CO₂ and subcultured every 2–3 days after reaching 80–90% confluence. All experiments were conducted using cells at passages 5–20; cells were not used beyond passage 20 to ensure phenotypic consistency. Cell morphology and growth conditions were routinely monitored under an inverted microscope. Mycoplasma contamination was periodically assessed monthly using the Mycoplasma Detection Kit; all cell stocks were confirmed mycoplasma-negative prior to experimental use.
SGC7901/5-FU cells were maintained in medium containing 30, 45, 60 μmol/L 5-FU, and BGC823/5-FU cells were maintained in 10, 20, 30 μmol/L 5-FU. This process was continued for approximately 6 months. Prior to all functional assays, resistant cells were cultured in drug-free medium for 10 days to eliminate the acute pharmacological effects of 5-FU and reflect the intrinsic resistant phenotype. The half-maximal inhibitory concentration IC50 values and resistance indices (RI = IC50 resistant / IC50 parental) determined by CCK-8 assay were SGC7901 parental IC50 =5.32 μmol/L, SGC7901/5-FU IC50 = 38.76 μmol/L, RI = 7.29; BGC823 parental IC50 = 14.99 μmol/L, BGC823/5-FU IC50 = 72.86 μmol/L, RI = 4.86. All cell seeding densities were as follows: 5 × 10³ cells/well for 96-well CCK-8 proliferation assays; 1 × 10⁵ cells/well for 6-well apoptosis assays; 500 cells/well for colony formation assays; 5 × 10⁴ cells/chamber slide for immunofluorescence experiments.
Cell proliferation, colony formation, and apoptosis assays
Cell viability was assessed using the Cell Counting Kit-8 (CCK-8). For the assay, cells were plated into 96-well plates at 5 × 10³ cells per well in 100 µL of complete culture medium and incubated overnight to allow attachment. Dose–response curves and IC₅₀ values were generated by exposing the cells to increasing concentrations of DI (0, 5, 10, 15, 20, 30, and 50 nM) or 5-FU (0.01, 0.1, 1, 10, 100, and 1000 nM) for 24, 48, or 72 h. After treatment, 10 µL of CCK-8 reagent was dispensed into each well, followed by incubation for 2 h at 37 °C in a humidified atmosphere containing 5% CO₂, protected from light. Absorbance was then recorded at 450 nm with a reference wavelength of 630 nm using a microplate reader. IC₅₀ values were calculated by fitting a four-parameter nonlinear dose–response model in the analysis software. Cell viability assays were performed in three independent biological replicates, each consisting of five technical replicates.
For all subsequent functional experiments, four treatment groups were established: Control (vehicle), DI (10 nM), 5-FU (30 nM), and DI (10 nM) plus 5-FU (30 nM). DI and 5-FU were added simultaneously for 48 h unless otherwise specified. The selected concentrations were based on preliminary dose–response experiments that yielded measurable biological responses without excessive cytotoxicity.
For the soft agar colony formation assay, 500 cells were suspended in complete medium containing 0.35% (w/v) low-melting-point agarose and seeded over a 0.7% agarose base layer in 6-well plates. Following treatment with vehicle, DI (10 nM), 5-FU (30 nM), or DI (10 nM) plus 5-FU (30 nM), cells were cultured for 10–14 days at 37 °C in 5% CO₂. Fresh complete medium containing the corresponding treatments was replenished every 3 days. Colonies were fixed with 4% paraformaldehyde for 10 min at room temperature, stained with 0.1% crystal violet in 20% methanol for 20 min, photographed, and quantified using ImageJ. Only colonies containing at least 50 cells were included in the analysis. Colony formation assays were performed in three independent biological replicates, each with three technical replicates.
Cell apoptosis was evaluated using an Annexin V-FITC/propidium iodide (PI) apoptosis detection kit according to the manufacturer's instructions. Cells were treated simultaneously with vehicle, DI (10 nM), 5-FU (30 nM), or DI (10 nM) plus 5-FU (30 nM) for 48 h. Following treatment, cells were collected by trypsinization, washed twice with ice-cold PBS, and resuspended in 100 µL of binding buffer. Annexin V-FITC (5 µL) and PI (5 µL) were added, and the cell suspension was incubated for 15 min at room temperature in the dark. Subsequently, 400 µL of binding buffer was added before flow cytometry analysis, and at least 10,000 events were acquired for each sample. Gating was established using forward-scatter/side-scatter plots, and quadrant boundaries were determined using unstained and single-stained controls. Data were analyzed using the linked software. Apoptosis assays were performed in three independent biological replicates.
Immunofluorescence staining and confocal imaging
Cells were seeded onto sterile glass coverslips (1 × 10⁴ cells/coverslip) in 6-well plates and cultured overnight. Four treatment groups were established: Control (vehicle), DI (10 nM), 5-FU (30 nM), and DI (10 nM) plus 5-FU (30 nM). Cells were treated simultaneously for 48 h before immunofluorescence staining. The selected concentrations were based on preliminary dose–response experiments that produced measurable biological responses while minimizing excessive cytotoxicity.
Following treatment, cells were fixed for 15 min at room temperature with 4% paraformaldehyde in PBS, permeabilized with 0.2% Triton X-100 in PBS for 10 min, and blocked for 1 h in 5% bovine serum albumin (BSA) prepared in PBS. Primary antibodies diluted 1:100 in 5% BSA/PBS were applied overnight at 4 °C. After washing three times with PBS (5 min per wash), cells were incubated for 1 h at room temperature in the dark with Alexa Fluor 647-conjugated goat anti-rabbit IgG (1:200) and FITC-conjugated goat anti-mouse IgG (1:200). Nuclei were counterstained with DAPI (1 µg/mL) for 10 min before coverslips were mounted in mounting medium, sealed, and prepared for imaging.
Confocal fluorescence images were captured using a confocal laser scanning microscope fitted with a 63×/1.40 NA oil-immersion objective. Imaging parameters, including laser power, detector gain, pinhole size, scanning speed, and emission windows, were maintained constant for all treatment groups within each experiment. For colocalization analyses, z-stack images were acquired at 0.3 µm intervals.
Fluorescence intensity was quantified using ImageJ. Background fluorescence was subtracted using a rolling-ball radius of 50 pixels, and thresholds were determined using Otsu's automatic method. Mean fluorescence intensity was measured within regions of interest defined by DAPI-positive cell boundaries. Immunofluorescence experiments were performed in three independent biological replicates. For each treatment group, at least 5 randomly selected microscopic fields were imaged under identical acquisition settings, and at least 100 cells were analyzed.
Establishment of the subcutaneous xenograft model
Male NOD/SCID nude mice aged 6–8 weeks were housed under specific-pathogen-free (SPF) conditions (temperature 22 ± 2 °C; humidity 50 ± 10%; 12 h light/dark cycle, food and water ad libitum). All animal experiments were conducted in accordance with the guidelines of the Animal Care and Use Committee of the First Affiliated Hospital of Anhui University of Chinese Medicine, and were approved under Ethics Registration No. 202505A003.
SGC7901 cells (1 × 10⁶ cells suspended in 100 µL of PBS) were subcutaneously injected into the right flanks of nude mice. Tumor growth was monitored every two days using digital calipers. Tumor volume was calculated using the following formula: V = (length × width2)/2. Mice were sacrificed when tumors reached approximately 15 mm in diameter or met pre-defined humane endpoint criteria. Tumors were excised, photographed, weighed, and collected for further molecular analyses.
Experimental groups comprised n = 6 male NOD/SCID nude mice each (three groups in total: Control group, DI monotherapy, and DI + 5-FU combination). Following tumor establishment, mice were allocated to groups by block randomization stratified by tumor volume. Tumor volume measurements and body weight assessments were performed by an investigator blinded to group allocation; data analysis was conducted by a separate blinded investigator. Treatment was initiated when the mean tumor volume reached approximately 100 mm3, typically 7 days post-inoculation. A power analysis performed (based on preliminary data: mean tumor volume 800 ± 150 mm3 [control] versus 400 mm3 [DI + 5-FU combination]; effect size f = 0.88; α = 0.05; 1 − β = 0.80) indicated a minimum of four mice per group; six mice per group were used to achieve 1 − β = 0.90 and account for potential attrition.
Intravenous administration of the Danshen injection in vivo
Following tumor establishment and randomization, mice were assigned to one of three experimental groups: (i) Control group: sterile PBS (pH 7.4, endotoxin-tested), 100 µL, administered intravenously via tail vein every other day; (ii) DI monotherapy: DI 5 mg/kg in 100 µL PBS, i.v., every other day; (iii) DI + 5-FU combination: 5-FU 20 mg/kg in 100 µL PBS, intraperitoneally (i.p.), every other day; Danshen injection (DI, 5 mg/kg) was administered intravenously through the tail vein every other day throughout the treatment period. Control animals received equal volumes of vehicle solution. Body weight, tumor size, and general health status were monitored regularly throughout the experiment. The total treatment duration was 21 consecutive days from initiation. At the end of the study, tumors and major organs were harvested for subsequent analyses.
Tissue collection and endpoint procedures
Predefined humane endpoints included: body weight loss ≥ 20% from baseline; tumor diameter ≥ 15 mm; persistent signs of distress (hunching, labored breathing, inability to access food or water). At the study endpoint or upon reaching a humane endpoint, mice were euthanized by CO2 inhalation (fill rate 30–70% chamber volume/min) followed by cervical dislocation, in accordance with IACUC guidelines. Immediately following euthanasia, tumors were excised, weighed, and photographed.
Statistical analyses
Data are presented as mean ± standard deviation (SD) unless otherwise specified. 'Biological replicate' is defined as an independent experiment performed on separately cultured cell stocks (or separate animals); 'technical replicate' refers to repeated measurements within the same experiment. All in vitro data represent a minimum of three independent biological replicates; each performed with at least three technical replicates. Comparisons between two groups were conducted using a two-tailed Student's t-test, whereas comparisons among multiple groups were analyzed using one-way analysis of variance (ANOVA) followed by Tukey's Honestly Significant Difference (HSD) post-hoc test for all pairwise comparisons, or Dunnett's test where multiple treatment groups were compared against a single control. Prior to ANOVA, normality was assessed using the Shapiro–Wilk test, and homogeneity of variance was assessed using Levene's test; where assumptions were violated, the Kruskal–Wallis test with Dunn's multiple comparisons correction was applied as a nonparametric alternative. Statistical significance was defined as a two-sided P value < 0.05.
Ergebnisse
Gastric cancer cell apoptosis
To confirm the successful establishment of the 5-FU-resistant gastric cancer cell sublines, we first compared the half-maximal inhibitory concentration (IC50) of 5-FU between parental (WT) cells and their resistant counterparts by CCK-8 assay. The IC50 of 5-FU increased from 5.32 nM in SGC7901 WT cells to 38.76 nM in SGC7901/5-FU cells, and from 14.99 nM in BGC823 WT cells to 72.86 nM in BGC823/5-FU cells (Figure 1D), confirming the resistant phenotype of the SGC7901/5-FU and BGC823/5-FU sublines. We then treated SGC7901 WT, SGC7901/5-FU, BGC823 WT, and BGC823/5-FU cells with DI and assessed apoptosis by flow cytometry. DI treatment significantly increased the apoptosis rate in SGC7901 WT and BGC823 WT cells compared with SGC7901/5-FU and BGC823/5-FU cells (Figure 1A-C), indicating that the resistant sublines were less responsive to DI-induced apoptosis than their parental counterparts. Collectively, these results validate the 5-FU-resistant phenotype of the SGC7901/5-FU and BGC823/5-FU cell lines and show that DI-induced apoptosis is attenuated in these resistant cells relative to WT cells.
Inhibition of gastric cancer after combined treatment with DI and 5-FU
To examine whether DI could enhance the efficacy of 5-FU in inhibiting gastric cancer, we first conducted WB analysis and disclosed that the levels of cleaved poly ADP ribose polymerase (cleaved PARP) and cleaved caspase 3 were increased in the DI and 5-FU combination group compared with the DI group (Figure 2A). The cell apoptosis assay demonstrated an increased apoptosis rate in the DI and 5-FU combination group compared with the DI group (Figure 2B,C). Additionally, the CCK-8 assay confirmed that cell proliferation was significantly decreased in the DI and 5-FU combination group compared with the DI group (Figure 2D). In addition, the JC-10 assay demonstrated loss of mitochondrial membrane potential in the DI and 5-FU combination group, leading to the release of cytochrome c (Figure 2E). In assessing the long-term proliferative capacity of the cells, the soft agar colony formation assay indicated that the DI and 5-FU combination group formed fewer colonies compared to the other groups (Figure 2F,G). Taken together, these findings indicate that DI enhances the efficacy of 5-FU in inhibiting gastric cancer.
Intrinsic apoptotic pathway activation
We observed a significant elevation in caspase-9 levels in the DI-treated group (Figure 3A and Supplementary File 2). In addition, the JC-10 assay demonstrated that DI treatment induced loss of mitochondrial membrane potential, resulting in the release of cytochrome c and subsequent apoptosis (Figure 3B,C). Additionally, WB showed elevated levels of cytochrome c and cleaved caspase-9 in DI-treated cells, with the most significant increases observed in the DI plus 5-FU combination group (Figure 3D–F and Supplementary File 2). Importantly, subcellular fractionation analysis revealed a marked increase in cytoplasmic cytochrome c levels accompanied by a corresponding decrease in mitochondrial cytochrome c levels following combined DI and 5-FU treatment (Figure 3G–I and Supplementary File 2). These findings provide compelling evidence that DI promotes the loss of mitochondrial membrane potential and the release of cytochrome c.
Inhibition of tumorigenesis in the nod/scid model due to the combination of DI and 5-FU
To further explore the functions of DI in vivo, a CDX model was subsequently used. DI and DI&5-FU were administered i.v. and via tail injection, respectively, in the CDX model mice. The tumors in the combination treatment of DI and 5-FU group were much smaller than those in the DI group (Figure 4A,B). The average volume and weight of tumors in the combination treatment of DI and 5-FU group were significantly lower than those in the DI group (Figure 4C,D) (P<0.001 and P<0.01, respectively).
DATA AVAILABILITY:
Complete raw datasets have been uploaded as Supplementary File 1 and Supplementary File 2.
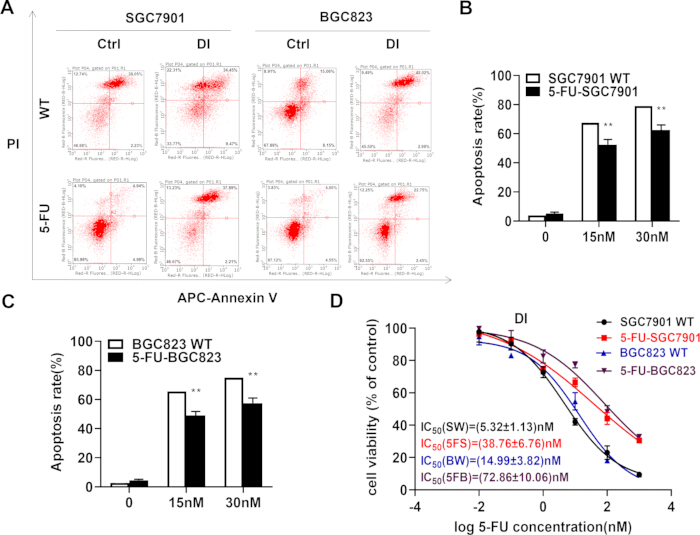
Figure 1: Establishment of 5-FU-resistant gastric cancer cell lines and effect of Danshen injection on apoptosis. (A–C) SGC7901 WT and BGC823 WT cells treated with DI showed significantly higher apoptosis rates than their 5-FU-resistant counterparts, SGC7901/5-FU and BGC823/5-FU, as assessed by flow cytometry. (D) CCK-8 assay confirmed the 5-FU-resistant phenotype: the IC50 of 5-FU was 5.32 nM in SGC7901 WT cells versus 38.76 nM in SGC7901/5-FU cells, and 14.99 nM in BGC823 WT cells versus 72.86 nM in BGC823/5-FU cells, confirming reduced 5-FU sensitivity in the resistant sublines. Abbreviations: DI = Danshen injection; 5-FU = 5-fluorouracil; WT = wild type; CCK-8 = Cell Counting Kit-8; IC₅₀ = half-maximal inhibitory concentration. Please click here to view a larger version of this figure.
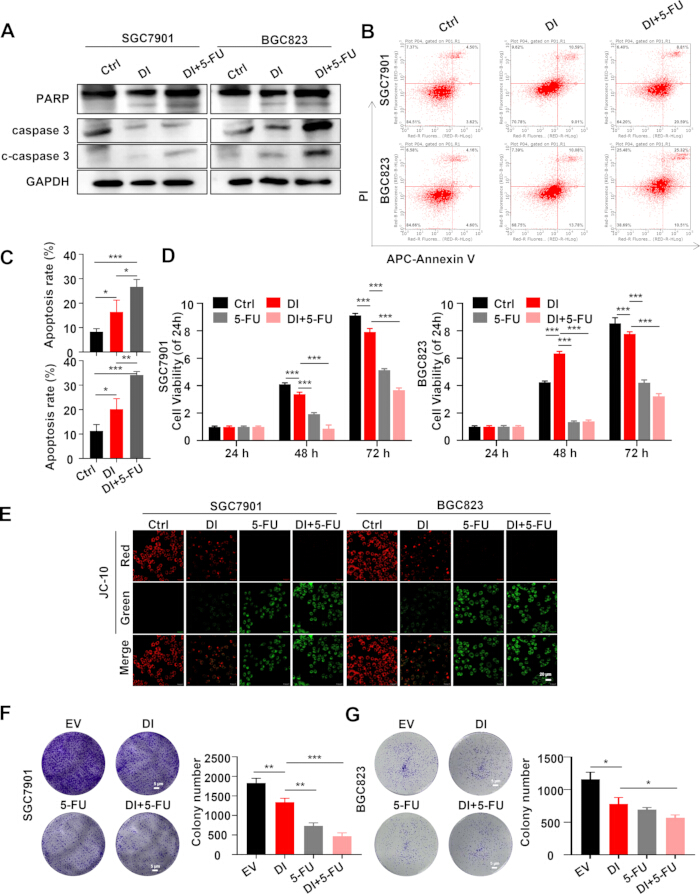
Figure 2: Enhanced inhibition of gastric cancer by combined treatment with DI and 5-FU. (A) Western blot analysis showed that the combination of DI and 5-FU significantly increased the levels of cleaved poly (ADP-ribose) polymerase (cleaved PARP) and cleaved caspase 3 compared to the DI-only group, indicating enhanced apoptotic signaling. (B,C) Cell apoptotic assay demonstrated an increased apoptotic rate in the DI and 5-FU combination group compared to the DI-only group, as assessed by flow cytometry. (D) The CCK-8 assay confirmed that cell proliferation was significantly reduced in the DI and 5-FU combination group compared to the DI-only group, indicating a greater effect on cell growth inhibition. (E) JC-10 assay revealed that the DI and 5-FU combination group induced loss of mitochondrial membrane potential, leading to the release of cytochrome c and subsequent activation of apoptosis. Scale bar = 20 µm. (F,G) The soft agar colony formation assay showed a significant reduction in colony formation in the DI and 5-FU combination group, indicating decreased long-term proliferative capacity. Abbreviations: DI = Danshen injection; 5-FU = 5-fluorouracil; PARP = poly(ADP-ribose) polymerase; JC-10 = 5,5′,6,6′-tetrachloro-1,1′,3,3′-tetraethylbenzimidazolylcarbocyanine iodide. Please click here to view a larger version of this figure.
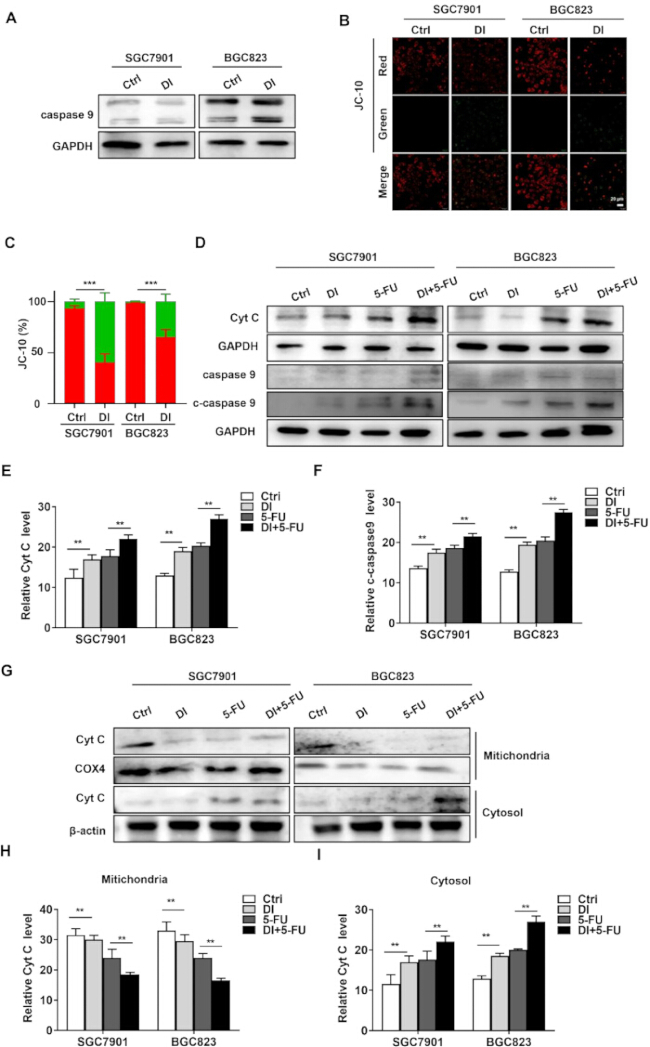
Figure 3: Intrinsic apoptotic pathway activation by DI. (A) Caspase-9 expression was significantly upregulated in the DI-treated group. (B,C) JC-10 staining revealed a loss of mitochondrial membrane potential following DI treatment. Scale bar = 20 µm. (D) Representative western blot images showing the protein expression of cytochrome c and cleaved caspase-9 in gastric cancer cells following treatment with DI, 5-FU, or their combination. (E,F) Quantitative densitometric analysis of cytochrome c and cleaved caspase-9 levels normalized to GAPDH. (G–I) Subcellular protein quantification revealed a significant increase in cytoplasmic cytochrome c levels and a concomitant decrease in mitochondrial cytochrome c levels upon DI and 5-FU combination treatment. Abbreviations: DI = Danshen injection; 5-FU = 5-fluorouracil; JC-10 = 5,5′,6,6′-tetrachloro-1,1′,3,3′-tetraethylbenzimidazolylcarbocyanine iodide; GAPDH = glyceraldehyde-3-phosphate dehydrogenase. Please click here to view a larger version of this figure.
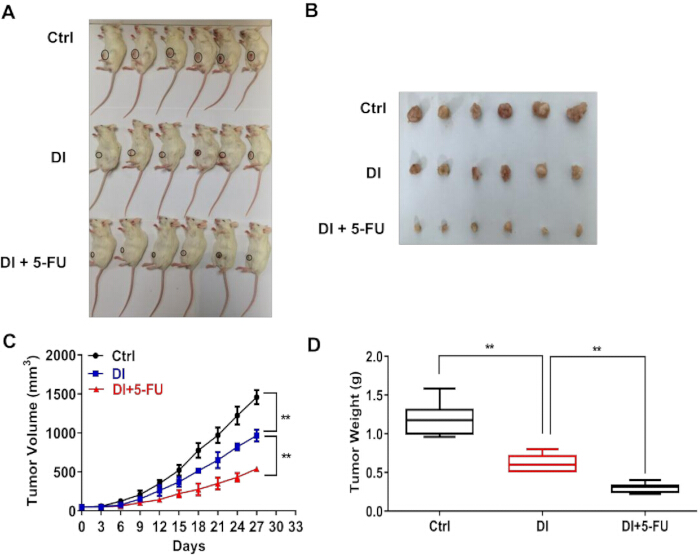
Figure 4: Tumorigenesis inhibition in the NOD/SCID model by combination treatment with DI and 5-FU. (A,B) Tumors in the DI + 5-FU combination treatment group were significantly smaller compared with those in the DI-only treatment group, as observed in CDX model mice following intravenous tail injection. The average (C) tumor volume and (D) tumor weight in the DI + 5-FU combination group were significantly reduced compared with the DI group (P < 0.001 and P < 0.01, respectively), indicating enhanced antitumor efficacy of the combination treatment. Abbreviations: DI = Danshen injection; 5-FU = 5-fluorouracil; CDX = cell-derived xenograft; NOD/SCID = non-obese diabetic/severe combined immunodeficient. Please click here to view a larger version of this figure.
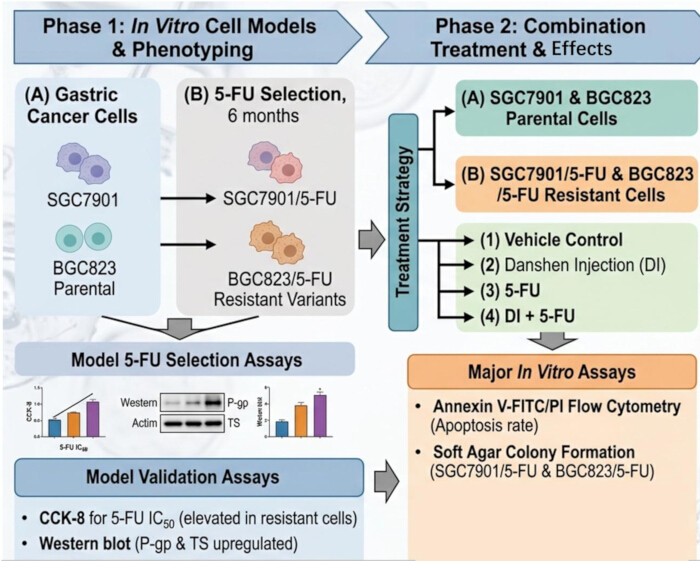
Figure 5: Graphical overview of the study design and experimental workflow. The schematic illustrates the stepwise generation and validation of parental and 5-FU-resistant gastric cancer cell lines (SGC7901 and BGC823), the in vitro treatment arms (DI alone, 5-FU alone, and DI + 5-FU combination) with their corresponding assay endpoints (CCK-8, Annexin V/PI apoptosis, JC-10, soft agar colony formation, and western blot), the in vivo xenograft model design and treatment regimen. Abbreviations: DI = Danshen injection; 5-FU = 5-fluorouracil; 5-FU-R = 5-fluorouracil resistant; CCK-8 = Cell Counting Kit-8; JC-10 = 5,5′,6,6′-tetrachloro-1,1′,3,3′-tetraethylbenzimidazolylcarbocyanine iodide; PI = propidium iodide. Please click here to view a larger version of this figure.
Supplementary File 1: STR authentication report for cell line. Please click here to download this file.
Supplementary File 2. Quality control and supporting data for Danshen Injection and western blot analyses. Supplementary Figure S1 shows the UPLC-QTOF-MS fingerprint and chemical characterization of 12 batches of Danshen Injection. Supplementary Figure S2 presents the uncropped raw western blot images corresponding to the main figures. Supplementary Table S1 lists the identified common peaks, molecular information, and mass spectrometric characteristics of Danshen Injection constituents. Please click here to download this file.
Diskussion
Gastric cancer continues to represent a leading cause of oncological mortality worldwide, and the progressive development of 5-FU resistance remains one of the most formidable obstacles to the long-term efficacy of 5-FU-based chemotherapy11. Against this backdrop, the identification of complementary agents capable of restoring chemosensitivity while limiting additional systemic toxicity constitutes a clinically urgent research objective12. The present study provides experimental evidence that DI, a preparation derived from Salvia miltiorrhiza, exerts significant antitumor activity in gastric cancer cell models and produces a greater combined effect with 5-FU in inhibiting tumor cell proliferation and promoting apoptosis, at least in part associated with the intrinsic mitochondrial apoptotic pathway (Figure 5).
Our initial findings demonstrated that DI treatment significantly increased the apoptotic rate in both SGC7901 and BGC823 wild-type gastric cancer cell lines. Importantly, CCK-8 assays revealed a marked elevation in IC50 values for 5-FU in drug-resistant variants of these cell lines, rising from 5.32 nM to 38.76 nM in SGC7901/5-FU cells and from 14.99 nM to 72.86 nM in BGC823/5-FU cells, confirming that acquired resistance substantially diminishes 5-FU sensitivity in these models. These findings are consistent with previously reported mechanisms of 5-FU resistance in gastric cancer, which frequently involve dysregulation of apoptotic signaling cascades and upregulation of drug efflux pumps13. The fact that DI maintained pro-apoptotic activity even in resistant cell lines suggests it may act through mechanisms that are at least partially independent of classical drug resistance pathways, making it a particularly attractive candidate for combination strategies.
A central finding of this study is the therapeutic efficacy of combined DI and 5-FU treatment. When used in combination, DI and 5-FU produced a significantly greater degree of apoptosis than either agent alone, as evidenced by elevated levels of cleaved PARP and cleaved caspase-3 on Western blot analysis, increased apoptotic fractions by flow cytometry, and markedly suppressed colony formation in soft agar assays. These observations collectively indicate that DI not only retains intrinsic antitumor activity but also potentiates the cytotoxic effect of 5-FU. Mechanistically, JC-10 assays confirmed that the combination treatment triggers loss of mitochondrial membrane potential and subsequent cytochrome c release, a hallmark of intrinsic apoptosis initiation. This pattern of mitochondrial dysfunction-mediated cell death aligns with emerging evidence that bioactive compounds from TCM frequently exert their anticancer effects by targeting mitochondrial integrity14.
Specifically, we observed significant upregulation of caspase-9 activity and elevated cytoplasmic cytochrome c levels, accompanied by a corresponding depletion of mitochondrial cytochrome c in response to combined treatment. Subcellular fractionation analysis corroborated these findings and provided direct evidence that DI promotes the translocation of cytochrome c from mitochondria to the cytoplasm, a pivotal step in triggering the caspase-9/caspase-3 apoptotic cascade. These data are particularly noteworthy because resistance to apoptosis via suppression of the mitochondrial pathway is a well-recognized mechanism underlying both intrinsic and acquired 5-FU resistance in gastric cancer15. By reactivating this pathway, DI may help circumvent one of the primary barriers to effective chemotherapy.
Several limitations of the present study warrant acknowledgment. While our in vitro and xenograft in vivo models provide valuable mechanistic insights, they may not fully recapitulate the complexity of the human tumor microenvironment, including immune cell infiltration, stromal interactions, and systemic pharmacokinetics16. Additionally, the precise bioactive constituents of Danshen injection responsible for the observed effects—whether tanshinones, salvianolic acids, or other phenolic components—remain to be delineated through further fractionation and bioactivity-guided studies17. The standardization of herbal preparations is a recognized challenge in TCM research, and future studies employing chemically defined fractions or purified compounds will be necessary to establish structure–activity relationships and support regulatory approval pathways18. Furthermore, although our data suggest that DI modulates the intrinsic apoptotic pathway, additional upstream targets—including Bcl-2 family proteins, reactive oxygen species generation, and endoplasmic reticulum stress responses—warrant systematic evaluation to build a comprehensive mechanistic framework19.
From a translational perspective, combining DI with 5-FU represents a potentially viable strategy for clinical investigation20. TCM-derived agents have historically offered advantages in multitargeted activity and relatively favorable tolerability profiles, and the integration of such agents into oncological practice has garnered increasing scientific and regulatory interest21. However, rigorous pharmacokinetic studies, dose optimization, and well-designed clinical trials will be essential before this combination can be considered for clinical application22. Establishing robust pharmacodynamic biomarkers—such as cytochrome c release or caspase-9 cleavage—in accessible biological specimens could facilitate future patient stratification and therapeutic monitoring.
In conclusion, this study demonstrates that Danshen injection exerts meaningful antitumor activity in gastric cancer, promotes apoptosis through activation of the intrinsic mitochondrial pathway, and produces a greater combined effect with 5-FU in 5-FU-resistant gastric cancer. These results provide a preclinical rationale for further investigation of DI as a complementary agent in the management of 5-FU-resistant gastric cancer and lay the groundwork for future mechanistic and translational studies to optimize its therapeutic application.
Offenlegungen
The authors have no conflicts of interest to declare.
Danksagungen
The authors thank all laboratory members of the Department of General Surgery, First Affiliated Hospital of Anhui University of Chinese Medicine, for technical support.
This work was funded by Anhui Province 14th Five-Year Plan clinical key specialty construction promotion plan (no. [2022] 91); Anhui Provincial Health Research Project (no. AHWJ2022a004); and Anhui Key Research and Open Program (no. 202004J07020047).
Materialien
| Name | Unternehmen | Katalognummer | Kommentare |
|---|---|---|---|
| Alexa Fluor 647-conjugated goat anti-rabbit IgG | Bioss | BS0295G | Secondary antibody |
| Annexin V-FITC/PI apoptosis detection kit | |||
| Anti-cleaved caspase-3 antibody | Cell Signaling Technology | 9661S | Primary antibody |
| Anti-cleaved caspase-9 antibody | Cell Signaling Technology | 9501S | Primary antibody |
| Anti-COX4 antibody | Cell Signaling Technology | 4850S | Primary antibody |
| Anti-cytochrome c antibody | Cell Signaling Technology | 11940S | Primary antibody |
| Anti-GAPDH antibody | Cell Signaling Technology | 2118S | Primary antibody |
| Anti-PARP antibody | Cell Signaling Technology | 9542S | Primary antibody |
| Anti-total caspase-9 antibody | Cell Signaling Technology | 9502S | Primary antibody |
| Anti-β-actin antibody | Cell Signaling Technology | 4970S | Primary antibody |
| BGC823 cells | Cell Bank of the Chinese Academy of Sciences | TCHu 44 | Human gastric cancer cell line |
| Bovine serum albumin (BSA) | Blocking reagent | ||
| CCK-8 kit | Cell viability assay | ||
| Crystal violet | |||
| Danshen injection | Jiangsu Hengfeng Pharmaceutical | ||
| DAPI | Nuclear stain | ||
| Fetal bovine serum (FBS) | Gibco | ||
| FITC-conjugated goat anti-mouse IgG | Abcam | ab6785 | Secondary antibody |
| Goat anti-mouse IgG-HRP | Affinity Biosciences | S0002 | Secondary antibody |
| Goat anti-rabbit IgG-HRP | Fcmacs | FMS Rb01 | Secondary antibody |
| Low-melting-point agarose | |||
| Mycoplasma detection kit | Lonza | LT07-318 | |
| Paraformaldehyde | |||
| Penicillin-streptomycin | HyClone | ||
| Phosphate-buffered saline (PBS) | |||
| RPMI-1640 medium | Biological Industries | ||
| SGC7901 cells | Cell Bank of the Chinese Academy of Sciences | TCHu 62 | Human gastric cancer cell line |
| Triton X-100 |
Referenzen
- Sung H, et al. Global cancer statistics 2020: GLOBOCAN estimates of incidence and mortality worldwide for 36 cancers in 185 countries. CA Cancer J Clin. 2021;71(3):209-49.
- Smyth EC, et al. Gastric cancer. Lancet. 2020;396(10251):635-48.
- Sexton RE, Al Hallak MN, Diab M, Azmi AS. Gastric cancer: a comprehensive review of current and future treatment strategies. Cancer Metastasis Rev. 2020;39(4):1179-203.
- Tan Y, et al. Chinese herbal medicine combined with oxaliplatin-based chemotherapy for advanced gastric cancer: a systematic review and meta-analysis of contributions of specific medicinal materials to tumor response. Front Pharmacol. 2022;13:977708.
- Chen X, et al. The anticancer properties of Salvia miltiorrhiza Bunge (Danshen): a systematic review. Med Res Rev. 2014;34(4):768-94.
- Chen J, Shi DY, Liu SL, Zhong L. Tanshinone IIA induces growth inhibition and apoptosis in gastric cancer in vitro and in vivo. Oncol Rep. 2012;27(2):523-8.
- Bae WJ, et al. Inhibition of proliferation of prostate cancer cell line DU-145 in vitro and in vivo using Salvia miltiorrhiza Bunge. Chin J Integr Med. 2020;26(7):533-8.
- Zhou L, Zuo Z, Chow MSS. Danshen: an overview of its chemistry, pharmacology, pharmacokinetics, and clinical use. J Clin Pharmacol. 2005;45(12):1345-59.
- Qu C, et al. Pharmacodynamics and pharmacokinetics of Danshen in isoproterenol-induced acute myocardial ischemic injury combined with Honghua. J Ethnopharmacol. 2020;247:112284.
- Blondy S, et al. 5-Fluorouracil resistance mechanisms in colorectal cancer: from classical pathways to promising processes. Cancer Sci. 2020;111(9):3142-54.
- Sethy C, Kundu CN. 5-Fluorouracil resistance and the new strategy to enhance the sensitivity against cancer: implication of DNA repair inhibition. Biomed Pharmacother. 2021;137:111285.
- Zhang W, Zhao Y, Liu H, Jing C. Efficacy of traditional Chinese medicine combined with chemotherapy in the treatment of gastric cancer: a meta-analysis. Comput Math Methods Med. 2022;2022:8497084.
- Tang H, et al. Reversal of 5-fluorouracil resistance by EGCG is mediated by inactivation of TFAP2A/VEGF signaling pathway and down-regulation of MDR-1 and P-gp expression in gastric cancer. Oncotarget. 2017;8(46):82842-53.
- Efferth T, et al. Collateral sensitivity of natural products in drug-resistant cancer cells. Biotechnol Adv. 2020;38:107342.
- Wang X, et al. PLOD2 increases resistance of gastric cancer cells to 5-fluorouracil by upregulating BCRP and inhibiting apoptosis. J Cancer. 2020;11(12):3467-75.
- Zhao Z, et al. The tumor microenvironment and immunotherapy of gastric cancer. Front Immunol. 2021;12:685610.
- Ngo TM, et al. Diterpenoids isolated from the root of Salvia miltiorrhiza and their anti-inflammatory activity. Nat Prod Res. 2021;35(5):726-32.
- Kum KY, Kirchhof R, Luick R, Heinrich M. Danshen (Salvia miltiorrhiza) on the global market: what are the implications for products' quality Front Pharmacol. 2021;12:621169.
- Tait SWG, Green DR. Mitochondria and cell death: outer membrane permeabilization and beyond. Nat Rev Mol Cell Biol. 2010;11(9):621-32.
- Chen F, et al. Baicalein reverses hypoxia-induced 5-FU resistance in gastric cancer AGS cells through suppression of glycolysis and the PTEN/Akt/HIF-1α signaling pathway. Oncol Rep. 2015;33(1):457-63.
- Kim SD, et al. Comprehensive evaluation of traditional herbal medicine combined with adjuvant chemotherapy on post-surgical gastric cancer: a systematic review and meta-analysis. Integr Cancer Ther. 2024;23:15347354231226256.
- Hung KF, et al. Complementary Chinese herbal medicine therapy improves survival of patients with gastric cancer in Taiwan: a nationwide retrospective matched-cohort study. J Ethnopharmacol. 2017;199:168-74.