The present work examines how genetic polymorphisms within the FAM13A (Family with Sequence Similarity 13 Member A) gene relate to chronic obstructive pulmonary disease (COPD) predisposition among elderly individuals of Chinese Han ancestry, with the rs2869950 variant emerging as a noteworthy risk determinant.
Forschungsartikel
Association of Family with Sequence Similarity 13 Member A Polymorphisms and Chronic Obstructive Pulmonary Disease Risk
* These authors contributed equally
In diesem Artikel
Zusammenfassung
Zusammenfassung
Prior evidence has linked DNA sequence variations in the FAM13A (family with sequence similarity 13 member A) locus to the onset of respiratory pathologies. Conducted as a hospital-based case–control investigation, this study sought to clarify whether selected single nucleotide polymorphisms (SNPs) in FAM13A influence the likelihood of developing chronic obstructive pulmonary disease (COPD) in older adults belonging to the Chinese Han population. The cohort comprised 541 participants, among whom 270 were diagnosed with COPD and 271 served as healthy comparators. DNA was isolated from peripheral blood leukocytes and genotyped by matrix-assisted laser desorption/ionization time-of-flight mass spectrometry (MALDI-TOF MS). Five SNPs—namely, rs2602119, rs1801915, rs11944668, rs3756050, and rs2869950—were evaluated through multivariable logistic regression modeling, while potential epistatic interactions were probed via multifactor dimensionality reduction (MDR). FPRP analysis was used to assess the noteworthiness of statistically significant associations, with an FPRP threshold of 0.2 and a prior probability level of 0.25. The variant C allele of rs2869950 was identified as a genetic risk factor for COPD susceptibility (OR = 1.38, 95% CI: 1.07–1.77, p = 0.012; FPRP = 0.033). Similarly, the heterozygous TC genotype of rs2869950 was significantly associated with an elevated risk of COPD (TC vs. TT: OR = 1.66, 95% CI: 1.14–2.40, p = 0.008; FPRP = 0.025). Moreover, the FAM13A-rs2869950 variant was found to be significantly associated with an increased risk of COPD in specific subgroups, including females, smokers, drinkers, individuals older than 71 years, and those with a BMI below 24 kg/m2 (OR > 1, p < 0.05). MDR analysis indicated synergistic interactions among SNPs, with a four-locus model (rs2602119, rs1801915, rs11944668, and rs2869950) achieving a testing balanced accuracy of 0.5193 (training balanced accuracy, 0.6075) and perfect cross-validation consistency. Taken together, these data indicate that both the C allele and the TC genotype at rs2869950 constitute susceptibility factors for COPD in the population under investigation.
Einleitung
Globally, chronic obstructive pulmonary disease (COPD) stands among the most burdensome long-term respiratory disorders, exacting a heavy toll on healthcare systems and economies alike owing to its widespread occurrence and high case-fatality rates1. Analyses of the Global Burden of Disease Study 2021 further show that COPD prevalence and incidence continue to climb among adults aged 70 years and older2. Within China, this illness constitutes a grave public health menace, with a substantial and still-growing national disease burden recorded between 1990 and 20213. Data from the China Pulmonary Health investigation documented an overall prevalence of 8.6% in adults aged 20 years and beyond; while the rate was merely 2.1% in the 20–39 age bracket, it climbed steeply to 13.7% among those 40 years and older4,5. These figures show that COPD prevalence rises steeply with age, so that middle-aged and elderly adults carry the largest share of the disease burden. Notwithstanding growing awareness in healthcare delivery and public health practice, the challenges of effective COPD prevention and disease control persist.
The pathogenic mechanisms underlying COPD have yet to be fully elucidated. Over recent years, research interest has gravitated toward the roles of oxidative injury and heightened inflammatory cascades in disease development6. The advent of genome-wide association approaches, alongside the broad application of whole-genome sequencing and evolving analytical tools for genetic data, has spurred an expanding body of work centered on host genetic susceptibility to COPD and its clinical manifestations7. Earlier investigations additionally underscored that disequilibrium between prooxidant and antioxidant systems—manifesting as aberrantly intensified oxidative stress coupled with weakened antioxidant defenses—participates critically in both the inception and the progression of the disorder8,9. The gene of interest in this study has already been implicated in the pathogenesis of respiratory ailments such as bronchial asthma and pulmonary carcinoma10,11, with its mode of action largely tied to the modulation of oxidative stress pathways12. That said, the published literature remains relatively sparse with regard to investigations directly addressing the association in question. The current research was therefore conceived to assess the contribution of the family with sequence similarity 13 member A (FAM13A) genetic variants to COPD susceptibility specifically within the aged Chinese Han demographic, aiming to deliver mechanistic insights that may inform a more nuanced understanding of the gene's regulatory function in disease emergence and trajectory.
Protokoll
The study was conducted in accordance with the Declaration of Helsinki. All procedures involving human participants were carried out in accordance with the ethical standards set forth by the responsible institutional committee. The study protocol received approval from the Medical Ethics Committee of Hainan General Hospital (approval number: [2022]312) and was executed under the committee's strict supervision. Written informed consent was obtained from every enrolled individual.
Recruitment of participants
Through systematic screening of COPD patients presenting at outpatient and inpatient services, a total of 270 individuals who satisfied the eligibility criteria were recruited into the case arm. A post-bronchodilator forced expiratory volume in one second to forced vital capacity (FEV1/FVC) ratio below 70%, consistent with guideline-recommended diagnostic thresholds13, served as the reference standard for COPD confirmation. Enrollment required participants to be at least 60 years of age, free from hormone or immunomodulatory therapy within the preceding month, devoid of diagnosed psychiatric illness, and willing to provide consent. Subjects were excluded if they presented with cardiogenic asthma, pulmonary malignancy, hypersensitivity pneumonitis, significant comorbidities involving non-pulmonary organ systems, a history of thoracic or abdominal surgical procedures within the preceding 90 days, or evidence of poor adherence. In parallel, 271 healthy volunteers were enrolled from the institution's health screening unit to constitute the control group; their eligibility hinged on a medical examination ruling out lung pathology and other organ disease, with no records of respiratory tract infection in the prior 30 days. All control participants underwent spirometry as part of the screening examination, and only those with a post-bronchodilator FEV1/FVC ratio ≥ 0.70 and no chronic respiratory symptoms were retained, thereby excluding asymptomatic airflow limitation from the control cohort.
Selection of candidate genetic variants
The chromosomal coordinates of FAM13A (family with sequence similarity 13 member A) were retrieved from the Ensembl Genome Browser by querying the relevant gene identifier. The genomic coordinates for the FAM13A gene were retrieved from the Ensembl genome browser. The genotype annotation files used for TagSNP selection were obtained from the 1000 Genomes Project (genome build GRCh38), utilizing the EAS/CHB reference haplotype panel; the files were downloaded in 2026 and imported into Haploview for TagSNP selection. Tag single-nucleotide polymorphisms (TagSNPs) were determined through the Tagger function using prespecified parameters: minor allele frequency exceeding 0.05, linkage disequilibrium r2 threshold of 0.80, genotyping call rate above 75%, and Hardy-Weinberg equilibrium P-value greater than 0.01. From the TagSNPs identified, five FAM13A variants were drawn at random for analysis: rs2602119, rs1801915, rs11944668, rs3756050, and rs2869950. Random selection procedure: All TagSNPs meeting the criteria are listed to form a candidate pool. The selection process does not consider information such as biological function, previously reported literature, or predictions of deleterious effects, nor does it apply any biological or statistical weighting; selection is made solely from the set of eligible candidates, without any prior bias.
DNA extraction and genotyping
Venous blood specimens (5 mL) were collected from all participants into ethylenediaminetetraacetic acid (EDTA)-anticoagulated tubes and preserved at -80 °C until processing. Extraction and purification of genomic DNA were performed with a commercial DNA isolation kit according to the manufacturer's protocol. DNA concentration and purity were assessed spectrophotometrically, and samples with an A260/A280 ratio between 1.8 and 2.0 were accepted for genotyping; DNA integrity was verified by 1% agarose gel electrophoresis.
Genotype determination was carried out on a matrix-assisted laser desorption/ionization time-of-flight mass spectrometry (MALDI-TOF MS) platform. Primer sequences necessary for amplification and extension reactions were generated using the vendor-provided web-based assay design software and are listed in Supplementary Table 1. Multiplex PCR amplification was performed in a 5-µL reaction containing approximately 10 ng of genomic DNA, 0.5 U of hot-start DNA polymerase, 0.5 pmol of each amplification primer, and 500 µM of each dNTP, with cycling conditions of 95 °C for 2 min; 45 cycles of 95 °C for 30 s, 56 °C for 30 s, and 72 °C for 60 s; and a final extension at 72 °C for 5 min. Unincorporated dNTPs were dephosphorylated with shrimp alkaline phosphatase (37 °C for 40 min, then 85 °C for 5 min), and single-base extension was performed with the manufacturer's extension reagent kit (94 °C for 30 s; 40 cycles of 94 °C for 5 s, each with five inner cycles of 52 °C for 5 s and 80 °C for 5 s; and 72 °C for 3 min). Extension products were desalted with resin, spotted onto the analysis chip, and analyzed by MALDI-TOF MS. Genotype calling was performed with the manufacturer's analysis software; mass spectra were reviewed manually by two independent operators, ambiguous or low-confidence calls were repeated, and variants or samples failing the quality thresholds were excluded from the analysis.
Statistical analysis
Conformity of the candidate SNPs to the Hardy-Weinberg equilibrium was tested by contrasting observed against expected genotype distributions within the control cohort. Association between FAM13A polymorphisms and COPD status was evaluated through the web-based analytical resource SNPStats, with odds ratios (ORs) and 95% confidence intervals (CIs) estimated under codominant, dominant, recessive, overdominant, and log-additive genetic models and adjusted for age, sex, smoking status, and drinking status. All additional computations were performed with standard statistical software. Continuous variables were summarized as mean ± standard deviation, and intergroup comparisons employed the independent-samples t-test. Categorical variables were expressed as counts (percentages) and analyzed via the chi-square test. The false-positive report probability (FPRP) metric was calculated by the method of Wacholder et al.14, using prior probabilities of 0.25, 0.1, and 0.01, and associations with FPRP < 0.2 were regarded as noteworthy. Multifactor dimensionality reduction (MDR) was undertaken with 10-fold cross-validation and 1,000 permutation tests to assess combinatorial effects among the candidate loci. A two-tailed P-value below 0.05 was adopted as the threshold for declaring statistical significance.
Ergebnisse
Cohort characteristics
The investigation enrolled 541 participants altogether: 270 COPD cases (comprising 206 men and 64 women) and 271 healthy controls (210 men and 61 women) (Table 1). The COPD group had an average age of 72.26 ± 10.40 years, whereas the control group averaged 69.21 ± 6.61 years (p < 0.0001). Among healthy comparators, 136 individuals reported a history of smoking, and 133 were categorized as alcohol consumers. Within the COPD arm, smokers numbered 128 and drinkers 126. The mean FEV1/FVC ratio measured in the case cohort was 58.56 ± 15.05%. Because cases were on average older than controls, age was included as a covariate in all multivariable association models.
Genotyping outcomes for FAM13A variants
All five genotyped polymorphisms conformed to Hardy-Weinberg expectations, indicating the absence of notable genotyping artifacts or population stratification (Table 2). Comparison of minor allele frequencies across populations revealed discernible inter-ethnic variation in the distribution of these SNPs (Table 2).
Impact of FAM13A SNPs on COPD susceptibility
Analysis of the genotype data uncovered a significantly elevated proportion of the rs2869950 C allele among COPD patients (39.4%) relative to healthy controls (32.1%), suggesting that this allele operates as a risk factor for COPD in the study sample (OR = 1.38; 95% CI: 1.07–1.77; p = 0.012). Consistent with this, the heterozygous TC genotype at rs2869950 was encountered more frequently in the case group (50.7%) than in controls (41.3%), demonstrating a statistically robust association with heightened COPD vulnerability. Under dominant, overdominant, and log-additive inheritance frameworks, the rs2869950 locus retained its significant link to increased risk. None of the remaining four candidate variants displayed a statistically meaningful association with disease status (Table 3). FPRP assessment corroborated the credibility of the positive signals derived from the primary analysis: for the rs2869950 C allele, FPRP was 0.092 at a prior probability of 0.1 (0.033 at 0.25); for the TC genotype, FPRP was 0.070; and for the dominant model, FPRP was 0.048, all below the 0.2 noteworthiness threshold (Supplementary Table 2).
Subgroup stratification
To probe the potential influence of confounders, stratified evaluations were performed across strata defined by sex, age, cigarette smoking, alcohol intake, and body mass index (Figure 1). The risk-conferring effect of rs2869950 proved especially striking in female participants, smokers, subjects older than 71 years, individuals with a BMI below 24 kg/m2, and alcohol drinkers. Based on FPRP calculations, the associations observed in the overall sample and in the drinking and BMI < 24 kg/m2 strata met the criteria for noteworthy findings (FPRP < 0.2 at a prior probability of 0.1; Supplementary Table 2).
MDR analysis
MDR modeling revealed that both the four-locus combination (rs2602119, rs1801915, rs11944668, rs2869950) and the full five-locus model attained the highest testing balanced accuracy among the multi-locus models (0.5193; training balanced accuracy, 0.6075) and a cross-validation consistency of 10/10 (Table 4), designating them as the most predictive multi-locus configurations for COPD risk. Within these models, rs2602119 and rs11944668 exhibited a strong reciprocal synergy, whereas rs2869950 demonstrated the greatest information gain, underscoring its dominant contribution to predictive capacity (Figure 2).
Conclusions
Our findings identify the C allele and the heterozygous TC genotype of rs2869950 as genetic determinants significantly associated with elevated COPD susceptibility. These results open a promising line of investigation and supply a foundational rationale for crafting individualized strategies for COPD prevention and clinical management, with particular applicability to the elderly Han Chinese demographic. Should independent cohorts confirm this association, rs2869950 may prove useful as a genetic marker for risk stratification of high-risk smokers and for guiding early screening in this population.
DATA AVAILABILITY:
The original data for this article have been uploaded to the Science Data Bank (ScienceDB), and the data link is https://www.scidb.cn/s/7Jb6Jv, where they are publicly available to everyone.
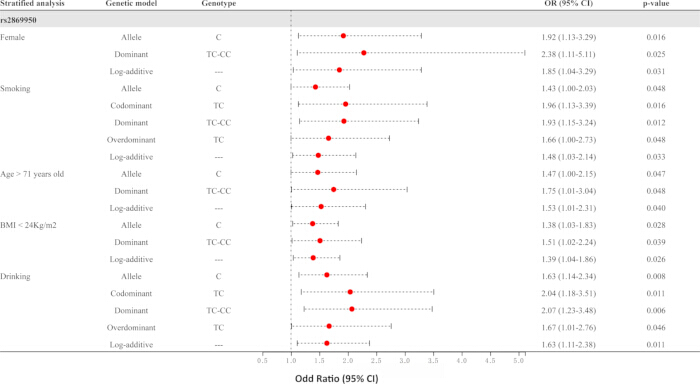
Figure 1: Forest plot illustrating the association between FAM13A genetic variants and COPD susceptibility in subgroup-stratified analysis. Point estimates (squares) and 95% confidence intervals (horizontal lines) are shown for the rs2869950 risk models within strata defined by sex, age (>71 years, ≤71 years), smoking status, drinking status, and body mass index (BMI < 24 kg/m2, ≥24 kg/m2). Estimates to the right of the vertical reference line (OR = 1) indicate increased COPD risk. OR = odds ratio; CI = confidence interval; COPD = chronic obstructive pulmonary disease; BMI = body mass index. Please click here to view a larger version of this figure.
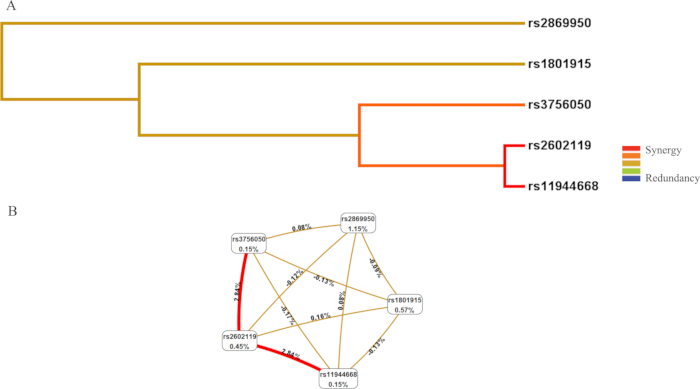
Figure 2: MDR analysis of the interactions between FAM13A SNPs. (A) SNP-SNP Interaction Dendrogram: The color spectrum represents the degree of redundancy or synergy between the SNPs; redder colors signify greater synergy, while bluer colors denote higher redundancy. (B) Fruchterman-Reingold Layout: The values within the nodes indicate the information gain (IG) of individual SNPs (main effects), while the values between nodes denote the IG of each SNP pair (interaction effects). MDR = multifactor dimensionality reduction; SNP = single nucleotide polymorphism; IG = information gain. Please click here to view a larger version of this figure.
Table 1: Baseline demographic and clinical characteristics of study participants. Data are presented as mean ± standard deviation or n (%). P values were derived from the independent-samples t test (age) or the chi-square test (categorical variables); a represents the p-value calculated by the t-test; b represents the p-value calculated by the chi-square test. BMI = body mass index; COPD = chronic obstructive pulmonary disease; FEV1 = forced expiratory volume in the first second; FVC = forced vital capacity. Please click here to download this table.
Table 2: Summary information and Hardy–Weinberg equilibrium (HWE) assessment for candidate FAM13A variants. Minor allele frequencies observed in cases and controls are shown together with reference frequencies for Han Chinese in Beijing (CHB), Southern Han Chinese (CHS), African (AFR), and European (EUR) populations. A = minor allele; B = wild-type allele; HWE p > 0.05 indicates conformity with Hardy–Weinberg equilibrium. AFR, African; CHB, Han Chinese in Beijing; CHS, Southern Han Chinese; EUR, European; HWE, Hardy-Weinberg equilibrium; MAF, minor allele frequency; SNP, single nucleotide polymorphism. Please click here to download this table.
Table 3: Association between candidate FAM13A SNPs and COPD risk. Odds ratios (ORs) and 95% confidence intervals (CIs) were estimated by logistic regression under allele, codominant, dominant, recessive, overdominant, and log-additive models, with adjustment for age, sex, smoking status, and drinking status. p < 0.05 and bold text indicate statistical significance; "–" indicates the log-additive model. CI = confidence interval; COPD = chronic obstructive pulmonary disease; OR = odds ratio; SNP = single nucleotide polymorphism. Please click here to download this table.
Table 4: MDR analysis of SNP–SNP interaction effects on COPD susceptibility. For each locus combination, the training and testing balanced accuracy, odds ratio (OR) with 95% confidence interval (CI), P value, and cross-validation consistency (CVC) are shown; the four- and five-locus models achieved the highest testing balanced accuracy among the multi-locus models (0.5193) with a CVC of 10/10. P values were calculated using χ2 tests; p < 0.05 and bold text indicate statistical significance. Bal. Acc. = balanced accuracy; CVC = cross-validation consistency; COPD = chronic obstructive pulmonary disease; MDR = multifactor dimensionality reduction; OR = odds ratio; SNP = single nucleotide polymorphism; 95% CI = 95% confidence interval. Please click here to download this table.
Supplementary Table 1: The primers for FAM13A gene amplification and single-base extension genotyping. SNP = single nucleotide polymorphism; UEP-DIR = unique extension primer direction; UEP-SEQ = unique extension primer sequence. Please click here to download this file.
Supplementary Table 2: The FPRP and statistical power values of all the positive results in this study. FPRP = false-positive report probability; OR = odds ratio; CI = confidence interval; BMI = body mass index. aStatistical power was calculated using the number of observations in the subgroup and the OR and P values in this table. bThe false-positive report probability threshold was set at 0.2. *indicates noteworthy findings (FPRP below the 0.2 threshold at the corresponding prior probability). Please click here to download this file.
Diskussion
Querying publicly accessible genomic databases brought to light five candidate FAM13A polymorphisms whose minor allele frequencies diverged notably across populations of differing genetic ancestry. This observation reinforces the importance of examining the contribution of FAM13A to COPD predisposition in a genetic-background-specific manner. We explored the relationship between these five variants and disease risk within a cohort of elderly Han Chinese individuals, and our data demonstrate that the rs2869950 polymorphism exhibits a statistically significant correlation with greater COPD susceptibility. In particular, carriage of the rs2869950 C allele and the TC heterozygous genotype emerged as independent risk determinants. Moreover, the variant's risk association proved prominent in specific demographic and lifestyle-based subgroups, namely females, smokers, individuals older than 71 years, those with a BMI less than 24 kg/m2, and alcohol drinkers.
The comparable smoking prevalence in COPD cases (128/270, 47.4%) and controls (136/271, 50.2%) departs from the pattern reported in many Western case–control studies, in which cases smoke far more frequently than controls, and therefore warrants comment. First, smoking status was recorded as any history of smoking: many of elderly patients (mean age, 72.26 years) had stopped smoking before or at the time of diagnosis, whereas the controls—recruited from a health screening unit—included current smokers who were healthy enough to attend screening. Second, hospital-based recruitment of controls may not fully represent the general population, and a substantial minority of Chinese COPD cases arise from non-smoking exposures such as biomass fuel smoke, ambient air pollution, and prior tuberculosis4,15. Consistent with a genuine risk effect rather than an artifact of smoking, the rs2869950 association was evident within the smoking stratum (dominant model: OR = 1.93; 95% CI: 1.15–3.24; p = 0.012; Supplementary Table 2), although a formal test of gene–smoking interaction will require larger samples.
The FAM13A gene family has been functionally linked to an array of pulmonary pathologies including COPD, bronchial asthma, lung carcinoma, and pulmonary fibrotic disorders16. The FAM13A protein product is understood to participate in oxidative stress regulation and to engage intracellular signaling networks17. Beyond oxidative stress, FAM13A regulates RhoA activity and actin cytoskeleton dynamics, promotes epithelial–mesenchymal transition (EMT) in airway epithelial cells, and intersects transforming growth factor-β (TGF-β) signaling, thereby contributing to airway remodeling and fibrosis17,18. Within COPD pathogenesis, both uncontrolled inflammation and perturbed redox homeostasis are widely acknowledged as central mechanistic pillars19. Supporting this, experimental evidence has documented that a skewed oxidative balance—characterized by aberrant elevations in reactive oxygen species and coincident suppression of antioxidant defense mediators—contributes to disease initiation and progression20. Immunohistochemical analyses have further revealed upregulated FAM13A expression in the small-airway epithelium of COPD-affected individuals21. Concurrently, it has been hypothesized that FAM13A may influence airway structural remodeling through regulatory effects on epithelial cell apoptosis and proliferative activity21. Synthesizing the current findings with the existing body of literature, we speculate that the rs2869950 variant may act by augmenting the expression of FAM13A, a recognized oxidative stress mediator, consequently amplifying the risk of developing COPD. From a translational standpoint, if the association is confirmed in independent cohorts, rs2869950 genotyping could support risk stratification of high-risk smokers and inform decisions about early screening, although clinical implementation will require functional characterization of the causal variant and prospective validation.
Several limitations inherent to the present study warrant explicit acknowledgment. The genetic composition of our study sample is relatively uniform, underscoring the imperative for future validation studies that incorporate larger and ethnically more diverse participant cohorts. In addition, although all association models were adjusted for age, the case and control groups differed in mean age, and residual age-related confounding cannot be entirely excluded; spirometry-based exclusion of airflow limitation in controls reduces, but cannot fully eliminate, the risk of control misclassification. Looking ahead, based on the insights generated here, it is critical to implement functional experimental strategies aimed at dissecting the mechanistic contributions of the FAM13A-rs2869950 variant to the etiology and pathological progression of COPD. The current discovery furnishes a novel conceptual vantage point from which individualized approaches to COPD prevention and therapeutic management may be formulated22.
Offenlegungen
The authors declare that no competing interests exist.
AUTHOR CONTRIBUTIONS:
Yichi Wang and Yue Zhang: drafted the manuscript and revised it critically for important intellectual content; Yichi Wang, Yue Zhang, Yunjun Zhang, and Yihui Fu: conducted the experimental work; Yichi Wang, Qi Lin, and Chanyi He: performed data analysis and generated figures and tables; Tian Xie and Yipeng Ding: conceived and designed the study. All authors reviewed and approved the final version of the manuscript.
Danksagungen
This research was supported by the specific research fund of The Innovation Platform for Academicians of Hainan Province (YSPTZX202312) and the Hainan Province Science and Technology Special Fund (No. ZDYF2024SHFZ094). We express our sincere gratitude to all individuals who participated in this study.
Materialien
| Name | Unternehmen | Katalognummer | Kommentare |
|---|---|---|---|
| Blood collection tubes (EDTA-K2 anticoagulant) | BD (Becton, Dickinson and Company) | 367856 | BD Vacutainer Plus plastic K2EDTA tube, 6.0 mL; venous blood sampling, stored at −80 °C |
| DNA extraction and purification kit | TIANGEN BIOTECH (BEIJING) CO., LTD. | DP705 | Peripheral blood leukocyte DNA extraction |
| UV-Vis spectrophotometer | Thermo Fisher Scientific | ND-2000 | NanoDrop 2000; DNA concentration and purity (A260/A280) assessment |
| Agarose | Biowest | 111860 | 1% agarose gel electrophoresis for DNA integrity check |
| Hot-start DNA polymerase | QIAGEN | 203203 | HotStarTaq DNA Polymerase (250 U); multiplex PCR amplification |
| dNTP set (100 mM) | Thermo Fisher Scientific | R0181 | 4 × 0.25 mL, 100 mM solutions; PCR |
| PCR and extension (UEP) primers | Sangon Biotech (Shanghai) Co., Ltd. | Custom synthesis per assay design software output; lot information in the primer design report | |
| iPLEX Gold Reagent Kit | Agena Bioscience | 10141-2 | Complete reagent set including shrimp alkaline phosphatase, iPLEX enzyme, buffers, and mass-modified nucleotides for single-base extension |
| SpectroCHIP II G384 | Agena Bioscience | 10139 | MALDI-TOF MS analysis chip |
| MassARRAY Analyzer 4 | Agena Bioscience | MALDI-TOF mass spectrometer (instrument) | |
| MassARRAY Assay Design Suite | Agena Bioscience | Free web-based assay design software (primers) | |
| MassARRAY Typer 4.0 software | Agena Bioscience | Genotype calling and manual spectrum review | |
| Ensembl Genome Browser | Ensembl | GRCh38.p14 | Genome annotation and reference sequences (FAM13A coordinates) |
| VCF to PED Converter | Ensembl Tools | Genotype data format conversion | |
| Haploview software | Broad Institute | 4.2 | TagSNP selection and linkage disequilibrium analysis |
| SNPStats | the Catalan Institute of Oncology | Association analysis under multiple genetic models | |
| SPSS software | SPSS Inc. (Chicago, IL, USA) | 22 | Descriptive and comparative statistics |
| MDR software | University of Pennsylvania (open-source) | 3.0.2 | Multifactor dimensionality reduction; available at www.epistasis.org |
Referenzen
- Cao Z, et al. Burden of chronic respiratory diseases and their attributable risk factors in 204 countries and territories, 1990–2021: results from the Global Burden of Disease Study 2021. Chin Med J Pulm Crit Care Med. 2025;3(2):100-10.
- Meng K, Chen X, Chen Z, Xu J. Burden of chronic obstructive pulmonary disease in adults aged 70 years and older, 1990–2021: findings from the Global Burden of Disease Study 2021. PLoS One. 2025;20(1).
- Dong F, Su R, Ren Y, Yang T. Burden of chronic obstructive pulmonary disease and risk factors in China from 1990 to 2021: analysis of Global Burden of Disease 2021. Chin Med J Pulm Crit Care Med. 2025;3(2):132-40.
- Wang C, et al. Prevalence and risk factors of chronic obstructive pulmonary disease in China (the China Pulmonary Health [CPH] study): a national cross-sectional study. Lancet. 2018;391(10131):1706-17.
- Fang L, et al. Chronic obstructive pulmonary disease in China: a nationwide prevalence study. Lancet Respir Med. 2018;6(6):421-30.
- Karnati S, et al. Chronic obstructive pulmonary disease and the cardiovascular system: vascular repair and regeneration as a therapeutic target. Front Cardiovasc Med. 2021;8:649512.
- Coste F, et al. Assessing pulmonary hypertension in COPD. Is there a role for computed tomography? Int J Chron Obstruct Pulmon Dis. 2019;14:2065-79.
- Wiegman CH, et al. Oxidative stress in ozone-induced chronic lung inflammation and emphysema: a facet of chronic obstructive pulmonary disease. Front Immunol. 2020;11:1957.
- Zhuan B, et al. Hypoxia induces pulmonary artery smooth muscle dysfunction through mitochondrial fragmentation-mediated endoplasmic reticulum stress. Aging (Albany NY). 2020;12(23):23684-97.
- Lundbäck V, et al. FAM13A and POM121C are candidate genes for fasting insulin: functional follow-up analysis of a genome-wide association study. Diabetologia. 2018;61(5):1112-23.
- Ruffin M, Thompson KE, Corvol H, Guillot L. Two-hybrid screening of FAM13A protein partners in lung epithelial cells. BMC Res Notes. 2020;12(1):804.
- Chen Q, et al. FAM13A regulates cellular senescence marker p21 and mitochondrial reactive oxygen species production in airway epithelial cells. Am J Physiol Lung Cell Mol Physiol. 2023;325(4):L460-66.
- Kahnert K, Jörres RA, Behr J, Welte T. The diagnosis and treatment of COPD and its comorbidities. Dtsch Arztebl Int. 2023;120(25):434-44.
- Wacholder S, et al. Assessing the probability that a positive report is false: an approach for molecular epidemiology studies. J Natl Cancer Inst. 2004;96(6):434-42.
- Zhou Y, et al. COPD in Chinese nonsmokers. Eur Respir J. 2009;33(3):509-18.
- Zhang Y, et al. High expression of FAM13A was associated with increasing the liver cirrhosis risk. Mol Genet Genomic Med. 2019 Mar;7(3):e543.
- Corvol H, et al. FAM13A is a modifier gene of cystic fibrosis lung phenotype regulating RhoA activity, actin cytoskeleton dynamics and epithelial-mesenchymal transition. J Cyst Fibros. 2018;17(2):190-203.
- Ye L, et al. Increased serum Romo1 was correlated with lung function, inflammation, and oxidative stress in chronic obstructive pulmonary disease. Inflammation. 2019;42(5):1555-60.
- Fan X, et al. PM2.5 increases susceptibility to acute exacerbation of COPD via NOX4/Nrf2 redox imbalance-mediated mitophagy. Redox Biol. 2023;59:102587.
- Zhu JY, Ma LQ, Zhang J. Effect of family with sequence similarity 13 member A gene interference on apoptosis and proliferation of human airway epithelial cells and its relationship with small airway remodeling in patients with chronic obstructive pulmonary disease. Zhonghua Yi Xue Za Zhi. 2020;100(32):2481-7.
- Luo Z, et al. The multifaceted role of FAM13A in pulmonary diseases. Front Genet. 2026;17:1820547.
- Zhu AZ, et al. CHRNA5-A3-B4 genetic variants alter nicotine intake and interact with tobacco use to influence body weight in Alaska Native tobacco users. Addiction. 2013;108(10):1818-28.