Die vorgeschlagene Automatisierungsplattform für die Niederspannungsabnahme integriert das Internet der Dinge (IoT), visuelle Workflow-Orchestrierung, Edge- und Cloud-Computing, Feature-Engineering sowie maschinelles Lernen, um die Abnahmeprüfung von Niederspannungsanlagen (LV) zu automatisieren. Die Plattform ermöglicht eine intelligente Fehlererkennung, Echtzeit-Entscheidungsfindung, automatisierte Abnahme, hohe Genauigkeit, geringe Betriebslatenz und skalierbare Bereitstellung.
Ein Abonnement von JoVE ist erforderlich, um diesen Inhalt anzuzeigen. Melden Sie sich an oder beginnen Sie noch heute mit einer kostenlosen Testphase.
Forschungsartikel
Eine prozessgesteuerte Automatisierungsplattform für die Niederspannungsabnahme mit visueller Workflow-Orchestrierung und Machine-Learning-Validierung
In diesem Artikel
Zusammenfassung
Zusammenfassung
The rapid expansion of low-voltage (LV) networks and their integration with distributed energy resources requires intelligent and automated management solutions. Cloud-edge collaborative Internet of Things (IoT) platforms support real-time monitoring, control, and data acquisition. However, existing platforms generally lack workflow automation, visual process orchestration, user-guided decision support, and comprehensive validation. Consequently, they do not provide process-driven solutions for automated LV network acceptance testing. This study presents the design and evaluation of a Low-Voltage Acceptance Automation Platform based on a visualized process canvas. The proposed platform adopts a process-driven architecture in which acceptance workflows are visually created, managed, and executed. The visual process canvas transforms conventional static monitoring into dynamic workflow automation by enabling real-time workflow execution, validation, and decision-making. The framework incorporates the Open LV Network & Smart Meter dataset to support realistic modeling of electrical load behavior. The workflow includes IoT-based data acquisition, data preprocessing, feature engineering, workflow orchestration using the visual process canvas, machine learning-based validation, and real-time dashboard visualization. The proposed framework achieved a fault detection rate of 98.4%, a receiver operating characteristic area under the curve (ROC-AUC) of 0.968, and an operational decision latency of 31 ms, outperforming traditional cloud-centric and IoT-based baseline approaches by approximately 30%–40%.
Einleitung
Industrie 4.0 (I4.0)1 wird durch mehrere neu aufkommende Technologien ermöglicht, wobei das industrielle Internet der Dinge (IIoT) eine der wichtigsten darstellt. IIoT bezeichnet den Einsatz von Internet-der-Dinge-(IoT-)Technologien in industriellen Umgebungen, in denen vernetzte Geräte und Maschinen hauptsächlich über Maschine-zu-Maschine-Interaktionen kommunizieren. Da Ausfälle in industriellen Systemen erhebliche Betriebsverluste verursachen können, erfordern IIoT-Anwendungen eine äußerst zuverlässige Kommunikation und erzeugen dabei deutlich größere Datenmengen als herkömmliche IoT-Systeme2. Zudem betrachten einige Studien das IIoT als ein eng mit Industrie 4.0 verwandtes Konzept3. IoT-Technologien verändern traditionelle hierarchische Architekturen, indem sie flexiblere Systeme mit nahtlosem Datenaustausch ermöglichen4. Zahlreiche aktuelle Studien haben bestehende IIoT-Architekturen überprüft und neue Rahmenkonzepte vorgeschlagen5,6,7,8,9. Trotz dieser Entwicklungen bestehen zwei wesentliche Einschränkungen weiterhin. Erstens werden häufig neue Rahmenwerke vorgeschlagen, um die Mängel früherer Architekturen zu beheben, was zu einer wachsenden Zahl alternativer Modelle führt, die die architektonische Vielfalt und die Komplexität der Implementierung erhöhen. Zweitens schränkt das hohe Maß an Abstraktion, das vielen vorgeschlagenen Architekturen eigen ist, deren praktische Anwendung in industriellen Umgebungen ein10.
In der Literatur wurden bereits mehrere IIoT-Architekturen beschrieben. Eine auf dem Open Platform Communications (OPC)-Standard basierende IIoT-Architektur wurde zusammen mit einer Python-Middleware zur Verwaltung der OPC-Kommunikation vorgestellt11. In wurde eine siebenstufige IIoT-Architektur vorgeschlagen; jedoch wurden keine Implementierungsdetails und Validierungsexperimente bereitgestellt12. Ein Framework zur Integration von 5G- und IIoT-Technologien wurde zusammen mit einem repräsentativen Anwendungsbeispiel beschrieben, obwohl die experimentelle Validierung begrenzt war13. Ein Emotionsdesign-Framework für Industrie 4.0 wurde eingeführt, und seine möglichen Auswirkungen wurden ohne experimentelle Überprüfung diskutiert14. Eine mehrschichtige IIoT-Plattform wurde in einem realen Testfeld evaluiert, wobei der Schwerpunkt auf telekommunikativen Aspekten lag15. Ebenso wurde in ein modulares IoT-Framework zur Überwachung der Innenraumluftqualität vorgestellt, und seine Leistung wurde anhand von Daten bewertet, die aus 84 Haushalten mit Kindern gesammelt wurden16.
Das Internet der Dinge (IoT) hat sich zu einer sich rasant entwickelnden Technologie mit erheblichem Anwendungspotenzial im Elektrizitätssektor entwickelt17,18. Die Integration von IoT-Technologien in Netzknoten ermöglicht eine intelligentere und effizientere Stromerzeugung, -übertragung, -verteilung, -betrieb und -nutzung durch autonome Entscheidungsfindung, die durch kontinuierliche Echtzeitüberwachung des Stromflusses im intelligenten Netz (Smart Grid) unterstützt wird. Folglich verbessern diese intelligenten Knoten die gesamte Betriebsleistung des elektrischen Netzes19. Die Kommunikationstechnologie stellt eine grundlegende Komponente bei der Implementierung intelligenter Netze dar, da zwei Hauptkategorien von Informationen zuverlässig übertragen werden müssen: Sensormessungen und Steuersignale. Neben geringer Kommunikationslatenz erfordern Anwendungen in intelligenten Netzen eine angemessene Dienstgüte (QoS) und ausreichende Datensicherheit, um einen zuverlässigen Betrieb sicherzustellen20.
Die Auswahl einer geeigneten Kommunikationstechnologie für Smart-Grid-Anwendungen erfordert die Berücksichtigung von Kommunikationsintervallen, Datenübertragungsraten und Kommunikationskosten21. IoT-Kommunikationsnetzwerke bestehen typischerweise aus Software-, Sicherheits-, Dienstleistungs-, System- und Konnektivitätsschichten. Innerhalb der Konnektivitätsschicht werden Kommunikationsprotokolle gewöhnlich in drei Kategorien eingeteilt. Zu den Langstreckenprotokollen gehören Long Range (LoRa) und Narrowband-IoT (NB-IoT); zu den Mittelstreckenprotokollen zählen Wi-Fi, 4G/LTE und 5G; und zu den Kurzstreckenprotokollen gehören Bluetooth und ZigBee. Da die Strommärkte zunehmend dereguliert wurden, ist die Lastprognose wichtiger geworden, um die Auswirkungen von Wetterbedingungen, Geräteausfällen, regulatorischen Änderungen und anderen betrieblichen Faktoren auf die Kosten der Stromversorgung zu bewerten. Daher ist eine genaue Prognose des häuslichen Energieverbrauchs für den Betrieb und die Überwachung von Smart Grids, Mikrogrids und intelligenten Gebäuden unerlässlich22.
Ein zuverlässiger Betrieb von Niederspannungsnetzen (NS-Netzen) hängt von der Aufrechterhaltung einer hohen Spannungsqualität23 ab. Die Qualität der elektrischen Energie wird durch die Wirksamkeit der Spannungsregelung, die Stromsymmetrie und die Minderung technischer Störungen unter unsymmetrischen Betriebsbedingungen bestimmt24. Unter diesen Faktoren ist die Phasenausgleichung besonders wichtig, da sie die gleichmäßige Verteilung von Spannungen und Strömen über die Phasen bestimmt25. Eine schlechte Phasenausgleichung kann die Erwärmung der Leiter, Spannungsabweichungen und Neutralströme erhöhen, wodurch die Systemeffizienz und Betriebssicherheit verringert werden26. Daher sollte die Phasenausgleichung bereits im Planungsprozess berücksichtigt werden, um die Systemleistung, Betriebsstabilität und Langzeitverlässlichkeit zu verbessern. Dennoch wird dieser Aspekt selten in herkömmliche Minigrid-Planungsmethoden integriert.
Neuere Fortschritte bei Workflow-Orchestrierungssystemen haben die Vorteile der ereignisgesteuerten Automatisierung und der visuellen Prozessverwaltung in industriellen IoT-Umgebungen gezeigt. Dennoch ist ihre Anwendung auf die Validierung von Verteilnetzen und die Abnahmeprüfung von Niederspannungsanlagen bisher begrenzt. Die meisten bestehenden Niederspannungs-Automatisierungssysteme konzentrieren sich hauptsächlich auf Überwachung und leittechnische Steuerung, während vergleichsweise wenige Studien workflowbasiertes Abnahmemanagement oder automatisierte Konformitätsprüfungen untersuchen. Ebenso haben maschinelle Lernverfahren beträchtliche Aufmerksamkeit für die Anomalieerkennung bei intelligenten Zählern und die Beurteilung der Netzqualität erhalten, doch diese Ansätze werden im Allgemeinen als unabhängige analytische Modelle entwickelt, anstatt als Bestandteile eines integrierten Frameworks für die Workflow-Orchestrierung.
In den letzten Jahren wurden verschiedene intelligente Zählerlösungen für das Management intelligenter Gebäude und die Hausautomatisierung vorgeschlagen27. In Referenz27 wurde ein Prototyp eines intelligenten Zählers vorgestellt, um die Integration von bildungsbezogenen Konzepten auf universitärem Niveau in Technologien zur intelligenten Zählerablesung zu demonstrieren. Der entwickelte intelligente Zähler zeigte ein erhebliches Potenzial für Energiemanagement und -kontrolle, verringerte den Energieverbrauch und profitierte sowohl von Seiten der Versorger als auch der Verbraucher durch bidirektionale IoT-Kommunikation. Anschließend wurde ein mikrocontrollerbasiertes System mit intelligenten Steckdosen zur Unterstützung einer intelligenten Energieüberwachung eingeführt28.
Das vorgeschlagene Smart-Plug-System zeigt den Stromverbrauch über eine auf Android basierende grafische Benutzeroberfläche in Echtzeit an. Zusätzlich kann das Gerät das Vorhandensein angeschlossener elektrischer Geräte erkennen, eine Fähigkeit, die als invasive Lastmessung bezeichnet wird28. Für die Implementierung wurde eine kostengünstige kommerzielle Smart-Plug verwendet. Zukünftige Erweiterungen beinhalten die Überwachung des Effektivwerts des Stroms (RMS), der Wirkleistung, der Blindleistung sowie des Phasenwinkels zwischen Spannung und Strom. Wie in unseren früheren Studien beschrieben, verwendet ein teilweise netzgekoppelter photovoltaischer Mikro-Netzverbund die Kommunikationsprotokolle ZigBee und LoRa, um Informationen mit intelligenten Zählergeräten auszutauschen, wodurch die Machbarkeit einer IoT-fähigen Kommunikation für dezentrale Energiesysteme gezeigt wird29,30.
Um die Einschränkungen der herkömmlichen Planung von Verteilnetzen zu überwinden, haben sich die ingenieurwissenschaftliche Praxis und die Forschung in mehreren komplementären Richtungen weiterentwickelt. Ein Forschungsansatz konzentrierte sich auf die strategische Planung mithilfe von Geoinformationssystemen (GIS) zur Standortauswahl und vorläufigen Ressourcenbewertung31,32. Eine weitere Richtung zielte darauf ab, einzelne Komponenten und Teilsysteme zu verbessern, einschließlich der Leiterauswahl, der optimalen Dimensionierung von Erzeugungseinheiten und Energiespeichern sowie des vergleichenden Leistungsvergleichs von Wechselstrom- (AC-) und Gleichstrom- (DC-) Verteilnetzen33,34,35,36. Ein dritter Forschungsansatz wandte Optimierungsalgorithmen auf die Planung von Verteilnetzen, die Leiterführung und die Gestaltung der Netztopologie an. Zu den jüngsten Entwicklungen zählen Frameworks wie die uGrid-Plattform der Forscher, die die Geräteplatzierung und Netzkonfiguration integriert, jedoch keine standardmäßige Lastflussanalyse zur Verifizierung und Optimierung bietet. Andere Ansätze basieren auf manueller Parametereinstellung zur Generierung der Topologie oder konzentrieren sich auf spezialisierte Anwendungen wie niederleistungsfähige DC-Mikronetze37,38,39. Obwohl diese Ansätze einen beträchtlichen Fortschritt darstellen, ist weiterer Forschungsbedarf erforderlich, um eine integrierte Methodik für das durchgängige Design von Niederspannungsverteilnetzen zu etablieren. Zudem sind umfassende techno-ökonomische Bewertungen von einphasigen, dreiphasigen und hybriden Niederspannungssystemen bisher begrenzt.
Die jüngsten Fortschritte in der künstlichen Intelligenz (AI) und im maschinellen Lernen haben die Fähigkeiten intelligenter Stromnetze weiter erweitert. Eine umfassende Übersicht fasste Anwendungen von KI und maschinellem Lernen in intelligenten Stromnetzen zusammen, einschließlich neuartiger Technologien wie des Föderierten Lernens, Generativer KI, Großer Sprachmodelle, des KI-der-Dinge (AIoT) und Digitaler Zwillinge40. In der Übersicht wurden Anwendungen im Lastprognosebereich, in der vorausschauenden Wartung, der Anomalieerkennung, dem Lastmanagement auf der Nachfrageseite sowie der Integration von Elektrofahrzeugen hervorgehoben und gleichzeitig auf anhaltende Herausforderungen im Zusammenhang mit Interoperabilität, Datenschutz, Skalierbarkeit, Robustheit und ethischen Aspekten hingewiesen. Eine weitere aktuelle Übersicht bewertete KI-Methoden für das dezentrale Energiemanagement in IoT-Edge-Cloud-Infrastrukturen, wobei der Fokus auf maschinellem Lernen, verstärkendem Lernen und Multi-Agenten-Systemen für die dezentrale Energiekontrolle lag41.
Zusammenfassend haben bisherige Studien die IoT-gestützte Überwachung, intelligente Zähler, Cloud-Edge-Computing, künstliche Intelligenz und intelligentes Energiemanagement für Niederspannungsverteilnetze (LV) vorangebracht. Allerdings wurden diese Technologien weitgehend unabhängig voneinander entwickelt. Die Orchestrierung von Arbeitsabläufen, das automatisierte Annahmemanagement, die prozessgesteuerte Validierung und die integrierte Entscheidungsunterstützung sind weiterhin begrenzt, was die Notwendigkeit eines einheitlichen, arbeitsablauforientierten Automatisierungsrahmens unterstreicht.
Dementsprechend stellt diese Studie eine Automatisierungsplattform für die Niederspannungsabnahme basierend auf einer visualisierten Prozess-Canvas vor. Der vorgeschlagene Rahmen integriert datenbasierte Erfassung über das Internet der Dinge (IoT), Daten-Vorverarbeitung, Merkmalsengineering, Workflow-Orchestrierung, validierungsbasierte maschinelles Lernen, Cloud-Edge-Computing und Echtzeit-Visualisierung in einer einheitlichen Architektur, um automatisierte und zuverlässige Abnahmetests von Niederspannungsnetzen unter Verwendung realer Smart-Meter-Daten zu unterstützen. Abbildung 1 gibt einen Überblick über die workfloworientierte Architektur der vorgeschlagenen Plattform. Der Workflow umfasst Datenerfassung, Vorverarbeitung, Merkmalsengineering, Workflow-Orchestrierung, intelligente Entscheidungsfindung und Cloud-Edge-Integration und ermöglicht so die automatisierte Validierung von Niederspannungsverteilnetzen durch einen prozessorientierten Rahmen. Die Plattform zeigte im Vergleich zu herkömmlichen Ansätzen eine hohe Validierungsgenauigkeit sowie eine reduzierte Latenz bei betrieblichen Entscheidungen und eine verkürzte Workflow-Ausführungszeit.
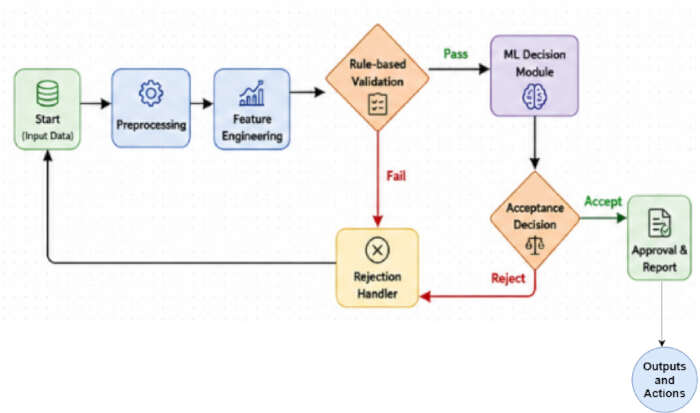
Abbildung 1. Arbeitsablauforientierte Architektur der vorgeschlagenen Automatisierungsplattform für die Niederspannungsabnahme. Hochstufige Architektur der vorgeschlagenen prozessgesteuerten Automatisierungsplattform für die Niederspannungsabnahme (LV). Das Framework veranschaulicht die sequenzielle Integration von datengestützter Erfassung mittels Internet der Dinge (IoT), Datenpräprozessierung, Merkmalsengineering, Workflow-Orchestrierung, intelligenter Entscheidungsfindung, Cloud-Edge-Kollaboration und automatisierter Abnahme zur Validierung von Niederspannungsverteilnetzen. IoT = Internet der Dinge; LV = Niederspannung; ML = maschinelles Lernen. Bitte klicken Sie hier, um eine größere Version dieser Abbildung anzusehen.
Zugriff eingeschränkt. Bitte melden Sie sich an oder starten Sie eine Testversion, um diesen Inhalt anzuzeigen.
Protokoll
This study did not involve human participants, animals, or identifiable personal data. The analyses were performed using a publicly available dataset (UK Power Networks Open LV Network & Smart Meter dataset) together with synthetically generated data for validation; therefore, ethics committee approval and informed consent were not required. The research tools used in the protocol are listed in the Table of Materials.
1. Data acquisition
The Low-Voltage (LV) Acceptance Automation Platform was developed using electrical measurements acquired from smart meters, IoT sensors, and the Open LV Network & Smart Meter Dataset. Electrical parameters, including voltage, current, active power, reactive power, and energy consumption, were collected through Wi-Fi-, PLC-, and RS-485-based communication protocols. Real-time measurements were used for live system monitoring, whereas historical data supported model development and validation.
The proposed framework used the Open LV Network & Smart Meter Dataset provided by UK Power Networks42. The dataset comprises household smart meter consumption, feeder-level load profiles, and feeder voltage measurements. Time-series subsets containing load consumption and voltage data were selected for model training and evaluation. In addition, a simulated smart meter dataset was generated to represent operational conditions and fault scenarios required for workflow validation and machine learning model evaluation. The simulated dataset included timestamped measurements of voltage, current, active power, reactive power, energy consumption, total harmonic distortion (THD), and voltage imbalance. Fault samples were generated by simulating undervoltage, overvoltage, excessive harmonic distortion, and voltage imbalance based on established low-voltage operational thresholds. The dataset characteristics are summarized in Table 1.
| Attribute | Description |
| Dataset Name | Open LV Network & Smart Meter Dataset |
| Simulated Smart Meter Dataset | Geneated 1000 smaples for Fault simulation and workflow validation |
| Data Type | Time-series (historical smart meter data) |
| Data Granularity | Household-level and feeder-level measurements |
| Key Features | Voltage, current, active power, reactive power, energy consumption, timestamps |
| Data Frequency | High-resolution (e.g., half-hourly / minute-level depending on subset) |
| Coverage | Residential low-voltage distribution networks |
| Usage in Proposed Work | Model training, validation, load behavior analysis, and acceptance workflow evaluation |
Table 1: Dataset description. Summary of the Open LV Network & Smart Meter dataset used for model development and performance evaluation. The table presents the dataset components, measured electrical variables, sampling characteristics, and dataset partitioning for training, validation, and testing.
Because the Open LV Network & Smart Meter Dataset does not contain predefined fault labels, a rule-based labeling strategy was applied to both the real and simulated datasets. Samples satisfying normal operating limits were assigned a label of 0 (Normal), whereas samples exceeding operational thresholds (e.g., voltage deviations greater than ±10% of the nominal voltage, THD > 5%, or voltage unbalance > 2%) were assigned a label of 1 (Fault). These labels served as the ground truth during model training, validation, and testing. The proposed rule engine also allows threshold values to be configured in accordance with regional standards or utility-specific acceptance criteria.
The dataset was partitioned into training (70%), validation (15%), and testing (15%) subsets. Missing values were addressed using linear interpolation, mean imputation, and forward-fill techniques as described in the preprocessing stage. To ensure statistical robustness and reproducibility, all experiments were repeated five times using different random seeds.
2. Data preprocessing
Raw data from the Open LV Network & Smart Meter Dataset and IoT sensor measurements were preprocessed to improve data quality prior to feature extraction and model development. Missing values, noise, and inconsistencies caused by communication interruptions and sensor malfunctions were identified and corrected using interpolation, mean imputation, and forward-fill techniques. The detailed mathematical derivations are provided in Supplementary File 1 (Section S1).
The preprocessed time-series data were segmented into representative operational intervals (S₁–S₅ and Sk). Statistical and electrical features, including average load, peak load, minimum load, standard deviation, voltage deviation, and power consumption, were extracted from each segment. The extracted features are summarized in Table 2 and served as inputs for the subsequent feature engineering stage.
| Segment ID | Mean Load (kW) | Peak Load (kW) | Min Load (kW) | Std Deviation (kW) | Voltage Deviation (p.u.) | Power Consumption (kWh) | Time Interval |
| S₁ | 2.45 | 3.8 | 1.2 | 0.65 | 0.032 | 58.4 | 00:00–01:00 |
| S₂ | 2.9 | 4.1 | 1.5 | 0.72 | 0.028 | 64.2 | 01:00–02:00 |
| S₃ | 3.25 | 4.85 | 1.8 | 0.81 | 0.035 | 71.6 | 02:00–03:00 |
| S₄ | 3.8 | 5.2 | 2.1 | 0.9 | 0.041 | 78.9 | 03:00–04:00 |
| S₅ | 4.1 | 5.75 | 2.4 | 0.95 | 0.045 | 85.3 | 04:00–05:00 |
| Sk | 3.6 | 5.1 | 2 | 0.88 | 0.038 | 76.5 | tk |
Table 2: Representative feature representation extracted from time-series segments. Representative statistical, electrical, load behavior, voltage stability, and power quality features extracted from segmented LV time-series data during feature engineering. The values illustrate the engineered feature representation and are not experimental performance results. LF = Load Factor; PAR = Peak-to-Average Ratio; VSI = Voltage Stability Index; PF = Power Factor; THD = Total Harmonic Distortion.
3. Feature engineering
Feature engineering was performed to improve the representation of the preprocessed data for workflow orchestration and intelligent decision-making. Principal Component Analysis (PCA)^43 was applied to reduce data dimensionality by removing redundant and highly correlated variables while retaining the most informative feature components. The mathematical derivations are provided in Supplementary File 1 (Section S2).
Statistical descriptors, load behavior indicators, voltage stability indices, and power quality metrics were derived from the segmented time-series data. These engineered features included Load Factor (LF), Peak-to-Average Ratio (PAR), Voltage Stability Index (VSI), Voltage Unbalance Index, Power Factor (PF), and Total Harmonic Distortion (THD). The resulting feature set was used as the input to the workflow orchestration and intelligent decision-making modules.
The feature engineering workflow is summarized in Supplementary File 1 (Supplementary Algorithm 1). The procedure consisted of segmenting the preprocessed data, extracting statistical and electrical features, calculating load behavior, voltage stability, and power quality indicators, and applying PCA to generate the final feature vector used for model training and validation.
4. Visualized process canvas design
The Visualized Process Canvas was developed as a graph-based workflow orchestration framework for automating low-voltage (LV) acceptance procedures. The workflow was represented as a directed graph, G = (N, E), where N = {n1, n2, …, nm}denotes the workflow nodes corresponding to individual processing stages (e.g., data input, preprocessing, validation, and decision-making), and E = {eij}represents the directed edges defining the execution sequence between nodes. This graph-based representation enabled the creation of configurable workflows and their automated execution without manual coding.
Each workflow node performed a specific processing task by receiving input data, executing predefined operations, and forwarding the processed output to subsequent nodes. Acceptance criteria, including voltage and load thresholds, were implemented as configurable validation rules that could be updated without modifying the workflow structure. The workflow supported both sequential and parallel execution to improve computational efficiency. Machine learning models were integrated into designated workflow nodes to perform anomaly detection and automated acceptance validation (Figure 2).
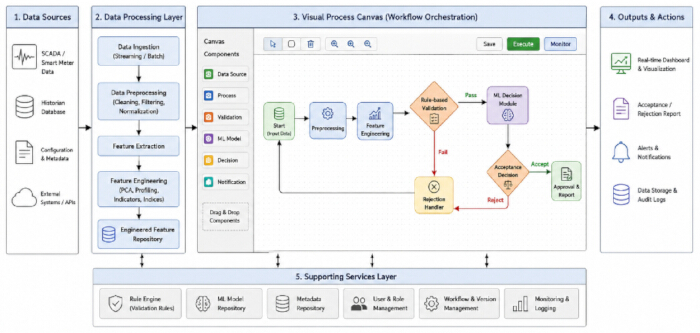
Figure 2: Visualized process canvas architecture for LV acceptance automation. Overview of the visual workflow orchestration framework used for LV acceptance automation. The process canvas illustrates the graphical organization of workflow nodes for data processing, feature engineering, rule-based validation, intelligent decision-making, and output generation to support workflow design, execution, and monitoring. Please click here to view a larger version of this figure.
The mathematical formulation describing information flow through the workflow graph is provided in Supplementary File 1 (Section S3). Supplementary File 1 (Supplementary Algorithm 2) describes the workflow orchestration procedure, including workflow traversal, node execution, rule validation, decision generation, and output aggregation.
The Visualized Process Canvas was implemented using a microservice-oriented software architecture to support scalability and modular deployment. The graphical workflow interface was developed using React.js to provide drag-and-drop workflow configuration. Backend orchestration services were implemented using Flask/FastAPI, while Eclipse Mosquitto served as the MQTT message broker for communication between workflow modules. EdgeX Foundry provided edge device management and IoT integration. Machine learning services were implemented with Scikit-learn, TensorFlow, and PyTorch, and containerized with Docker and Kubernetes.
5. Workflow orchestration engine
The workflow orchestration engine coordinated execution of the configured acceptance workflow. A detailed description is provided in Supplementary File 1 (Section S4), and the execution sequence is summarized in Supplementary Figure 1.
The workflow execution process consisted of validating the workflow definition, initializing the execution environment, scheduling workflow nodes according to their dependencies, executing nodes sequentially or in parallel, applying rule-based validation, aggregating intermediate outputs, and generating the final acceptance or rejection decision based on rule-based and machine learning evaluation. Execution results were published through dashboards, reports, application programming interfaces (APIs), and data storage services. The overall workflow orchestration process is illustrated in Figure 3.
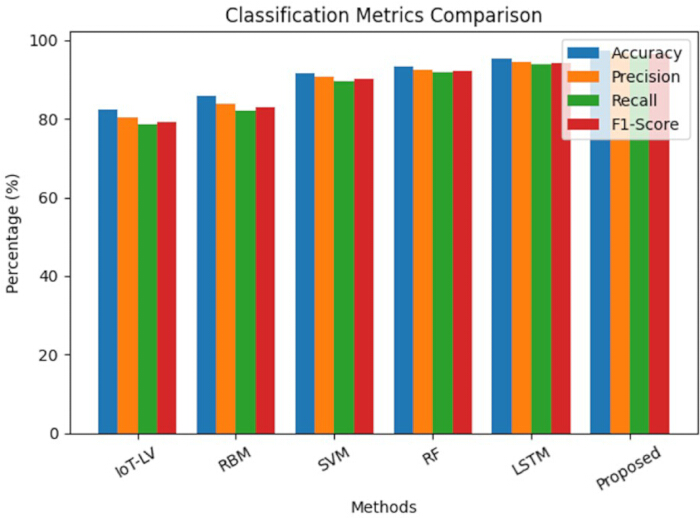
Figure 3: Comparison of classification performance metrics across different methods. Comparison of the classification performance of IoT-LV, RBM, Support Vector Machine (SVM), Random Forest (RF), Long Short-Term Memory (LSTM), and the proposed framework using the Open LV Network & Smart Meter dataset. Performance is evaluated using Accuracy, Precision, Recall, and F1-score. Results are presented as mean ± standard deviation (SD) from five independent experimental runs using a 70%/15%/15% training/validation/testing split. Error bars represent one standard deviation. Please click here to view a larger version of this figure.
6. Intelligent decision module
The Intelligent Decision Module was developed to automate low-voltage (LV) acceptance decisions using supervised machine learning models. Classification and regression algorithms were applied to the engineered feature vectors to support operational decision-making. Classification models identified normal and abnormal operating conditions, whereas regression models estimated future energy consumption and operational trends.
The input feature vector, X ∈ ℝd, comprised the statistical, voltage stability, load behavior, and power quality features extracted during the feature engineering stage. Standalone Support Vector Machine (SVM)44, Random Forest (RF)45, and Long Short-Term Memory (LSTM)46 models were implemented as baseline classifiers for comparative evaluation. The mathematical formulation of the learning models is provided in Supplementary File 1 (Section S5).
For classification, the output variable y ∈ {0,1} represented normal (0) and abnormal (1) operating conditions. When abnormal operating conditions or overload events were detected, the workflow generated a fault notification and flagged the acceptance process as invalid; otherwise, the process was classified as accepted.
The workflow orchestration engine integrated machine-learning predictions with rule-based validation, using a priority-based conflict-resolution strategy. Safety-critical operational rules and regulatory acceptance criteria were treated as hard constraints and therefore took precedence over machine-learning predictions when conflicts occurred. Final acceptance decisions were generated using the combined outputs of the rule-based validation and intelligent decision modules.
7. Cloud–edge integration and visualization dashboard
A cloud-edge computing architecture was implemented to support scalable data processing, storage, and visualization for the LV acceptance automation platform. Smart meters, SCADA systems, and IoT devices continuously collect electrical measurements, which are processed at the edge layer via filtering, normalization, feature extraction, and real-time inference to reduce communication overhead and enable low-latency decision-making. The mathematical derivations are provided in Supplementary File 1 (Section S6).
Processed data were transmitted to the cloud layer for long-term storage, advanced analytics, feature engineering, model training, and model management. Interactive dashboards provided real-time system monitoring, alerts, reporting, and operational decision support. The cloud-edge architecture is illustrated in Supplementary Figure 2, and the implementation details are summarized in Table 3.
| Layer | Component | Hardware / Software | Specification / Version | Purpose / Description |
| Edge Layer | Edge Device | Raspberry Pi 4 / NVIDIA Jetson Nano | Quad-core CPU, 4–8 GB RAM | Real-time data acquisition and local processing |
| IoT Gateway | Industrial IoT Gateway | MQTT / Modbus / OPC-UA support | Communication between sensors and edge/cloud | |
| Sensors / Smart Meters | Digital Smart Meters | Voltage, Current, Power Measurement | Data collection from LV network | |
| Edge Software | Python, EdgeX Foundry, MQTT Broker | Python 3.x | Data preprocessing, filtering, local inference | |
| Communication Protocols | Wi-Fi / PLC / RS-485 | Standard protocols | Data transmission to cloud layer | |
| Cloud Layer | Cloud Platform | AWS / Microsoft Azure / Google Cloud | Scalable cloud services | Data storage, analytics, and model training |
| Storage | AWS S3 / Azure Blob / InfluxDB | Time-series database | Storing historical and real-time data | |
| Compute & ML | Python, TensorFlow, PyTorch, Scikit-learn | ML libraries (latest versions) | Model training, evaluation, deployment | |
| Containerization | Docker, Kubernetes | Latest stable versions | Workflow orchestration and scalability | |
| Data Processing | Apache Spark / Pandas | Distributed processing | Large-scale data analytics | |
| Visualization Layer | Dashboard Tools | Grafana / Apache Superset / Plotly Dash | Web-based tools | Real-time monitoring and visualization |
| Web Framework | React.js / Angular / Flask / FastAPI | Modern web stack | UI development and API integration | |
| Notification System | Email / SMS Gateway / Push Notifications | Twilio / Firebase | Alert generation and communication | |
| API Services | REST APIs | JSON-based communication | Integration between modules |
Table 3: System implementation details. Summary of the hardware configuration, software environment, communication protocols, and cloud–edge computing components used for implementing the proposed LV acceptance automation platform.
Zugriff eingeschränkt. Bitte melden Sie sich an oder starten Sie eine Testversion, um diesen Inhalt anzuzeigen.
Ergebnisse
The performance of the proposed Low-Voltage (LV) Acceptance Automation Platform was evaluated using the Open LV Network & Smart Meter Dataset together with a synthetic smart meter dataset generated to represent additional operating conditions and fault scenarios. The synthetic dataset enabled controlled evaluation of workflow orchestration, intelligent decision-making, and fault detection under abnormal operating conditions. The Open LV Network & Smart Meter Dataset comprised household smart meter measurements, f...
Zugriff eingeschränkt. Bitte melden Sie sich an oder starten Sie eine Testversion, um diesen Inhalt anzuzeigen.
Diskussion
The experimental evaluation demonstrated that the proposed workflow-oriented Low-Voltage (LV) Acceptance Automation Platform consistently outperformed the benchmark approaches in classification, forecasting, fault detection, operational decision latency, and scalability. These performance improvements resulted from the integration of advanced feature engineering, workflow orchestration, cloud-edge collaboration, and hybrid rule-based and machine learning decision-making rather than from the use of a single machine learni...
Zugriff eingeschränkt. Bitte melden Sie sich an oder starten Sie eine Testversion, um diesen Inhalt anzuzeigen.
Offenlegungen
Die Autoren erklären, dass sie keine konkurrierenden finanziellen oder nichtfinanziellen Interessen haben.
Danksagungen
The authors thank the UK Power Networks Open Data Portal for providing the publicly available Open LV Network & Smart Meter dataset used in this study. This research received no external funding.
Zugriff eingeschränkt. Bitte melden Sie sich an oder starten Sie eine Testversion, um diesen Inhalt anzuzeigen.
Materialien
| Name | Unternehmen | Katalognummer | Kommentare |
|---|---|---|---|
| Apache Spark | Apache Software Foundation | Version 3.4+ | Analysen großer Datenmengen |
| Apache Superset | Apache Software Foundation | Version 3.x | Analyse-Dashboard |
| Docker Engine | Docker Inc. | Version 24.x | Anwendungsbereitstellung |
| Eclipse Mosquitto MQTT Broker | Eclipse Foundation | Version 2.x | Datenaustausch |
| EdgeX Foundry (Jakarta Release oder später) | LF Edge (Linux Foundation) | Version Jakarta / Geneva | Verwaltung von Edge-Geräten |
| Flask / FastAPI | Pallets Projects / Sebastián Ramírez | Flask 2.3+ / FastAPI 0.100+ | Backend-API-Integration |
| Grafana | Grafana Labs | Version 10.x | Visualisierung und Überwachung |
| Industrieller IoT-Gateway | Advantech / Siemens | ECU-1251 / SIMATIC IOT2040 | Sensor-zu-Cloud-Kommunikation |
| IoT-Sensoren (Spannungs-/Stromsensoren) | Texas Instruments / Analog Devices | INA219 / ACS712 | Echtzeit-Netzwerküberwachung |
| Jetson Nano Developer Kit | NVIDIA Corporation | 945-13450-0000-100 | Edge-AI-Inferenz |
| Kubernetes | Cloud Native Computing Foundation (CNCF) | Version 1.27+ | Skalierbarkeit von Workflows |
| LSTM-Modell (Keras/TensorFlow) | Google (TensorFlow/Keras) | Enthalten in TF 2.12+ | Lastprognose und -vorhersage |
| PLC-Modul (Power Line Communication) | STMicroelectronics | ST7580 | Kommunikation im intelligenten Stromnetz |
| Plotly Dash | Plotly Inc. | Version 2.x | Interaktive Visualisierung |
| Python 3.10 | Python Software Foundation | Version 3.10.x | Datenverarbeitung und -analyse |
| PyTorch | Meta AI | Version 2.0+ | Implementierung von Deep Learning |
| Zufallswald-Algorithmus | Scikit-learn | Enthalten in v1.3+ | Fehlerklassifizierung |
| Raspberry Pi 4 Modell B (4 GB RAM) | Raspberry Pi Foundation | RPI4-MODBP-4GB | Edge-Verarbeitung |
| React.js / Angular | Meta / Google | React 18.x / Angular 16+ | Benutzeroberflächenentwicklung |
| RS-485-Transceiver-Modul | Maxim Integrated (Analog Devices) | MAX485 | Verbindbarkeit industrieller Geräte |
| Scikit-learn | Scikit-learn-Entwickler | Version 1.3+ | Machine-Learning-Modelle |
| Support-Vektor-Maschine (SVM) | Scikit-learn | Enthalten in v1.3+ | Klassifizierung und Validierung |
| TensorFlow | Google LLC | Version 2.12+ | Modelltraining |
| Twilio / Firebase Cloud Messaging | Twilio Inc. / Google | Nicht zutreffend | Warnungen und Benachrichtigungen |
| WLAN-Modul | Espressif Systems | ESP8266 / ESP32 | Datenübertragung |
| XGBoost | DMLC (Distributed ML Community) | Version 1.7+ | Intelligente Entscheidungsunterstützung |
Referenzen
- Tong L, Zhou J, Li J. IoT-based low-voltage power distribution system management and control platform. Front Energy Res. 2022;10:902715. https://doi.org/10.3389/fenrg.2022.902715
- Babayigit B, Abubaker M. Industrial Internet of Things: A review of improvements over traditional SCADA systems for industrial automation. IEEE Syst J. 2023;18:120–133.
- Nakagawa EY, et al. Industry 4.0 reference architectures: State of the art and future trends. Comput Ind Eng. 2021;156:107241. https://doi.org/10.1016/j.cie.2021.107241
- Ladegourdie M, Kua J. Performance analysis of OPC UA for industrial interoperability towards Industry 4.0. Internet Things. 2022;3:507–525.
- Bader SR, Maleshkova M, Lohmann S. Structuring reference architectures for the industrial Internet of Things. Future Internet. 2019;11:151. https://doi.org/10.3390/fi11070151
- Fun TS, Samsudin A. Recent technologies, security countermeasure and ongoing challenges of industrial Internet of Things (IIoT): A survey. Sensors (Basel). 2021;21:6647. https://doi.org/10.3390/s21196647
- Mirani AA, et al. Key challenges and emerging technologies in industrial IoT architectures: A review. Sensors (Basel). 2022;22:5836. https://doi.org/10.3390/s22155836
- Fraile F, et al. Reference models for digital manufacturing platforms. Appl Sci. 2019;9:4433. https://doi.org/10.3390/app9204433
- Serôdio C, et al. Software and architecture orchestration for process control in Industry 4.0 enabled by cyber-physical systems technologies. Appl Sci. 2024;14:2160. https://doi.org/10.3390/app14052160
- Ungurean I, Gaitan NC. A software architecture for the industrial Internet of Things—A conceptual model. Sensors (Basel). 2020;20:5603. https://doi.org/10.3390/s20195603
- Hsiao CH, Lee WP. OPIIoT: Design and implementation of an open communication protocol platform for industrial Internet of Things. Internet Things. 2021;16:100441. https://doi.org/10.1016/j.iot.2021.100441
- Domínguez-Bolaño T, et al. An overview of IoT architectures, technologies, and existing open-source projects. Internet Things. 2022;20:100626. https://doi.org/10.1016/j.iot.2022.100626
- Sasiain J, et al. Towards flexible integration of 5G and IIoT technologies in Industry 4.0: A practical use case. Appl Sci. 2020;10:7670. https://doi.org/10.3390/app10217670
- Cañas H, et al. A conceptual framework for smart production planning and control in Industry 4.0. Comput Ind Eng. 2022;173:108659. https://doi.org/10.1016/j.cie.2022.108659
- Cabrini FH, et al. Enabling the industrial Internet of Things to cloud continuum in a real city environment. Sensors (Basel). 2021;21:7707. https://doi.org/10.3390/s21227707
- Gabriel MF, et al. Implementation of an IoT architecture for promoting healthy air quality in 84 homes of families with children. Build Environ. 2024;266:112040. https://doi.org/10.1016/j.buildenv.2024.112040
- Silva BN, Khan M, Han K. Internet of Things: A comprehensive review of enabling technologies, architecture, and challenges. IETE Tech Rev. 2018;35:205–220.
- Dhaou ISB, et al. Internet of Things technologies for smart grid. In: Research Anthology on Smart Grid and Microgrid Development. IGI Global; Hershey; 2022. p. 805–832.
- Kondoro A, et al. A low latency secure communication architecture for microgrid control. Energies. 2021;14:6262. https://doi.org/10.3390/en14196262
- Tightiz L, Yang H. A comprehensive review on IoT protocols' features in smart grid communication. Energies. 2020;13:2762. https://doi.org/10.3390/en13112762
- Kondoro A, et al. Real-time performance analysis of secure IoT protocols for microgrid communication. Future Gener Comput Syst. 2021;116:1–12.
- Rodrigues R, et al. A review of solid-state circuit breakers. IEEE Trans Power Electron. 2020;36:364–377.
- IEEE. IEEE Std 1159-2019: IEEE recommended practice for monitoring electric power quality. IEEE; Piscataway (NJ); 2019. https://doi.org/10.1109/IEEESTD.2019.8800097
- Otcenasova A, et al. The influence of power quality indices on active power losses in a local distribution grid. Energies. 2019;12:1389. https://doi.org/10.3390/en12071389
- Ma K, et al. Review of distribution network phase unbalance: Scale, causes, consequences, solutions, and future research direction. CSEE J Power Energy Syst. 2020;6:479–488.
- Peppanen J, et al. Modeling power electronic equipment to improve distribution feeder current and voltage balance [Presentation]. Presented at: IEEE PES Transmission and Distribution Conference and Exposition (T&D); Denver, CO; 2018. Available from: https://ieeexplore.ieee.org/ https://doi.org/10.1109/TDC.2018.8440261
- Sayed S, et al. Design and realization of an open-source and modular smart meter. Energy Sci Eng. 2019;7:1405–1422.
- Satapathy LM, et al. Arduino based home automation using Internet of Things (IoT). Int J Pure Appl Math. 2018;118:769–778.
- Shaban M, et al. Design of a partially grid-connected photovoltaic microgrid using IoT technology. Appl Sci. 2021;11:11651. https://doi.org/10.3390/app112411651
- Shaban M, Dhaou IB. Design of an IoT-enabled microgrid architecture for a partial grid-connected mode [Presentation]. Presented at: 18th International Multi-Conference on Systems, Signals and Devices (SSD); Virtual; 2021. Available from: https://ieeexplore.ieee.org/ https://doi.org/10.1109/SSD52085.2021.9429443
- Taye BZ, et al. Rural electrification planning using geographic information system (GIS). Cogent Eng. 2020;7:1836730. https://doi.org/10.1080/23311916.2020.1836730
- Huld T, et al. Geospatial analysis of photovoltaic mini-grid system performance. Energies. 2017;10:218. https://doi.org/10.3390/en10020218
- Domínguez J, et al. IntiGIS-Local: A geospatial approach to assessing rural electrification alternatives for sustainable socio-economic development in isolated communities—A case study of Guasasa, Cuba. Energies. 2024;17:3835. https://doi.org/10.3390/en17153835
- Tafula JE, et al. Multicriteria decision-making approach for optimum site selection for off-grid solar photovoltaic microgrids in Mozambique. Energies. 2023;16:2894. https://doi.org/10.3390/en16062894
- Isihak S, et al. Evolution of GIS-based rural electrification planning models and an application of OnSSET in Nigeria. Renew Sustain Energy Transit. 2022;2:100019. https://doi.org/10.1016/j.rset.2022.100019
- Korkovelos A, et al. The role of open access data in geospatial electrification planning and the achievement of SDG7: An OnSSET-based case study for Malawi. Energies. 2019;12:1395. https://doi.org/10.3390/en12071395
- Cicilio P, et al. uGrid: Reliable minigrid design and planning toolset for rural electrification. IEEE Access. 2019;7:163988–163999.
- Nasir M, et al. Optimal planning and design of low-voltage low-power solar DC microgrids. IEEE Trans Power Syst. 2018;33:2919–2928.
- Vai V, et al. Optimal low-voltage distribution topology with integration of PV and storage for rural electrification in developing countries: A case study of Cambodia. J Mod Power Syst Clean Energy. 2020;8:531–539.
- Banad Y, Sharif S, Rezaei Z. Artificial intelligence and machine learning for smart grids: from foundational paradigms to emerging technologies with digital twin and large language model-driven intelligence. Energy Convers Manag X. 2025;28:101329. https://doi.org/10.1016/j.ecmx.2025.101329
- Álvarez-López C, González-Briones A, Li T. Explainable AI and multi-agent systems for energy management in IoT-edge environments: a state-of-the-art review. Electronics. 2026;15(2):385. https://doi.org/10.3390/electronics15020385
- UK Power Networks. Open data portal [Online]. Available from: https://www.ukpowernetworks.co.uk/our-company/open-data-portal (Accessed June 2026).
- Jolliffe IT. Principal Component Analysis. 2nd ed. Springer; New York; 2002. https://doi.org/10.1007/b98835
- Cortes C, Vapnik V. Support-vector networks. Mach Learn. 1995;20:273–297.
- Breiman L. Random forests. Mach Learn. 2001;45:5–32.
- Hochreiter S, Schmidhuber J. Long short-term memory. Neural Comput. 1997;9:1735–1780.
- Fawcett T. An introduction to ROC analysis. Pattern Recognit Lett. 2006;27:861–874.
- Montgomery DC, Runger GC. Applied Statistics and Probability for Engineers. 8th ed. John Wiley & Sons; Hoboken (NJ); 2020.
- Montgomery DC. Design and Analysis of Experiments. 10th ed. John Wiley & Sons; Hoboken (NJ); 2020.
Zugriff eingeschränkt. Bitte melden Sie sich an oder starten Sie eine Testversion, um diesen Inhalt anzuzeigen.