Diese Studie stellt einen reproduzierbaren Arbeitsablauf zur Optimierung immersiver Ausstellungsanordnungen durch die Kombination adaptiver simulierter Abkühlung, phasenabhängiger Vorschlagsauswahl und Heizkontrolle vor. Die ausgewählte Anordnung wurde in einer Virtual-Reality-Ausstellungsumgebung implementiert und anhand von räumlichen Kostenmetriken, Verhaltensprotokollen der Teilnehmer und Bewertungen nach der Erfahrung evaluiert.
Forschungsartikel
Optimierung des Designs immersiver Ausstellungsräume mittels adaptiver Simulated-Annealing-Verfahren mit Reheating und Virtual-Reality-Evaluierung
In diesem Artikel
Zusammenfassung
Zusammenfassung
Immersive Ausstellungsräume erfordern Layouts, die einen effizienten Durchfluss, eine klare Orientierung, ein ausgewogenes Interaktionsverhalten und ein komfortables Umwelterlebnis unterstützen. Allerdings werden Ausstellungspläne häufig durch manuelle Gestaltungsentscheidungen entwickelt, wodurch es schwierig ist, gleichzeitig Weglänge, visuelle Zugänglichkeit, Überfüllungsrisiko, Umgebungskomfort und Verteilung der Interaktionsknoten zu bewerten. Diese Studie entwickelte und evaluierte einen Workflow zur Optimierung der Raumgestaltung basierend auf adaptivem simuliertem Annealing mit stufenabhängiger Vorschlagsauswahl und Reheating-Steuerung. Eine 36 m × 24 m große immersive Ausstellungshalle wurde mit sechs thematischen Zonen, Übergangskorridoren, einem Ruhebereich und mehreren Interaktionsknoten konstruiert. Drei Layout-Bedingungen wurden verglichen: manuelles Layout, Standard-simuliertes-Annealing-Layout und adaptives simuliertes Annealing-Layout mit Reheating. Das Optimierungsmodell minimierte eine gewichtete räumliche Kostenfunktion, die Gehwegstrecke, visuelle Zugänglichkeit, Überfüllung, Umgebungskomfort und Interaktionsausgleich berücksichtigte. Die ausgewählten Layouts wurden in virtuellen Ausstellungsszenen implementiert und anhand von Verhaltensprotokollen der Teilnehmer sowie Bewertungen nach der Erfahrung evaluiert. Der adaptive Algorithmus erzielte geringere finale räumliche Kosten, einen höheren Verbesserungsprozentsatz und benötigte weniger Iterationen bis zur besten Lösung als das Standard-simulierte Annealing, bei einem moderaten Anstieg der Rechenzeit. Teilnehmer, denen das adaptive Layout zugewiesen wurde, berichteten von höherer Zufriedenheit, stärkerem Präsenzgefühl, klarerer Orientierung, geringerer wahrgenommener Überfüllung und geringerer kognitiver Belastung; außerdem absolvierten sie die Route mit kürzerer Gehstrecke, weniger Zögern, längeren Verweildauern und breiterer Heatmap-Abdeckung. Diese Ergebnisse unterstützen den Workflow als Entscheidungshilfe für das getestete Ausstellungsszenario; sie stellen jedoch kein universell optimales Ausstellungsdesign oder eine Überlegenheit gegenüber allen alternativen Metaheuristiken sicher.
Einleitung
Immersive Ausstellungsräume kombinieren zunehmend Raumgestaltung, digitale Medien, interaktive Displays und Virtual-Reality-Technologien, um Umgebungen zu schaffen, in denen Besucher die Inhalte nicht nur beobachten, sondern sich durch die Ausstellung bewegen, darauf reagieren und sie als räumliche Erfahrung interpretieren. In solchen Umgebungen hängt die Qualität der Erfahrung nicht nur von der Vielfalt visueller oder interaktiver Inhalte ab, sondern auch von der Kontinuität des Wegverlaufs, der Sichtverhältnisse, der Besucherfrequenz, dem Umgebungskomfort und der Verteilung von Interaktionsmöglichkeiten. Die Gestaltung von Ausstellungsräumen stellt daher ein mehrdimensionales Problem dar: Ein Grundriss muss Besucher effizient führen, gleichzeitig aber die narrative Abfolge, die Wahrnehmungsoffenheit und Möglichkeiten zur aktiven Auseinandersetzung bewahren. Untersuchungen zum Verhalten in Museen und Ausstellungen haben seit langem gezeigt, dass die Besuchererfahrung durch die räumliche Organisation, die Struktur der Verkehrswege und die interpretative Zugänglichkeit geprägt wird – und nicht allein durch die Inhalte der Exponate1.
Die Theorie der räumlichen Konfiguration bietet eine nützliche Grundlage dafür, die Gestaltung von Ausstellungsanordnungen als analysierbares Gestaltungsproblem zu betrachten. Aus dieser Perspektive ist der Raum kein passiver Behälter für Objekte; vielmehr strukturiert er Bewegung, Begegnungen, Sichtbarkeit und Entscheidungen. Die architektonische Konfiguration kann beeinflussen, wie sich Personen durch eine Umgebung bewegen, und wie leicht sie die Beziehungen zwischen den Räumen erfassen2. Die auf Sichtbarkeit basierende räumliche Analyse untermauert diese Sichtweise weiter, indem sie zeigt, dass Sichtfelder und Sichtlinienbeziehungen als messbare Merkmale der räumlichen Wahrnehmung und Orientierung modelliert werden können3. Diese Konzepte sind besonders relevant für immersive Ausstellungen, da Besucher während ihres Weges durch die Ausstellung kontinuierlich visuelle Informationen, Routenentscheidungen, Interaktionshinweise und Umweltreize integrieren müssen.
Gleichzeitig haben immersive Technologien die Möglichkeiten erweitert, wie Ausstellungsumgebungen vor der physischen Umsetzung entworfen und getestet werden können. Virtuelle und immersive Schnittstellen ermöglichen es Forschern und Gestaltern, zu untersuchen, wie Nutzer unter kontrollierten räumlichen Bedingungen wahrnehmen und sich verhalten, wodurch der Vergleich alternativer Layouts bei konstant gehaltenem Inhalt und konstanten Umgebungsbedingungen ermöglicht wird4. Übersichtsarbeiten zu Anwendungen der immersiven Virtual-Reality zeigen, dass räumliche Struktur, Interaktionsgestaltung und Aufgabenklarheit wichtige Bestimmungsfaktoren für das Nutzerengagement und die Lernqualität sind5. Metaanalytische Befunde deuten außerdem darauf hin, dass Grad und Art der Immersion das Gefühl der Präsenz beeinflussen können, allein die Immersion jedoch keine besseren Ergebnisse garantiert, wenn die Umgebung schlecht organisiert oder schwer zu navigieren ist6.
Die Nutzererfahrung einer immersiven Ausstellung hängt eng mit Präsenz, kognitiver Belastung und körperlichem Komfort zusammen. Präsenz spiegelt das Ausmaß wider, in dem Nutzer das Gefühl haben, sich in einer vermittelten Umgebung aufzuhalten, und stellt damit ein zentrales Ergebnis in virtuellen und immersiven Umgebungen dar7. Allerdings können immersive Umgebungen auch kognitive Belastungen verursachen, wenn Navigation, Interaktion oder sensorische Informationen nicht gut koordiniert sind8. Aus diesem Grund sollte die Optimierung von Ausstellungsräumen nicht nur die Interaktionsdichte oder visuelle Reizung erhöhen. Vielmehr sollte sie ein kohärentes räumliches Erlebnis unterstützen, unnötige Routenentscheidungen reduzieren und vermeidbare Ermüdung minimieren. Auch Simulatorkrankheit muss überwacht werden, da Unwohlsein sowohl die Sicherheit der Virtual-Reality-Exposition als auch die Interpretation von Nutzererfahrungsresultaten beeinträchtigen kann9.
Trotz dieser Anforderungen werden viele Ausstellungslayouts weiterhin anhand der Erfahrung von Gestaltern, durch iterative manuelle Anpassungen oder mittels nachträglicher Beobachtung der Besucher entwickelt. Diese Ansätze sind nach wie vor wertvoll, erschweren jedoch die gleichzeitige Bewertung mehrerer Layout-Randbedingungen. Die räumliche Gestaltung für immersive Ausstellungen kann als ein beschränktes Optimierungsproblem formuliert werden, das Weglänge, Sichtbarkeit, Überfüllung, Komfort und Verteilung der Interaktionen gemeinsam berücksichtigt. Die simulierte Abkühlung eignet sich für diese Art von Problem, da sie große, unregelmäßige Lösungsräume durchsuchen kann und gleichzeitig die kontrollierte Akzeptanz nicht verbessernder Zwischenlösungen erlaubt, wodurch das Entkommen aus lokalen Optima erleichtert wird10. Ihre Akzeptanzlogik folgt der Metropolis-Regel11, während der allgemeinere Metropolis-Hastings-Ansatz ein Verhältnis aus Vorwärts- zu Rückwärts-Vorschlagsdichte einführt, wenn der Vorschlagskern asymmetrisch ist12. In der vorliegenden Implementierung sind die vier bedingten Vorschlagskerne symmetrisch; daher zeigt die formale Herleitung, dass das Hastings-Verhältnis für reversible zulässige Schritte gleich eins ist. Das Verfahren wird folglich als adaptive simulierte Abkühlung mit Metropolis-Akzeptanz und erneuter Erwärmung beschrieben und nicht als separater Metropolis-Hastings-Sampler.
Adaptive Varianten der simulierten Abkühlung setzen seit Langem auf nichtuniforme Nachbarschaftsauswahl, Modifikationen des Abkühlplans, Wiedererwärmung, Restart-Strategien und hybride Suchkomponenten13,14. Die vorliegende Implementierung sollte daher als anwendungsspezifische Konfiguration und nicht als neues primitives Metaheuristik-Verfahren verstanden werden. Ihr Beitrag besteht in der expliziten Kopplung eines stufenabhängigen Vier-Bewegungs-Vorschlagsplans und der Wiedererwärmung mit ausstellungsspezifischen Zulässigkeitsbedingungen, einer transparenten mehrkomponentigen räumlichen Kostenfunktion sowie einer validierten virtuellen Realität auf Teilebene15. Diese engere Ausrichtung unterscheidet den vorliegenden Workflow direkt von Behauptungen über ein grundlegend neues Optimierungsprinzip. Die stufenabhängige Auswahl der Vorschläge sollte die Suche von einer umfassenderen Erkundung von Sequenzen bzw. Wegen hin zu einer lokalen räumlichen Feinabstimmung verlagern, während die Wiedererwärmung die Suchbeweglichkeit nach einer Stagnation wiederherstellte. Von diesem Gleichgewicht zwischen Erkundung und Ausnutzung wurde erwartet, dass es eine vorzeitige Fixierung in lokalen Minima verringert und die Wahrscheinlichkeit erhöht, innerhalb desselben nominalen Iterationsbudgets eine zulässige Anordnung mit niedrigeren Kosten zu erreichen.
Diese Studie schlägt einen reproduzierbaren Arbeitsablauf vor, der adaptives simuliertes Annealing, phasenabhängige Vorschlagsauswahl, Reheating-Steuerung, ein mehrkomponentiges räumliches Kostenmodell und eine nutzerindividuelle Bewertung in der virtuellen Realität integriert. Der methodische Beitrag ist anwendungsorientiert und auf Reproduzierbarkeit ausgerichtet, statt einen grundsätzlich neuen Optimierungsansatz zu beanspruchen16. Die Methode vergleicht ein manuelles Layout, ein Standard-Layout mittels simuliertem Annealing und ein adaptives Layout mittels simuliertem Annealing mit Reheating in einer kontrollierten Ausstellungsumgebung in der virtuellen Realität. Die Studie untersucht sowohl algorithmische als auch nutzerindividuelle Ergebnisse, darunter endgültige räumliche Kosten, Verbesserungsprozent, Präsenzempfinden, Klarheit der Orientierung, Zufriedenheit, kognitive Belastung, Gehstrecke, Anzahl von Zögern, Verweildauer und Heatmap-Abdeckung. Die primäre Hypothese lautete, dass die adaptive Methode niedrigere endgültige räumliche Kosten erreichen würde als das standardmäßige simulierte Annealing; auf der Ebene der Teilnehmenden wurde erwartet, dass das entsprechende Layout die Gesamtzufriedenheit und die Effizienz der Wegführung im Vergleich zu den manuellen und standardmäßigen Layouts mittels simuliertem Annealing verbessert. Dieser Ansatz folgt der allgemeineren Logik von metaheuristischen Entwurfsmethoden, bei denen die computergestützte Suche das menschliche Gestaltungsurteil unterstützt, statt es zu ersetzen17.
Protokoll
The study protocol was reviewed by Henan Agricultural University and was determined to be exempt from formal ethics review on December 20, 2025. No separate ethics approval or exemption reference number was issued by the reviewing body. Written informed consent was obtained from all participants before enrollment.
Participant preparation
Adult participants aged 18–60 years with normal or corrected-to-normal vision were recruited. Participants who reported severe vestibular disorders, uncontrolled epilepsy, severe visual impairment, recent major surgery, or previous serious discomfort during virtual-reality exposure were excluded. Each participant completed a screening form before the experiment. Age group, gender, education level, prior virtual-reality experience, and prior museum or exhibition-visiting frequency were recorded as control variables.
Participants were assigned to one of three layout conditions using a computer-generated randomization list: manual layout, standard simulated annealing layout, or adaptive simulated annealing with reheating layout. A between-subject design was used to avoid learning effects across layouts. The allocation ratio was set to 1:1:1, with 60 participants assigned to each condition and 180 participants in total. Age group, gender, education level, previous virtual-reality experience, and museum/exhibition-visiting frequency were recorded before allocation for descriptive assessment of participant characteristics; these variables were not used as post-randomization exclusion criteria.
Exhibition-space model preparation
A rectangular immersive exhibition hall measuring 36 m x 24 m with a ceiling height of 4.5 m was constructed. The total usable floor area was set to 864 m2. One entrance and one exit were placed on opposite short sides of the hall. Both the entrance and exit widths were set to 3.0 m and were kept fixed across all layout conditions.
The exhibition hall was divided into six thematic exhibition zones, two transition corridors, one rest area, and one main visitor route. The allowable area for each thematic zone was set to 80–130 m2, and the rest-area allocation was set to 40 m2. The allowable main-pathway width was set to 1.8–3.5 m. Eight to twelve interaction nodes were placed in each layout. Each interaction node was defined as a point where participants could stop, activate digital content, view an exhibit, or change direction.
The floor plan was discretized into 0.5 m x 0.5 m grid cells. The grid was used for visibility analysis, route-continuity checking, heatmap coverage calculation, and local density estimation. Each thematic zone was represented by its center coordinate, boundary polygon, area, and route-sequence position. Each interaction node was represented by its coordinate, associated zone, trigger radius, and clearance area.
Spatial configuration was treated as the core design variable because exhibition layout, visibility, and route structure affect visitor movement, wayfinding, and spatial cognition18. The complete workflow, from spatial model construction to layout optimization, virtual-scene implementation, participant testing, and statistical analysis, is shown in Figure 1.
Layout parameters and feasibility constraints
The same feasibility constraints were applied to all layout conditions. First, all thematic zones were required to remain inside the 36 m x 24 m boundary. Second, thematic zones were not allowed to overlap. Third, the main visitor route was required to connect the entrance, six thematic zones, a rest area, and the exit without interruption. Fourth, interaction nodes were not allowed to block the main path. Fifth, each interaction node was required to retain a clearance radius of at least 1.2 m. Sixth, the predicted local density on the main route was required to be no more than 1.50 persons/m2. Seventh, the final route was required to contain no dead ends or disconnected subpaths.
The same scene scale, route rules, environmental targets, and interaction settings were used across the three layout conditions. Before the optimization algorithms were run, the hall dimensions, functional-zone parameters, pathway-width range, interaction-node settings, feasibility thresholds, virtual-reality settings, objective-function weights, algorithm parameters, and outcome definitions were recorded. These parameters defined the reproducible boundary of the protocol and are summarized in Table 1.
Spatial-cost function
Each candidate layout was evaluated using the weighted spatial-cost function:

where F(x) is the total spatial cost of layout x. Cdistance(x) is the walking-distance cost, Cvisibility(x) is the visual-accessibility cost, Ccrowding(x) is the crowding cost, Ccomfort(x) is the environmental-comfort penalty, and Cinteraction(x) is the interaction-balance penalty. A lower F(x) indicates a more favorable layout.
The walking-distance cost was calculated as:

where Lx is the total route length of layout x in meters. A reference maximum route length of 120 m was used.
The visual-accessibility cost was calculated as:
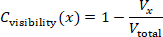
where Vx is the thematic-zone frontage visible from the main route, and Vtotal is the total frontage length of all thematic zones. Line-of-sight rays were emitted every 0.5 m along the visitor route. Exhibition partitions, walls, and zone boundaries were treated as occluding objects.
The crowding cost was calculated as:
Ccrowding(x) = min(Dmax / 1.50, 1)
where Dmax is the maximum predicted local density in persons/m2. An upper density threshold of 1.50 persons/m2 was used for the main route.
The environmental-comfort penalty was calculated as:

The illuminance penalty was set as:
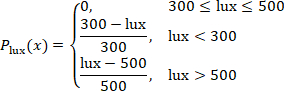
The sound-pressure penalty was set as:
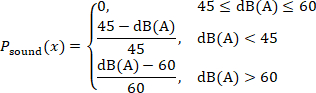
The carbon dioxide penalty was set as:

The temperature penalty was set as:
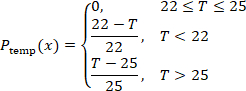
The interaction-balance penalty was calculated as:

where sk is the route distance between two adjacent interaction nodes. A lower value indicates a more even distribution of interaction opportunities along the visitor route.
Environmental comfort is included because lighting, sound, air quality, and temperature influence fatigue, comfort, and willingness to remain in exhibition environments19. The environmental ranges are protocol control targets rather than universal regulatory limits. The 300–500 lx illuminance band is consistent with current Chinese building and museum-lighting guidance; the carbon-dioxide target of <900 ppm is deliberately more conservative than the 1,000 ppm daily-average limit in GB/T 18883-202220,21; the 22–25 °C temperature band is within commonly accepted thermal-comfort conditions for lightly active occupants22; and 45–60 dB(A) is used as a controlled ambient-sound band rather than as a statutory indoor-noise limit23,24.
The objective-function weights were selected as explicit, scenario-specific design priorities rather than as universal coefficients or preference estimates fitted from participant outcomes. Walking distance and crowding each received a weight of 0.25 because route efficiency and congestion control were treated as the two primary operational constraints; visual accessibility received 0.20 because visibility affects orientation and exhibits exposure; environmental comfort and interaction each received 0.15 so that these factors influence the search without dominating circulation-related terms. Because exhibition priorities can differ by context, the protocol tests local weight robustness by perturbing each weight by ±10% individually and proportionally renormalizing the remaining weights so that the total remains 1.00. The resulting coefficients should therefore be interpreted as protocol-specific design settings that can be recalibrated for artistic, historical, scientific, or commercial exhibitions.
Manual layout generation
The manual layout was created as the baseline condition. The six thematic zones were arranged in a conventional narrative sequence from entrance to exit. The rest area was placed near the middle section of the route. The initial main-pathway width was set to 2.2 m. Interaction nodes were placed near the entrance of each thematic zone and at major route-turning points. The manual layout was checked against all feasibility constraints. Zone boundaries were adjusted only when a constraint was violated. After the layout became feasible, total route length, visible frontage ratio, maximum local density, environmental-comfort penalty, interaction-spacing coefficient, and total spatial cost were recorded.
Standard simulated annealing
The feasible manual layout was used as the initial state. The initial temperature was set to 100, the cooling coefficient to 0.95, the maximum number of iterations to 1,500, and the stagnation threshold to 200 iterations. The algorithm was run with 30 independent random seeds. These values were operational protocol settings used to define a matched computational budget; they were not presented as literature-derived universal constants or outcome-tuned optima. T₀ = 100 permitted broad early exploration, α = 0.95 provided gradual cooling, 1,500 iterations provided each run with the same upper search budget, and the 200-iteration stagnation threshold prevented prolonged continuation after no improvement. The same temperature and maximum-iteration settings were used for the adaptive method so that differences were attributable to proposal scheduling and reheating rather than to a larger nominal search budget.
At each iteration, one neighboring layout was generated by applying one move: moving one thematic zone by 0.5–2.0 m, swapping the sequence positions of two thematic zones, adjusting one pathway segment by 0.1–0.3 m, or moving one interaction node by 0.5–1.5 m. A proposed layout was rejected immediately if it violated any feasibility constraint.
If the proposed layout was feasible and had a lower spatial cost, it was accepted. If it had a higher spatial cost, it was accepted according to the probability equation:
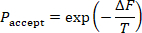
where ΔF is the increase in spatial cost, and T is the current temperature. The temperature after each iteration was updated using:
Tnew = 0.95Told
Each run was stopped when the maximum iteration count was reached or when the best spatial cost did not improve for 200 consecutive iterations. Simulated annealing was considered suitable for this task because exhibition layout optimization is a combinatorial spatial problem that cannot be solved efficiently by exhaustive search.
Standard simulated annealing was used as the primary numerical algorithmic benchmark because it shared the same layout encoding, feasibility rules, objective function, initialization, temperature schedule, and computational budget as the adaptive condition. Standard simulated annealing was the sole numerical metaheuristic comparator in this study and therefore functioned as a matched ablation-like baseline for the added proposal scheduling and reheating at the workflow level. Genetic algorithms, particle swarm optimization, ant colony optimization, and learning-based optimizers were not part of the experiment; accordingly, performance claims were restricted to the matched standard-SA baseline. For each run, the random seed, initial spatial cost, final spatial cost, improvement percentage, number of iterations to the best solution, runtime, acceptance rate, and feasibility status were stored. Improvement percentage was calculated using the equation:

Adaptive simulated annealing with reheating
The same initial layout, feasibility constraints, initial temperature, cooling coefficient, maximum iteration count, and 30 random seeds as the standard simulated annealing condition were used. The adaptive algorithm differed only in its stage-dependent move-class probabilities and reheating rule, while retaining the standard Metropolis acceptance rule for feasible candidate layouts. Four proposal move classes were defined: local displacement (L), zone-sequence swap (S), pathway-width adjustment (W), and interaction-node relocation (N). During the first 40% of iterations, the move-class probabilities were set to pL = 0.20, pS = 0.35, pW = 0.30, and pN = 0.15. During the final 60%, they were set to pL = 0.35, pS = 0.15, pW = 0.20, and pN = 0.30. This change in move-class frequency shifted the search from broader sequence/pathway exploration toward local spatial refinement and adjustment of interaction nodes.
At iteration t, the full proposal density was expressed as q(x′|x,t) = pm(t)qm(x′|x), where m ∈ {L,S,W,N} represented the selected move class and pm(t) represented its phase-specific probability. For local displacement, one of six thematic zones was selected uniformly, a displacement direction was drawn uniformly on [0,2π), and a displacement magnitude was drawn uniformly on [0.5,2.0] m; therefore, qL was proportional to (1/6)(1/2π)(1/1.5). For a zone-sequence swap, one of the 15 unordered zone pairs was selected uniformly, giving qS = 1/15. For pathway-width adjustment, one of J adjustable pathway segments was selected uniformly, and a signed change was drawn uniformly from [−0.3,−0.1] ∪ [0.1,0.3] m, giving qW = (1/J)(1/0.4). For interaction-node relocation, one of K current interaction nodes was selected uniformly, a direction was drawn uniformly on [0,2π), and a displacement magnitude was drawn uniformly on [0.5,1.5] m, giving qN proportional to (1/K)(1/2π)(1/1.0). Constraint-violating proposals were rejected and contributed a self-transition.

For every reversible feasible move in this implementation, the conditional proposal kernel was symmetric: qm(x′|x) = qm(x|x′). Because the same phase-specific move-class probability pm(t) was applied to the forward and reverse transition at a given iteration, q(x|x′,t)/q(x′|x,t) = 1. The acceptance probability, therefore, is reduced to the standard simulated-annealing Metropolis rule, A(x→x′) = min{1, exp[−(C(x′)−C(x))/T]}. No non-trivial Hastings correction was applied; the method is therefore termed adaptive simulated annealing with reheating rather than a Metropolis-Hastings sampler25.
Reheating was applied when the best spatial cost did not improve for 150 consecutive iterations, thereby intentionally intervening before the 200-iteration stagnation stop used in standard simulated annealing. The current temperature was increased by 10%, and up to 3 reheating events were allowed per run. The same algorithm-performance variables as in the standard simulated annealing condition were stored. The experiment evaluated the combined stage-dependent proposal schedule plus reheating configuration and therefore did not estimate the independent causal contribution of each component. Stepwise pseudocode for the exact proposal, feasibility, Metropolis acceptance, temperature update, reheating, and output storage sequence was provided in Supplementary File 3.
Treheated = 1.10Tcurrent
Final layouts
One final layout was selected for each condition. The feasible manual layout was used for the manual condition. Under the standard simulated annealing conditions, the run with the lowest final spatial cost among the 30 runs was selected. For the adaptive simulated annealing with reheating condition, the feasible run with the lowest final spatial cost among the 30 runs was selected. Before the selected layouts were exported, a final feasibility check confirmed that all zones were inside the boundary, no zones overlapped, the route was continuous, the entrance and exit were unchanged, interaction-node clearance was at least 1.2 m, maximum density remained below 1.50 persons/m2, and all thematic zones were reachable from the main route.
Virtual exhibition scenes
Three virtual exhibition scenes were built in Unity 2022.3.22f1 LTS (Unity Technologies) using XR Interaction Toolkit 2.5.4. The scenes were presented through a Meta Quest 2 head-mounted display (Meta Platforms) using six-degree-of-freedom head and controller tracking. Exhibition content, visual style, object models, signage style, lighting assets, ambient sound, interaction mechanism, and navigation instructions were kept identical across the three scenes. Only spatial arrangement, route sequence, pathway width, and interaction-node placement varied.
The virtual camera height was set to 1.65 m, and the walking speed was set to 1.2 m/s. Teleportation was disabled. The same starting trigger at the entrance and the same completion trigger at the exit were used. The interaction-node trigger radius was set to 1.0 m. Whether each interaction node was visited was recorded.
The same six thematic contents were used in all scenes. Each theme was assigned to its corresponding zone, regardless of layout conditions. Wall height, partition style, media display size, text density, and exhibit object scale were kept constant. Virtual-reality environments were considered appropriate for this protocol because they enabled the examination of spatial presence, route clarity, and visitor experience under controlled layout conditions26.
The hardware, software, environmental-monitoring tools, questionnaire/codebook files, and analysis resources required to reproduce the protocol were listed in the Table of Materials and organized as Supplementary Files 1–3. Research resources with registered Research Resource Identifiers (RRIDs) were listed by RRID in the Table of Materials.
Participant session
One participant was tested at a time. The participant sat for 2 min before the session. The head-mounted display was fitted, and the interpupillary distance was adjusted according to the participant's comfort. A 2 min practice scene that was not part of the exhibition was provided. The practice scene was used only to familiarize the participant with movement and interaction.
Because one participant was tested at a time, crowding in the protocol was represented by model-based density estimates rather than emergent simultaneous group movement. Multi-user co-presence, interpersonal avoidance, and dynamic crowd interactions were therefore not directly simulated and were considered when interpreting crowd-related outcomes.
After practice, the assigned exhibition scene was started. The participant was instructed to enter the exhibition, follow the route naturally, interact with marked nodes, and exit after completing all six thematic zones. Additional route guidance was provided only if the participant could not proceed for more than 30 s. Completion time, dwell time, walking distance, hesitation count, interaction-node visits, and trajectory coordinates were recorded automatically.
The session ended when the participant reached the exit trigger. The head-mounted display was removed, and the participant was allowed to rest for 3 min. The participant completed the post-experience questionnaire immediately after the rest period.
Behavioral, environmental, and questionnaire outcomes
Completion time was defined as the time from entrance-trigger activation to exit-trigger activation. Dwell time was defined as the total time spent inside thematic zones and interaction-node areas. Walking distance was defined as cumulative path length from trajectory coordinates. Hesitation count was defined as the number of pauses longer than 3 s outside interaction-node areas. Heatmap coverage was calculated using:

Average illuminance was recorded using a Testo 540 illuminance meter (Testo SE & Co. KGaA), sound pressure level using a Testo 816-1 Class 2 sound level meter (Testo SE & Co. KGaA), carbon-dioxide concentration using a Testo 535 CO₂ measuring instrument (Testo SE & Co. KGaA), and ambient temperature using a Testo 605i thermohygrometer (Testo SE & Co. KGaA). The same monitoring positions were used across the three scene conditions. Illuminance was recorded in lx, sound pressure level in dB(A), carbon dioxide in ppm, and temperature in °C.
Presence and spatial-presence domains were measured using the 7-point scoring structure specified in the study protocol. These constructs were interpreted with reference to the validated Presence Questionnaire (PQ) framework of Witmer and Singer and the Igroup Presence Questionnaire (IPQ) framework of Schubert et al.27. The study variables were reported as domain-level 7-point scores rather than as standard PQ or IPQ total scores. For simulator sickness, the Simulator Sickness Questionnaire symptom framework was used together with the prespecified 0–30 study summary variable; higher values indicated greater discomfort. This 0–30 study summary was reported separately from the standard weighted SSQ Total Severity score, consistent with the distinction between simulator-sickness measurement conventions and cybersickness reporting28. Interaction quality, wayfinding clarity, visual comfort, acoustic comfort, thermal comfort, perceived crowding, cognitive load, and overall satisfaction were measured using the study-specific, multi-item, 7-point rating scales. Supplementary File 2 documented the construct source, score range, and reporting convention for each domain.
Study outcomes
The primary algorithmic outcome was defined as the final spatial cost. The primary visitor-experience outcome was defined as overall satisfaction. Secondary algorithmic outcomes were defined as the improvement percentage, the number of iterations to the best solution, the runtime, and the acceptance rate. Secondary visitor-experience outcomes were defined as presence, spatial presence, interaction quality, wayfinding clarity, visual comfort, acoustic comfort, thermal comfort, perceived crowding, cognitive load, simulator sickness, completion time, dwell time, walking distance, hesitation count, and heatmap coverage. Completion time and walking distance were used to evaluate route efficiency. Hesitation count and wayfinding clarity were used to evaluate navigation quality. Presence, spatial presence, interaction quality, and dwell time were used to evaluate immersive engagement. Perceived crowding, cognitive load, comfort ratings, and simulator sickness were used to evaluate experiential burden.
Data cleaning and quality control
All participant records were checked before analysis. It was confirmed that each record had a single participant identifier, a single condition label, complete behavioral logs and questionnaire scores, and no duplicate identifiers. Presence, spatial-presence, and study-specific experience ratings were restricted to their defined 1–7 ranges. The simulator-sickness study summary variable was restricted to its prespecified 0–30 range. The questionnaire/codebook file was checked to confirm that it documented the construct source, response range, domain construction, and derived-score definitions used in the analysis.
A participant record was excluded if the session was not completed, completion time was less than 3 min or greater than 25 min, heatmap coverage was less than 10%, the trajectory log was incomplete or technically invalid, walking distance was less than 20 m in conjunction with an incomplete/invalid trajectory record, or the participant requested early termination. No upper walking-distance cutoff was applied; walking distance was retained as a continuous study outcome across its valid observed range. An algorithm run was excluded from layout selection if it violated any feasibility constraint. Random seeds, layout files, algorithm outputs, questionnaire/codebook files, and analysis scripts were preserved for reproducibility. Random-seed preservation was necessary because stochastic optimization outputs could vary with initialization and proposal behavior29.
Algorithm performance
The 30 standard simulated annealing runs and 30 adaptive simulated annealing with reheating runs were analyzed. Initial spatial cost, final spatial cost, improvement percentage, iterations to best solution, runtime, and acceptance rate were summarized as mean ± standard deviation (SD), and 95% confidence intervals were reported for the group means and between-algorithm differences.
Normality was assessed using quantile-quantile (Q-Q) plots and the Shapiro-Wilk test. Homogeneity of variance was assessed using Levene's test. The two algorithmic conditions were compared using independent-samples t tests when assumptions were met. Mann-Whitney U tests were used when assumptions were not met. Two-sided p values, 95% confidence intervals, and effect sizes were reported. Cohen's d was calculated using the equation

where:

Rank-biserial correlation was used for nonparametric comparisons. Sensitivity analysis was conducted by changing each objective-function weight by ±10% individually and proportionally renormalizing the remaining four weights so that the total remained 1.00. The final spatial cost and improvement percentage were recalculated for each alternative weight vector. The algorithmic comparison was considered stable when the adaptive simulated annealing with reheating condition retained a lower final spatial cost across the alternative weight settings.
Participant outcome analysis
Participant outcomes across the three layout conditions were analyzed using IBM SPSS Statistics 27.0 (IBM Corp.). Continuous variables were reported as mean ± SD, and categorical variables were reported as counts and percentages. Normality was assessed using Q-Q plots and the Shapiro-Wilk test. Homogeneity of variance was assessed using Levene's test. One-way analysis of variance (ANOVA) was used for normally distributed outcomes with acceptable homogeneity of variance. Welch's ANOVA was used when the assumption of homogeneity of variance was violated. Kruskal-Wallis tests were used for non-normal outcomes.
Pairwise comparisons were conducted among the manual layout, standard simulated annealing layout, and adaptive simulated annealing with reheating layout. The three pairwise comparisons within each outcome were adjusted using the Holm method. The 95% confidence intervals were reported together with adjusted p-values. Eta-squared was reported for standard ANOVA, omega-squared for Welch's ANOVA, epsilon-squared for Kruskal-Wallis tests, and standardized mean differences for pairwise comparisons. As a supplementary robustness analysis, pairwise Welch contrasts were calculated from the group mean, SD, and n = 60 per group. Welch degrees of freedom, two-sided p values, Holm-adjusted p values, 95% CIs for mean differences, and Hedges g were calculated. This supplementary analysis used the group-level statistics and was presented in Supplementary Table 1.
The randomized 1:1:1 three-group comparison was treated as the primary analysis. Age group, gender, education level, previous virtual-reality experience, and museum/exhibition-visiting frequency were recorded before allocation to characterize the sample and identify obvious imbalance. The trial was not designed or powered for subgroup interaction tests, and no prespecified moderator model was included; these characteristics were therefore treated as contextual variables rather than demonstrated moderators. Random allocation provided design-based control over baseline characteristics, while the residual influence of prior VR familiarity was explicitly retained as a limitation. Eta-squared was calculated using
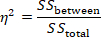
Epsilon-squared for Kruskal-Wallis tests was calculated as:
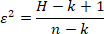
where H is the Kruskal-Wallis test statistic, k is the number of groups, and n is the total sample size.
Overall satisfaction, presence, wayfinding clarity, perceived crowding, cognitive load, completion time, walking distance, hesitation count, and heatmap coverage were prioritized in the interpretation because these variables directly reflected spatial efficiency and immersive visitor experience.
Ergebnisse
Teilnehmerfluss und Datenvervollständigung
Insgesamt 180 Teilnehmer absolvierten das Experiment mit der immersiven Ausstellung und wurden in die endgültige Analyse einbezogen. Die drei Layout-Bedingungen waren ausgeglichen: jeweils 60 Teilnehmer wurden dem manuellen Layout, dem Standard-Simulated-Annealing-Layout und dem adaptiven Simulated-Annealing-Layout mit Wiedererwärmung zugeordnet. Nach der Datenqualitätskontrolle wurde kein Teilnehmerdatensatz ausgeschlossen. Alle Verhaltensprotokolle und die Ergebnisse des nach der Erfahrung ausgefüllten Fragebogens waren vollständig. Umweltmessungen wurden als Kontrollprüfungen des Experiments und nicht als Teilnehmerergebnisse erfasst; dieselben Überwachungspositionen und vorgegebenen Zielbereiche wurden in allen drei Szenenbedingungen verwendet, und diese Variablen gingen nicht in die inferenzstatistische Analyse zwischen den Bedingungen ein.
Die endgültige Analyse umfasste 180 Teilnehmer-Sitzungs-Aufzeichnungen und 60 Algorithmusläufe aus den beiden Optimierungsbedingungen. Das manuelle Layout diente als nicht optimierter Vergleichswert. Die Standard-Simulierte-Annealing- und die adaptive Simulierte-Annealing-Methode mit erneuter Erwärmung umfassten jeweils 30 unabhängige Optimierungsläufe. Die wichtigsten algorithmischen, verhaltensbezogenen und Fragebogenergebnisse sind in Tabelle 2 zusammengefasst.
Zuverlässigkeit des Fragebogens und Verteilung der Bewertungen
Bevor die Layout-Bedingungen verglichen wurden, wurde die innere Konsistenz der mehrfachen Fragendomänen des Fragebogens überprüft. Die Fragendomänen wiesen eine akzeptable bis gute Zuverlässigkeit auf, wobei die Cronbachs Alpha-Werte zwischen 0,78 und 0,91 lagen. Präsenz, räumliche Präsenz, Interaktionsqualität, Orientierungsklarheit, komfortbezogene Bewertungen, kognitive Belastung und allgemeine Zufriedenheit lagen alle über der vorab festgelegten Zuverlässigkeitschwelle von 0,70.
Die Bewertungsverteilungen wurden ebenfalls vor dem Gruppenvergleich überprüft. Für das primäre Besuchererlebnis-Ergebnismaß wurden keine nennenswerten Deckel- oder Bodeneffekte beobachtet. Die Gesamtzufriedenheit, Präsenz, Orientierungsklarheit und kognitive Belastung zeigten eine ausreichende Variabilität über die drei Layoutbedingungen hinweg. Die Werte für Simulatorschwindel waren rechtsschief, wie für kurze Virtual-Reality-Expositionen erwartet, und wurden daher zusammen mit Verteilungsanalysen und nichtparametrischen Sensitivitätsprüfungen interpretiert.
Leistung des Algorithmus
Der adaptive Simulierte-Annealing-Algorithmus mit erneutem Aufheizen ergab eine geringere finale räumliche Kostenfunktion als das Standard-Simulierte-Annealing. Die mittlere finale räumliche Kostenfunktion betrug 0,475 ± 0,019 (95 % KI, 0,468–0,482) für das Standard-Simulierte-Annealing und 0,424 ± 0,016 (95 % KI, 0,418–0,430) für Adaptives SA-R. Die mittlere Differenz zwischen den Algorithmen (Adaptiv − Standard) betrug −0,051 (95 % KI, −0,060 bis −0,042), mit Welch-t = 11,25, p < 0,001 und Cohens d = 2,90.
Der Verbesserungsprozentsatz war in der Bedingung mit adaptivem Algorithmus höher: 24,91 % ± 3,22 % für standardmäßiges simuliertes Annealing und 32,54 % ± 3,29 % für Adaptive SA-R, eine mittlere Differenz von +7,63 Prozentpunkten (95 % KI, 5,95–9,31; Welch-t = 9,07; p < 0,001; d = 2,34). Adaptive SA-R erreichte die beste Lösung nach 722,20 ± 90,19 Iterationen im Vergleich zu 925,47 ± 86,38 Iterationen beim standardmäßigen simulierten Annealing, eine Differenz von −203,27 Iterationen (95 % KI, −248,91 bis −157,63; Welch-t = 8,92; p < 0,001; d = 2,30).
Die Laufzeit war für Adaptive SA-R leicht länger. Die durchschnittliche Laufzeit stieg von 47,83 ± 9,42 s auf 55,86 ± 9,49 s an, was einer mittleren Zunahme von 8,03 s entspricht (95 % KI, 3,14–12,92; Welch-t = 3,29; p = 0,002; d = 0,85), bzw. einer relativen Zunahme um 16,8 %. Die Akzeptanzrate stieg von 0,294 ± 0,045 auf 0,372 ± 0,054, eine mittlere Differenz von +0,078 (95 % KI, 0,052–0,104; Welch-t = 6,08; p < 0,001; d = 1,57). Als Gegenleistung war die durchschnittliche finale räumliche Kostenfunktion um 10,7 % niedriger, und die Anzahl der Iterationen bis zur besten Lösung war um 22,0 % geringer. Dies wird als geringer rechentechnischer Aufwand im Rahmen der getesteten Problemgröße interpretiert und nicht als Hinweis auf universelle rechentechnische Überlegenheit.
Die Konvergenzkurven zeigten, dass der adaptive simulierter-Annealing-Algorithmus mit erneuter Erwärmung die räumlichen Kosten im frühen Suchstadium schneller verringerte und im weiteren Verlauf eine niedrigere Kostenentwicklung beibehielt. In mehreren unabhängigen Durchläufen wies der adaptive Algorithmus numerisch geringere Variabilität der endgültigen räumlichen Kosten auf; dieser beschreibende Unterschied wurde keinem separaten, formellen Varianztest unterzogen. Die Ergebnisse zur Algorithmusleistung, einschließlich endgültiger räumlicher Kosten, Verbesserungsprozent, Iterationen bis zur besten Lösung, Laufzeit, Akzeptanzrate und repräsentativer Konvergenzkurven, sind in Abbildung 2 dargestellt.
Ergebnisse zur Besuchererfahrung
Die allgemeine Zufriedenheit unterschied sich zwischen den drei Layout-Bedingungen. Die Teilnehmer in der manuellen Layout-Bedingung gaben einen Mittelwert von 3,59 ± 0,45 an (95 % Konfidenzintervall [CI], 3,47–3,71), diejenigen in der Standard-Simulated-Annealing-Bedingung einen Mittelwert von 3,96 ± 0,44 (95 % CI, 3,85–4,07) und diejenigen in der adaptiven Simulated-Annealing-Bedingung mit erneuter Erwärmung einen Mittelwert von 4,37 ± 0,31 (95 % CI, 4,29–4,45). Der Effekt zwischen den Bedingungen war groß. Die allgemeine Zufriedenheit war kein Bestandteil der räumlichen Kostenfunktion und daher nicht direkt durch den Algorithmus optimiert.
Präsenz und räumliche Präsenz folgten dem gleichen Muster. Die Präsenz stieg von 3,77 ± 0,56 in der manuellen Layout-Bedingung auf 3,99 ± 0,55 in der Standard-Simulated-Annealing-Bedingung und 4,28 ± 0,42 in der adaptiven Simulated-Annealing-Bedingung mit erneutem Aufheizen. Die räumliche Präsenz stieg von 3,75 ± 0,64 auf 3,96 ± 0,63 und 4,27 ± 0,47 über die gleichen drei Bedingungen hinweg an.
Die Interaktionsqualität und die Klarheit der Orientierung verbesserten sich ebenfalls unter den optimierten Layouts. Die Interaktionsqualität stieg von 3,74 ± 0,56 im manuellen Layout-Zustand auf 4,00 ± 0,57 im Standard-Simulated-Annealing-Zustand und 4,24 ± 0,57 im adaptiven Simulated Annealing mit Wiedererwärmung-Zustand. Die Klarheit der Orientierung stieg entsprechend von 3,61 ± 0,58 auf 3,90 ± 0,57 und 4,17 ± 0,48.
Die optimierten Layouts verringerten Indikatoren negativer Erfahrungen. Die wahrgenommene Enge nahm von 3,01 ± 0,49 im manuellen Layout-Zustand auf 2,75 ± 0,55 im Standard-Simulated-Annealing-Zustand und auf 2,56 ± 0,45 im adaptiven Simulated Annealing mit Nachheizung-Zustand ab. Die kognitive Belastung sank von 3,21 ± 0,48 auf 2,87 ± 0,52 und 2,73 ± 0,44. Die Simulator-Krankheit war im adaptiven Layout-Zustand am geringsten und nahm von 2,52 ± 0,55 im manuellen Layout-Zustand auf 2,44 ± 0,58 im Standard-Simulated-Annealing-Zustand und auf 2,12 ± 0,56 im adaptiven Simulated Annealing mit Nachheizung-Zustand ab.
Die bewerteten Komfortaspekte zeigten konsistente, jedoch moderatere Verbesserungen. Der visuelle Komfort stieg von 3,67 ± 0,44 in der manuellen Layout-Bedingung auf 3,87 ± 0,44 in der Standard-Simulated-Annealing-Bedingung und 4,07 ± 0,45 in der adaptiven Simulated-Annealing-Bedingung mit Wiedererwärmung. Der akustische Komfort stieg von 3,64 ± 0,52 auf 3,75 ± 0,42 und 3,97 ± 0,44. Der thermische Komfort stieg von 3,69 ± 0,46 auf 3,79 ± 0,32 und 3,94 ± 0,44. Die wichtigsten Ergebnisse bezüglich des Besuchererlebnisses und des Verhaltens sind in Abbildung 3 dargestellt.
Verhaltensbezogene Ergebnisse
Die Daten zur Verhaltensentwicklung bestätigten die Ergebnisse des Fragebogens. Die Durchlaufzeit nahm über die drei Layoutbedingungen hinweg ab. Die Teilnehmer im manuellen Layout benötigten 19,11 ± 2,63 min, um die Ausstellung zu durchlaufen, verglichen mit 17,42 ± 2,77 min unter der Standard-Simuliertes-Annealing-Bedingung und 14,93 ± 2,32 min unter der adaptiven Simuliertes-Annealing-mit-Annealing-Bedingung.
Die Gehstrecke zeigte eine ähnliche Verringerung. Die mittlere Gehstrecke betrug 234,88 ± 24,34 m in der manuellen Layoutbedingung, 217,95 ± 24,33 m in der Standard-Simulated-Annealing-Bedingung und 201,86 ± 23,47 m in der adaptiven Simulated-Annealing-Bedingung mit Wiedererwärmung. Die Anzahl der Zögern verringerte sich ebenfalls, von 7,10 ± 1,80 in der manuellen Layoutbedingung auf 5,51 ± 1,79 in der Standard-Simulated-Annealing-Bedingung und 4,07 ± 1,99 in der adaptiven Simulated-Annealing-Bedingung mit Wiedererwärmung.
Die Verweildauer und die Abdeckung der Heatmap nahmen bei den optimierten Layouts zu. Die Verweildauer stieg von 11,17 ± 2,03 min unter der manuellen Layoutbedingung auf 12,24 ± 2,04 min unter der Standard-Simulated-Annealing-Bedingung und 13,39 ± 2,28 min unter der adaptiven Simulated-Annealing-Bedingung mit erneutem Aufheizen. Die Abdeckung der Heatmap erhöhte sich entsprechend von 66,18 % ± 9,40 % auf 74,14 % ± 7,93 % und 84,40 % ± 9,47 %.
Diese Ergebnisse zeigen, dass das adaptive Layout nicht einfach nur die Strecke verkürzt hat. Es hat ineffiziente Bewegungen und Zögern verringert, während die Verweildauer und räumliche Abdeckung erhöht wurden.
Räumliche Anordnung und Verteilung der Besucherwege
Die optimierten Anordnungen wiesen sichtbare Unterschiede in der Routenorganisation und räumlichen Abdeckung auf. Im Vergleich zur manuellen Anordnung verringerte die Layout-Optimierung mittels Standard-Simuliertem Annealing unnötige Wegabzweigungen und verbesserte die Durchgängigkeit zwischen thematischen Zonen. Die adaptive Variante des Simulierten Annealing mit erneuter Erwärmung führte zu einer noch ausgewogeneren Verteilung der Ausstellungsbereiche und Interaktionsknoten mit weniger lokalen Stauungen entlang der Hauptroute.
Die Trajektorien-Heatmaps zeigten, dass die Teilnehmer in der adaptiven Layout-Bedingung einen größeren Anteil der Ausstellungshalle abdeckten, während sie kürzere Gehstrecken und weniger Zögerungen aufwiesen. In der manuellen Layout-Bedingung waren die Trajektorien stärker um mehrere Wendepunkte und Übergangsbereiche konzentriert. Unter standardmäßigen simulierten Ausglühen-Bedingungen wurde die Trajektorienverteilung kontinuierlicher, wies jedoch weiterhin mehrere lokale Bereiche wiederholter Bewegungen auf. Bei adaptivem simuliertem Ausglühen mit erneutem Aufheizen war das Trajektorienmuster breiter und gleichmäßiger über den Ausstellungsraum verteilt. Die räumlichen Layouts und die Heatmaps der Besucherbewegungstrajektorien sind in Abbildung 4. dargestellt.
Statistischer Vergleich der Teilnehmerergebnisse
Gruppenvergleiche zeigten deutliche Unterschiede zwischen den Bedingungen hinsichtlich der primären und wichtigsten sekundären Ergebnisse. Die allgemeine Zufriedenheit unterschied sich signifikant zwischen den Bedingungen, wobei die höchste Bewertung in der Bedingung mit adaptiver simulierter Abkühlung mit erneuter Erwärmung beobachtet wurde. Die Abdeckung der Heatmap, die Abschlusszeit, die Anzahl der Zögern, die Gehstrecke, die Klarheit der Orientierung und das Gefühl der Präsenz wiesen ebenfalls starke Effekte zwischen den Bedingungen auf.
Die größten Effekte wurden bei der Heatmap-Abdeckung, der allgemeinen Zufriedenheit, der Anzahl der Zögern und der Abschlusszeit beobachtet. Die Heatmap-Abdeckung zeigte einen großen Effekt zwischen den Bedingungen mit η2 = 0.413. Auch die allgemeine Zufriedenheit zeigte einen großen Effekt mit η2 = 0.386. Die Anzahl der Zögern und die Abschlusszeit zeigten große Effekte mit η2 = 0.311 bzw. η2 = 0.311. Die Gehstrecke zeigte einen mittelgroßen bis großen Effekt mit η2 = 0.242.
Paarweise Sensitivitätsanalysen unterstützten die drei Hauptvergleichsgruppen. Im Vergleich zum standardmäßigen simulierten Annealing erhöhte Adaptive SA-R die Gesamtzufriedenheit um 0,41 Punkte (95 % KI, 0,272–0,548; Holm-angepasstes p < 0,001; Hedges g = 1,07), die Präsenz um 0,29 (95 % KI, 0,113–0,467; angepasstes p = 0,003; g = 0,59) und die Klarheit der Orientierung um 0,27 (95 % KI, 0,079–0,461; angepasstes p = 0,012; g = 0,51). Die Absolvierungszeit verringerte sich um 2,49 min (95 % KI, −3,414 bis −1,566; angepasstes p < 0,001; g = −0,97), die Gehstrecke um 16,09 m (95 % KI, −24,733 bis −7,448; angepasstes p < 0,001; g = −0,67) und die Anzahl der Zögern um 1,44 (95 % KI, −2,124 bis −0,756; angepasstes p < 0,001; g = −0,76), während die Abdeckung der Heatmap um 10,26 Prozentpunkte stieg (95 % KI, 7,101–13,419; angepasstes p < 0,001; g = 1,17). Die wahrgenommene Belegung war um 0,19 Punkte niedriger (95 % KI, −0,372 bis −0,008; angepasstes p = 0,041; g = −0,38) und die Zusammenfassung der Simulator-Krankheitsstudie auf einer Skala von 0–30 war um 0,32 Punkte niedriger (95 % KI, −0,526 bis −0,114; angepasstes p = 0,005; g = −0,56). Die vollständigen Ergebnisse aller Teilnehmer für die dreifache Kontrastanalyse sind in Supplementary Table 1 enthalten.
Verteilungsannahmen und Varianzhomogenität wurden mithilfe von Q-Q-Diagrammen, Shapiro-Wilk-Tests und Levene-Tests überprüft, bevor die vorgegebene parametrische oder robuste Alternative ausgewählt wurde. Für Ergebnisse, die eindeutig nicht normalverteilt waren, kam eine nichtparametrische Sensitivitätsanalyse zum Einsatz. Pairwise-Vergleiche wurden mit der Holm-Methode adjustiert, und 95%-Konfidenzintervalle werden für die Hauptgruppenmittelwerte, algorithmische Unterschiede zwischen Gruppen, Fehlerbalken in Abbildungen sowie für die paarweisen Vergleiche der zusammenfassenden Statistiken in den Zusatzmaterialien angegeben. Es werden keine Subgruppen- oder Moderator-Effekte aus den kontextuellen Kovariaten abgeleitet, da diese Analysen weder vorgeplant noch ausreichend powergestärkt waren.
Mehrere teilnehmerbezogene Ergebnisse liefern eine konvergente Validierung über die Variablen hinaus, die direkt durch die räumliche Kostenfunktion minimiert werden. Die allgemeine Zufriedenheit, Präsenz, kognitive Belastung, Simulatorsickness, Blickdauer und die Abdeckung der Heatmap sind keine expliziten Terme in der Zielfunktion. Die Unterschiede zwischen den Layouts in diesen Maßen erweitern daher die Bewertung über eine einfache Umformulierung von Routenlänge oder Belegungspenaltäten hinaus, obwohl sie weiterhin innerhalb desselben kontrollierten Virtual-Reality-Experiments gemessen werden und nicht als vollständig unabhängige Validierung in der realen Welt interpretiert werden sollten.
Sensitivitätsanalyse
Bei der Sensitivitätsanalyse wurde jeder Gewichtungsfaktor der Zielfunktion einzeln um ±10 % variiert und die verbleibenden Gewichte proportional neu normiert, um ein Gesamtgewicht von 1,00 beizubehalten. Bei den alternativen Gewichtungskonfigurationen wies die adaptive simulierte Abkühlung mit Nachheizbedingung durchgängig die niedrigste mittlere räumliche Gesamtkosten auf. Die Richtung des Vergleichs blieb bezüglich der finalen räumlichen Kosten, des Verbesserungsprozentsatzes und der Anzahl der Iterationen bis zur besten Lösung unverändert. Diese Ergebnisse belegen eine lokale Robustheit gegenüber moderaten Gewichtsstörungen, zeigen jedoch nicht, dass derselbe Gewichtsvektor auch für andere Ausstellungstypen geeignet ist.
Die Stabilitätsanalyse zeigt, dass der adaptive Algorithmus nicht allein von einer nominalen Gewichtungskonfiguration abhängig war. Das Muster der Besuchererfahrung stimmte ebenfalls mit den algorithmischen Ergebnissen überein: Das Layout mit den geringsten räumlichen Kosten wies die höchste Zufriedenheit, eine stärkere Präsenz, eine klarere Orientierung und eine breitere Abdeckung in der Heatmap auf.
Die Implementierung basiert auf Parametern und ist nicht fest auf einen einzigen Grundriss festgelegt: Hallengrenze, Gitterauflösung, Zonenanzahl und zulässige Fläche, Bereich für den Pfadbreite, Dichtegrenze, Anzahl der Interaktionsknoten, Umweltziele und Zielgewichtungen sind externe Konfigurationswerte. Diese Eingaben können ausgetauscht werden, ohne die Suchlogik für Vorschlag, Annahme und Nachheizung zu verändern, wodurch strukturelle Übertragbarkeit auf andere codierte Layouts gegeben ist. Dies ist eine Eigenschaft der Softwarearchitektur, keine empirische Belege für Generalisierung; die Leistung wurde bisher nur für das aktuelle rechteckige Szenario mit einer Ebene von 36 m × 24 m nachgewiesen.
Zusammenfassung der Ergebnisse
Innerhalb des getesteten einstöckigen Ausstellungsszenarios von 36 m × 24 m erzielte die adaptive simulierte Abkühlung mit erneuter Erwärmung die niedrigsten räumlichen Kosten, den höchsten Verbesserungsprozentsatz und das günstigste Profil hinsichtlich der Teilnehmererfahrung unter den drei evaluierten Layoutbedingungen. Im Vergleich zum manuellen Layout führte das adaptive Layout zu höherer Zufriedenheit, stärkerer Präsenz, klarerer Orientierung, geringerer Überfüllung und kognitiver Belastung, kürzerer Bearbeitungszeit und kürzerer Gehstrecke, weniger Zögereignissen, längeren Verweildauern und einer breiteren Abdeckung in der Heatmap. Diese Ergebnisse beschreiben die Leistung unter der vorgegebenen Zielfunktion und den experimentellen Bedingungen und sollten nicht als Nachweis eines universell optimalen Ausstellungslayouts interpretiert werden. Im Vergleich zur Standard-Simulierten-Annealing-Methode zeigte der adaptive Algorithmus eine stärkere Optimierungsleistung und bessere Ergebnisse auf Teilnehmerebene, allerdings mit einem moderaten Anstieg der Laufzeit. Die kombinierten algorithmischen, verhaltensbasierten, fragebogenbasierten sowie Trajektorien-Heatmap-Ergebnisse unterstützen den vorgeschlagenen Workflow zur Layout-Optimierung für die Gestaltung immersiver Ausstellungsraumumgebungen.
Datenverfügbarkeit
Die mit der vorliegenden Studie verbundenen Rohdaten sind auf Figshare verfügbar: Zhang, Guangping; Hui, Xianghui; Wang, Hanye (2026). Optimizing Immersive Exhibition Space Design Using Adaptive Simulated Annealing with Reheating and Virtual Reality Evaluation. figshare. Dataset. https://doi.org/10.6084/m9.figshare.33313611.v1
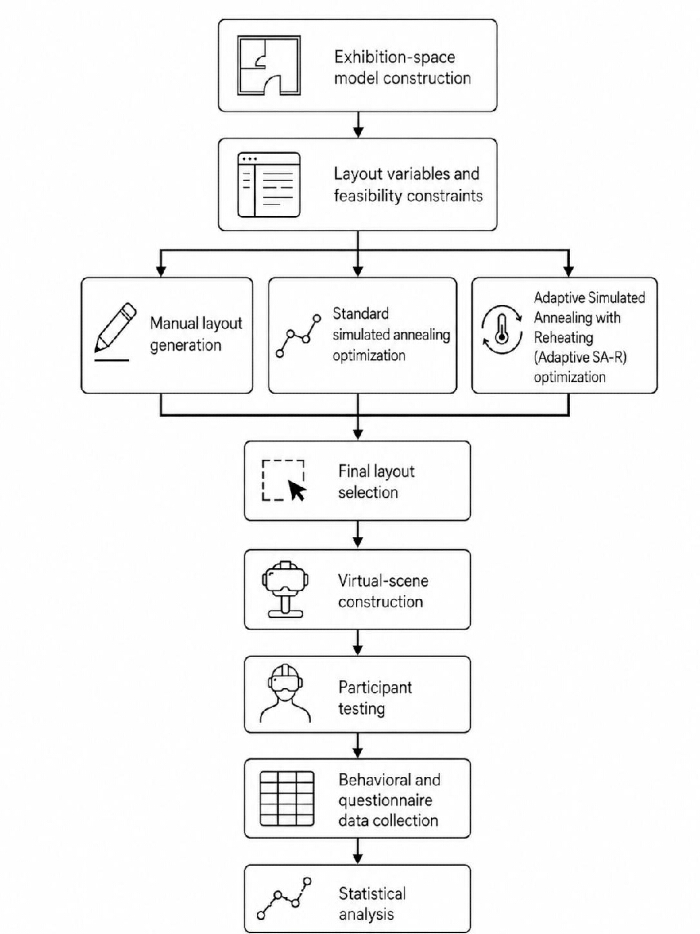
Abbildung 1: Arbeitsablauf zur Optimierung der Layoutgestaltung in immersiven Ausstellungsräumen und deren Bewertung in der virtuellen Realität. Der Arbeitsablauf umfasst die Erstellung eines Modells des Ausstellungsraums, die Definition von Layoutvariablen und Machbarkeitsbeschränkungen, die manuelle Erzeugung von Layouts, die Standard-Simulierte-Annealing-Optimierung, die adaptive Simulierte-Annealing-Optimierung mit erneuter Erwärmung, die endgültige Layoutauswahl, die Konstruktion einer virtuellen Szene, die Teilnehmerprüfung, die Erfassung von Verhaltens- und Fragebogendaten sowie die statistische Analyse. Die Abbildung fasst die gesamte methodische Abfolge zusammen, die verwendet wird, um die Optimierung der Raumgestaltung mit der Bewertung des immersiven Erlebnisses zu verbinden. In dieser Abbildung werden keine Unterteilungen in Felder oder statistische Notationen verwendet. Bitte klicken Sie hier, um eine vergrößerte Version dieser Abbildung anzusehen.
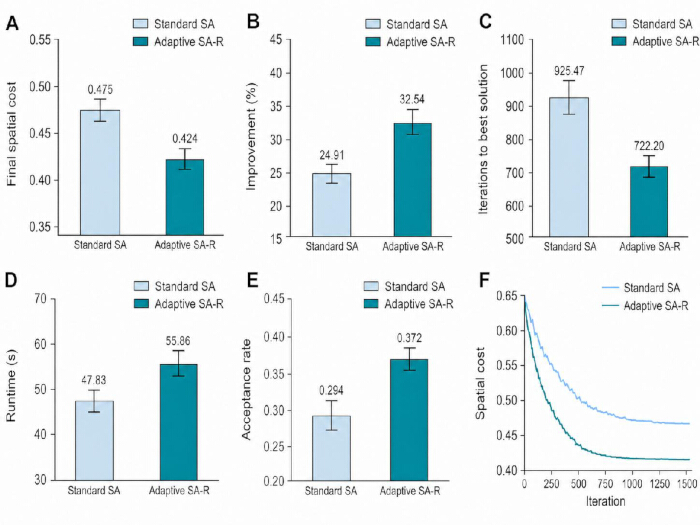
Abbildung 2: Algorithmusleistung der Standard-Simulierten Abkühlung und der adaptiven Simulierten Abkühlung mit erneuter Erwärmung. (A) Endgültige räumliche Kosten über unabhängige Optimierungsläufe hinweg. (B) Verbesserungsprozent von den anfänglichen zu den endgültigen räumlichen Kosten. (C) Anzahl der Iterationen, die erforderlich sind, um die beste Lösung zu erreichen. (D) Laufzeit in Sekunden. (E) Akzeptanzrate während des Suchprozesses. (F) Repräsentative Konvergenzkurven, die die räumlichen Kosten über die Iterationen darstellen. Standard-SA bezeichnet die Standard-Simulierte Abkühlung; Adaptive SA-R bezeichnet die adaptive Simulierte Abkühlung mit erneuter Erwärmung. Die Panels A–E enthalten jeweils n = 30 unabhängige Optimierungsläufe pro algorithmischer Bedingung. Mittlere Markierungen/-balken stellen die Gruppenmittelwerte dar, und Fehlerbalken zeigen 95 % Konfidenzintervalle des Mittelwerts an; einzelne Streupunkte auf Läufe-Ebene werden nicht dargestellt. Zwischen-algorithmische inferenzstatistische Vergleiche sind in Tabelle 2 mit exakten p-Werten und Cohen’s-d-Effektstärken aufgeführt. Panel F zeigt repräsentative Konvergenzverläufe und dient der Beschreibung, nicht einem zusätzlichen inferenzstatistischen Test. Abkürzungen: CI = Konfidenzintervall; SA = Simulierte Abkühlung; SA-R = Simulierte Abkühlung mit erneuter Erwärmung. Bitte klicken Sie hier, um eine vergrößerte Version dieser Abbildung anzusehen.
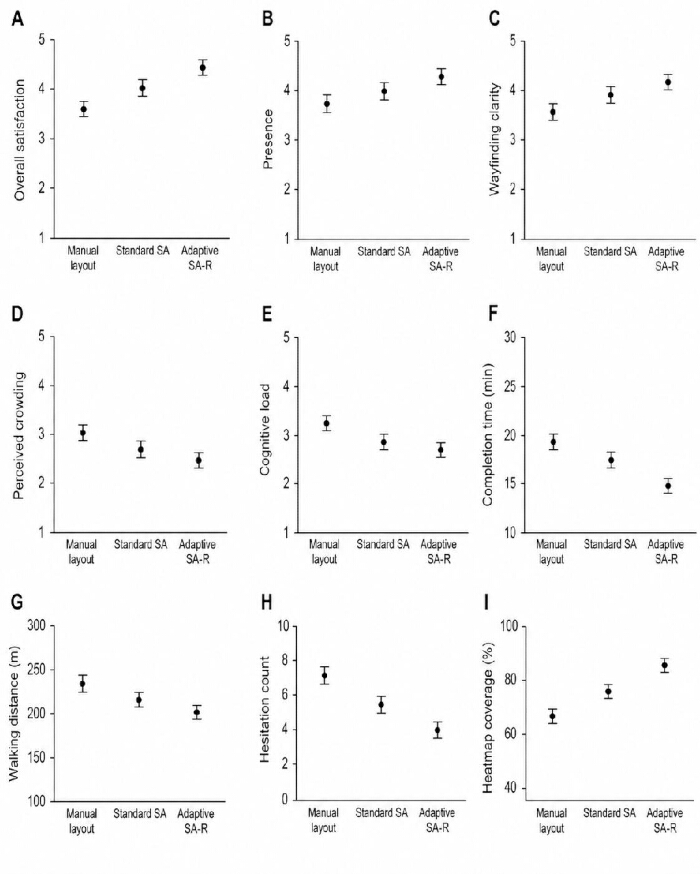
Abbildung 3: Besuchererfahrung und verhaltensbezogene Ergebnisse über die drei Layoutbedingungen hinweg. (A) Allgemeine Zufriedenheit. (B) Präsenz. (C) Orientierungsklarheit. (D) Empfundene Überfüllung. (E) Kognitive Belastung. (F) Bearbeitungsdauer. (G) Gehstrecke. (H) Anzahl der Zögern. (I) Wärmekartenabdeckung. Die Gruppen waren manuelles Layout, Standard-Simulated Annealing (SA) und adaptives Simulated Annealing mit Wiedererwärmung (SA-R), mit jeweils n = 60 Teilnehmern pro Gruppe. Schwarze Markierungen stellen die Gruppenmittelwerte dar, und vertikale Fehlerbalken zeigen die 95 %-Konfidenzintervalle des Mittelwerts an; die individuelle Streuung auf Teilnehmerebene ist nicht dargestellt. Die Ergebnisse wurden zwischen den drei Gruppen mithilfe des im Protokoll beschriebenen vorgegebenen ANOVA/robusten Alternativ-Verfahrens verglichen; die exakten p-Werte und Effektgrößen sind in Tabelle 2 angegeben. Abkürzungen: CI = Konfidenzintervall; ANOVA = Varianzanalyse; SA = Simulated Annealing; SA-R = Simulated Annealing mit Wiedererwärmung. Bitte klicken Sie hier, um eine vergrößerte Version dieser Abbildung anzusehen.
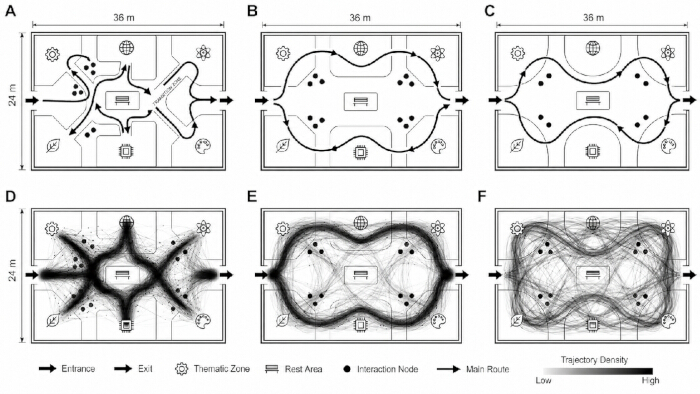
Abbildung 4: Räumliche Layouts und Heatmaps der Besuchertrajektorien über die drei Layoutbedingungen hinweg. (A) Manuelles Ausstellungs-Layout. (B) Standard-Simuliertes-Annealing-Layout. (C) Adaptives simuliertes Annealing mit Nachheizung. (D) Heatmap der Besuchertrajektorien unter der Bedingung des manuellen Layouts. (E) Heatmap der Besuchertrajektorien unter der Bedingung des standardmäßigen simulierten Annealings. (F) Heatmap der Besuchertrajektorien für adaptives simuliertes Annealing mit Nachheizung. Die schematischen Symbole kennzeichnen den Eingang, Ausgang, thematische Zonen, Ruhebereich, Interaktionsknoten und Hauptweg, wie in der eingebetteten Legende angegeben. Die Dichteskala in den Panels D–F reicht von geringer bis hoher Trajektoriendichte, und jede Trajektorien-Heatmap fasst n = 60 Teilnahmesitzungen in der jeweiligen Bedingung zusammen. Die Panels A–C zeigen Layout-Schemata, die Panels D–F beschreibende Trajektorienvisualisierungen; in dieser Abbildung werden keine Fehlerbalken oder Signifikanzkennzeichnungen verwendet. Bitte klicken Sie hier, um eine größere Version dieser Abbildung anzusehen.
| Parameterkategorie | Parameter | Wert / Einstellung | Rolle im Protokoll |
| Ausstellungsfläche | Hallengröße | 36 m × 24 m | Feste räumliche Begrenzung |
| Ausstellungsfläche | Gesamtfläche | 864 m² | Basis-Modellfläche |
| Ausstellungsfläche | Deckenhöhe | 4,5 m | Parameter der virtuellen Szene |
| Zugangspunkte | Eingangsweite | 3,0 m | Fester Zugangspunkt |
| Zugangspunkte | Ausgangsweite | 3,0 m | Fester Zugangspunkt |
| Funktionale Zoneneinteilung | Anzahl thematischer Zonen | 6 | Hauptlayoutobjekte |
| Funktionale Zoneneinteilung | Bereichsgröße der thematischen Zonen | 80–130 m² | Machbarkeitsbeschränkung |
| Funktionale Zoneneinteilung | Verbindungsgänge | 2 | Routenverbindungselemente |
| Funktionale Zoneneinteilung | Ruhebereich | 40 m² | Fester Funktionsbereich |
| Verkehrsfluss | Hauptgangbreite | 1,8–3,5 m | Optimierungsvariable |
| Verkehrsfluss | Anfängliche manuelle Gangbreite | 2,2 m | Standardlayouteinstellung |
| Verkehrsfluss | Maximale Referenzroutenlänge | 120 m | Normalisierungswert für Gehstreckenkosten |
| Interaktion | Interaktionsknoten | 8–12 | Optimierungsvariable |
| Interaktion | Auslöseradius für Interaktionsknoten | 1,0 m | Einstellung für Interaktion in der virtuellen Realität |
| Interaktion | Freiraumradius für Interaktionsknoten | ≥1,2 m | Machbarkeitsbeschränkung |
| Räumliche Analyse | Gittergröße | 0,5 m × 0,5 m | Sichtbarkeits-, Heatmap- und Dichteberechnung |
| Sichtbarkeitsanalyse | Abstand der Sichtlinienstrahlen | 0,5 m | Berechnung der visuellen Zugänglichkeit |
| Überfüllung | Lokale Dichteschwelle | ≤1,50 Personen/m² | Machbarkeitsbeschränkung und Referenzwert für Überfüllungskosten |
| Umweltkomfort | Zielbeleuchtungsstärke | 300–500 lx | Komponente der Umweltkomfortstrafe |
| Umweltkomfort | Zielschalldruckpegel | 45–60 dB(A) | Komponente der Umweltkomfortstrafe |
| Umweltkomfort | Ziel-Kohlendioxid | <900 ppm | Komponente der Umweltkomfortstrafe |
| Umweltkomfort | Zieltemperatur | 22–25 °C | Komponente der Umweltkomfortstrafe |
| Zielfunktion | Gewichtung der Gehstreckenkosten | 0,25 | Komponente der Routeneffizienz |
| Zielfunktion | Gewichtung der Sichtbarkeitskosten | 0,2 | Komponente der visuellen Zugänglichkeit |
| Zielfunktion | Gewichtung der Überfüllungskosten | 0,25 | Komponente der Überfüllungskontrolle |
| Zielfunktion | Gewichtung der Umweltkomfortstrafe | 0,15 | Komponente des Umweltkomforts |
| Zielfunktion | Gewichtung der Interaktionsbalancierung | 0,15 | Komponente der Interaktionsverteilung |
| Standard-Simuliertes-Annealing | Anfangstemperatur | 100 | Startsuchtemperatur |
| Standard-Simuliertes-Annealing | Abkühlkoeffizient | 0,95 | Regel zur Temperaturreduzierung |
| Standard-Simuliertes-Annealing | Maximale Iterationen | 1500 | Abbruchregel |
| Standard-Simuliertes-Annealing | Stillstandschwelle | 200 Iterationen | Frühe Abbruchregel |
| Standard-Simuliertes-Annealing | Vorschlagsbewegungen für Layouts | Zonenverschiebung; Tausch der Zonensequenz; Anpassung der Gangbreite; Verschiebung von Interaktionsknoten | Erzeugung benachbarter Lösungen |
| Standard-Simuliertes-Annealing | Bereich für Zonenverschiebung | 0,5–2,0 m | Einstellung für Vorschlagsbewegung |
| Standard-Simuliertes-Annealing | Bereich für Gangbreitenanpassung | 0,1–0,3 m | Einstellung für Vorschlagsbewegung |
| Standard-Simuliertes-Annealing | Bereich für Interaktionsknotenverschiebung | 0,5–1,5 m | Einstellung für Vorschlagsbewegung |
| Adaptives SA-R | Bereich der ersten Iterationsphase | Erste 40 % der Iterationen | Phase der globalen Erkundung |
| Adaptives SA-R | Vorschlagswahrscheinlichkeiten in der ersten Phase | Lokale Verschiebung 0,20; Tausch der Zonensequenz 0,35; Anpassung der Gangbreite 0,30; Umplatzierung von Interaktionsknoten 0,15 | Adaptive Vorschlagsverteilung |
| Adaptives SA-R | Bereich der zweiten Iterationsphase | Letzte 60 % der Iterationen | Phase der lokalen Feinabstimmung |
| Adaptives SA-R | Vorschlagswahrscheinlichkeiten in der zweiten Phase | Lokale Verschiebung 0,35; Tausch der Zonensequenz 0,15; Anpassung der Gangbreite 0,20; Umplatzierung von Interaktionsknoten 0,30 | Adaptive Vorschlagsverteilung |
| Adaptives SA-R | Erhitzungsschwelle | 150 Iterationen ohne Verbesserung | Verhinderung vorzeitiger Konvergenz |
| Adaptives SA-R | Erhitzungsintensität | 10 % Erhöhung der aktuellen Temperatur | Adaptive Erhitzungsregel |
| Adaptives SA-R | Maximale Anzahl an Erhitzungsvorgängen | 3 pro Durchlauf | Regel zur Suchstabilität |
| Algorithmus-Evaluation | Unabhängige Zufallsseeds | 30 pro algorithmischer Bedingung | Schätzung der Algorithmusleistung |
| Virtuelle-Realität-Szene | Kamerahöhe | 1,65 m | Annähernde stehende Augenhöhe |
| Virtuelle-Realität-Szene | Geschwindigkeit des Gehens | 1,2 m/s | Standardisierte Navigationseinstellung |
| Virtuelle-Realität-Szene | Teleportation | Deaktiviert | Standardisierte Trajektorienaufzeichnung |
| Teilnehmer-Sitzung | Dauer der Übungsszene | 2 min | Einarbeitung vor der Testszene |
| Teilnehmer-Sitzung | Sitzende Ruhephase vor der Sitzung | 2 min | Grundlegende Vorbereitung |
| Teilnehmer-Sitzung | Ruhephase nach der Sitzung | 3 min | Erholung vor dem Fragebogen |
| Teilnehmer-Sitzung | Schwellenwert für Routenunterstützung | >30 s ohne Fortschritt möglich | Standardisierte Unterstützungsregel |
| Studiendesign | Layoutbedingungen | 3 | Manuelles Layout; Standard-Simuliertes-Annealing-Layout; adaptives Simuliertes-Annealing-mit-Erhitzung-Layout |
| Studiendesign | Teilnehmer pro Bedingung | 60 | Zuordnung zwischen den Gruppen |
| Studiendesign | Gesamtanzahl der Teilnehmer | 180 | Vollständige Stichprobe der Studie |
| Primäres algorithmisches Ergebnis | Endgültige räumliche Kosten | Kontinuierlich | Hauptoptimierungsergebnis |
| Primäres Ergebnis der Besuchererfahrung | Gesamtbefriedigung | 1–7 Skala | Hauptergebnis der Teilnehmerangaben |
| Sekundäre algorithmische Ergebnisse | Verbesserungsprozentsatz; Iterationen bis zur besten Lösung; Laufzeit; Akzeptanzrate | Kontinuierlich | Bewertung der Algorithmusleistung |
| Sekundäre Ergebnisse der Besuchererfahrung | Anwesenheit; räumliche Präsenz; Interaktionsqualität; Orientierungsklarheit; visueller Komfort; akustischer Komfort; thermischer Komfort; wahrgenommene Überfüllung; kognitive Belastung; Simulatorschwindel | Kontinuierlich | Erfahrungsbewertung |
| Sekundäre verhaltensbezogene Ergebnisse | Abschlusszeit; Verweildauer; Gehstrecke; Anzahl der Zögern; Heatmap-Abdeckung | Kontinuierlich | Bewertung von Trajektorie und Routenverhalten |
| Ausschlussregel | Abschlusszeit | <3 min oder >25 min | Ausschlusskriterium für Teilnehmerdatensätze |
| Ausschlussregel | Gehstrecke | Keine obere Grenze; Datensätze mit <20 m wurden nur als ungültig betrachtet, wenn sie mit einer unvollständigen/ungültigen Trajektorie verbunden waren | Datensicherheitsregel |
| Ausschlussregel | Heatmap-Abdeckung | <10 % | Ausschlusskriterium für Teilnehmerdatensätze |
| Kontrolle multipler Vergleiche | Anpassung paarweiser Vergleiche | Holm-Methode | Kontrolle des Typ-I-Fehlers |
| Sensitivitätsanalyse | Gewichtungsänderung der Zielfunktion | ±10 %, Gesamtgewicht bleibt bei 1,00 | Stabilitätsprüfung |
Tabelle 1: Variablen des räumlichen Designs, Optimierungsparameter, Machbarkeitsbeschränkungen und Ergebnisdefinitionen. Diese Tabelle fasst die festgelegten Parameter des Ausstellungsraums, variable Gestaltungselemente, Machbarkeitsbeschränkungen, Einstellungen und Begründung der Zielfunktion, Standardparameter des simulierten Annealings, Einstellungen des adaptiven simulierten Annealings mit erneutem Aufheizen, Parameter der Virtual-Reality-Szene, Prozeduren für die Teilnehmersitzungen, Regeln zur Ausschlusskriterien für Datenintegrität sowie primäre und sekundäre Ergebnisse zusammen, die im Protokoll verwendet wurden. SA = simuliertes Annealing; SA-R = adaptives simuliertes Annealing mit erneutem Aufheizen; VR = Virtual Reality.
| Kategorie | Ergebnis | Manuelles Layout | Standard SA | Adaptives SA-R | Statistischer Test / Mittelwertdifferenz | p-Wert | Effektgröße |
| Algorithmusleistungs-Ergebnisse | Endgültige räumliche Kosten | — | 0,475 ± 0,019 (95 % KI, 0,468–0,482) | 0,424 ± 0,016 (95 % KI, 0,418–0,430) | Welch t = 11,25; Mittelwertdifferenz = −0,051 (95 % KI, −0,060 bis −0,042) | <0,001 | Cohen’s d = 2,90 |
| Verbesserungsprozentsatz (%) | — | 24,91 ± 3,22 (95 % KI, 23,708–26,112) | 32,54 ± 3,29 (95 % KI, 31,311–33,769) | Welch t = 9,07; Mittelwertdifferenz = +7,63 (95 % KI, 5,95 bis 9,31) | <0,001 | Cohen’s d = 2,34 | |
| Iterationen bis zur besten Lösung | — | 925,47 ± 86,38 (95 % KI, 893,215–957,725) | 722,20 ± 90,19 (95 % KI, 688,523–755,877) | Welch t = 8,92; Mittelwertdifferenz = −203,27 (95 % KI, −248,91 bis −157,63) | <0,001 | Cohen’s d = 2,30 | |
| Rechenzeit (s) | — | 47,83 ± 9,42 (95 % KI, 44,313–51,347) | 55,86 ± 9,49 (95 % KI, 52,316–59,404) | Welch t = 3,29; Mittelwertdifferenz = +8,03 (95 % KI, 3,14 bis 12,92) | 0,002 | Cohen’s d = 0,85 | |
| Akzeptanzrate | — | 0,294 ± 0,045 (95 % KI, 0,277–0,311) | 0,372 ± 0,054 (95 % KI, 0,352–0,392) | Welch t = 6,08; Mittelwertdifferenz = +0,078 (95 % KI, 0,052 bis 0,104) | <0,001 | Cohen’s d = 1,57 | |
| Besuchererfahrungs-Ergebnisse | Anwesenheit | 3,77 ± 0,56 (95 % KI, 3,625–3,915) | 3,99 ± 0,55 (95 % KI, 3,848–4,132) | 4,28 ± 0,42 (95 % KI, 4,172–4,388) | ANOVA F = 14,86 | <0,001 | η² = 0,144 |
| Räumliche Anwesenheit | 3,75 ± 0,64 (95 % KI, 3,585–3,915) | 3,96 ± 0,63 (95 % KI, 3,797–4,123) | 4,27 ± 0,47 (95 % KI, 4,149–4,391) | ANOVA F = 11,99 | <0,001 | η² = 0,119 | |
| Interaktionsqualität | 3,74 ± 0,56 (95 % KI, 3,595–3,885) | 4,00 ± 0,57 (95 % KI, 3,853–4,147) | 4,24 ± 0,57 (95 % KI, 4,093–4,387) | ANOVA F = 11,68 | <0,001 | η² = 0,117 | |
| Klarheit der Orientierung | 3,61 ± 0,58 (95 % KI, 3,460–3,760) | 3,90 ± 0,57 (95 % KI, 3,753–4,047) | 4,17 ± 0,48 (95 % KI, 4,046–4,294) | ANOVA F = 15,83 | <0,001 | η² = 0,152 | |
| Visueller Komfort | 3,67 ± 0,44 (95 % KI, 3,556–3,784) | 3,87 ± 0,44 (95 % KI, 3,756–3,984) | 4,07 ± 0,45 (95 % KI, 3,954–4,186) | ANOVA F = 12,21 | <0,001 | η² = 0,121 | |
| Akustischer Komfort | 3,64 ± 0,52 (95 % KI, 3,506–3,774) | 3,75 ± 0,42 (95 % KI, 3,642–3,858) | 3,97 ± 0,44 (95 % KI, 3,856–4,084) | ANOVA F = 7,94 | <0,001 | η² = 0,082 | |
| Thermischer Komfort | 3,69 ± 0,46 (95 % KI, 3,571–3,809) | 3,79 ± 0,32 (95 % KI, 3,707–3,873) | 3,94 ± 0,44 (95 % KI, 3,826–4,054) | ANOVA F = 5,61 | 0,004 | η² = 0,060 | |
| Wahrgenommene Belegung | 3,01 ± 0,49 (95 % KI, 2,883–3,137) | 2,75 ± 0,55 (95 % KI, 2,608–2,892) | 2,56 ± 0,45 (95 % KI, 2,444–2,676) | ANOVA F = 12,33 | <0,001 | η² = 0,122 | |
| Kognitive Belastung | 3,21 ± 0,48 (95 % KI, 3,086–3,334) | 2,87 ± 0,52 (95 % KI, 2,736–3,004) | 2,73 ± 0,44 (95 % KI, 2,616–2,844) | ANOVA F = 15,79 | <0,001 | η² = 0,151 | |
| Gesamtzufriedenheit | 3,59 ± 0,45 (95 % KI, 3,474–3,706) | 3,96 ± 0,44 (95 % KI, 3,846–4,074) | 4,37 ± 0,31 (95 % KI, 4,290–4,450) | ANOVA F = 55,67 | <0,001 | η² = 0,386 | |
| Simulator-Krankheit | 2,52 ± 0,55 (95 % KI, 2,378–2,662) | 2,44 ± 0,58 (95 % KI, 2,290–2,590) | 2,12 ± 0,56 (95 % KI, 1,975–2,265) | ANOVA F = 8,47 | <0,001 | η² = 0,087 | |
| Verhaltensverlaufs-Ergebnisse | Abschlusszeit (min) | 19,11 ± 2,63 (95 % KI, 18,431–19,789) | 17,42 ± 2,77 (95 % KI, 16,704–18,136) | 14,93 ± 2,32 (95 % KI, 14,331–15,529) | ANOVA F = 39,85 | <0,001 | η² = 0,311 |
| Verweildauer (min) | 11,17 ± 2,03 (95 % KI, 10,646–11,694) | 12,24 ± 2,04 (95 % KI, 11,713–12,767) | 13,39 ± 2,28 (95 % KI, 12,801–13,979) | ANOVA F = 16,46 | <0,001 | η² = 0,157 | |
| Gehstrecke (m) | 234,88 ± 24,34 (95 % KI, 228,592–241,168) | 217,95 ± 24,33 (95 % KI, 211,665–224,235) | 201,86 ± 23,47 (95 % KI, 195,797–207,923) | ANOVA F = 28,28 | <0,001 | η² = 0,242 | |
| Anzahl der Zögern | 7,10 ± 1,80 (95 % KI, 6,635–7,565) | 5,51 ± 1,79 (95 % KI, 5,048–5,972) | 4,07 ± 1,99 (95 % KI, 3,556–4,584) | ANOVA F = 39,74 | <0,001 | η² = 0,310 | |
| Heatmap-Abdeckung (%) | 66,18 ± 9,40 (95 % KI, 63,752–68,608) | 74,14 ± 7,93 (95 % KI, 72,091–76,189) | 84,40 ± 9,47 (95 % KI, 81,954–86,846) | ANOVA F = 62,33 | <0,001 | η² = 0,413 |
Tabelle 2: Algorithmische und teilnehmendenbezogene Ergebnisse über die drei Layout-Bedingungen hinweg. Diese Tabelle zeigt Ergebnisse zur Algorithmusleistung, zum Besuchererlebnis und zu Verhaltensverläufen für die Bedingungen Manuelles Layout, Standard-Simuliertes-Annealing (Standard SA) und Adaptives Simuliertes Annealing mit Wiedererwärmung (Adaptive SA-R). Die Vergleiche der Algorithmusleistung basieren auf n = 30 unabhängigen Optimierungsläufen pro algorithmischer Bedingung. Die vergleichende Analyse auf Teilnehmerebene basiert auf n = 60 Teilnehmern pro Layoutbedingung. Die Werte sind als Mittelwert ± SD mit 95 %-Konfidenzintervallen für den Mittelwert angegeben. Bei den algorithmischen Ergebnissen enthält die Spalte „Statistischer Test“ zusätzlich die mittlere Differenz zwischen den Algorithmen und deren 95 %-Konfidenzintervall. Die Spalten p-Wert und Effektgröße liefern das entsprechende inferenzstatistische Ergebnis. Detaillierte paarweise Vergleiche zur Teilnehmerempfindlichkeit sind in der ergänzenden Tabelle S1 dargestellt. SD = Standardabweichung; CI = Konfidenzintervall; ANOVA = Varianzanalyse; SA = Simuliertes Annealing; SA-R = Adaptives Simuliertes Annealing mit Wiedererwärmung; η2 = Eta-Quadrat; d = Cohens d.
Zusatzdatei 1. Hardware-, Software- und Umweltüberwachungsressourcen. Hardware-, Software- und Umweltüberwachungsressourcen werden für räumliche Optimierungs- und Virtual-Reality-Experimente verwendet. Bitte klicken Sie hier, um diese Datei herunterzuladen.
Zusatzdatei 2. Teilnehmerauswahl und Fragebogen-/Codebuch-Rahmenwerk. Kriterien zur Auswahl der Teilnehmer sowie Informationen zum Fragebogen/Codebuch, einschließlich der Untersuchungsbereiche, Bewertungsbereiche und Berichtskonventionen, die für die Teilnehmerergebnisse verwendet wurden. Bitte klicken Sie hier, um diese Datei herunterzuladen.
Zusatzdatei 3. Adaptives SA-R-Pseudocode und Analyse-Ressourcen. Pseudocode für den adaptiven SA-R-Arbeitsablauf, einschließlich der vier Vorschlagskerne, zusammen mit Softwareabhängigkeiten, Variablendefinitionen und Beschreibungen der Dateien für die Abbildungen. Bitte klicken Sie hier, um diese Datei herunterzuladen.
Ergänzungstabelle 1. Paarweise Sensitivitätsvergleiche der Teilnehmerergebnisse. Die paarweisen Sensitivitätsvergleiche wurden anhand der Gruppenmittelwerte, Standardabweichungen und Stichprobengrößen berechnet. Bitte klicken Sie hier, um diese Datei herunterzuladen.
Diskussion
Die vorliegende Studie bewertete einen reproduzierbaren Workflow für die Ausstellungsplanung, der ein gewichtetes räumliches Kostenmodell, adaptives simuliertes Annealing mit erneuter Erwärmung und Teilnachertests in virtueller Realität kombiniert. Innerhalb des vorgegebenen Szenarios von 36 m x 24 m erzielte die adaptive Planung eine geringere räumliche Kostenbelastung als das Standard-simulierte Annealing und war mit höherer Zufriedenheit, stärkerer Präsenz, klarerer Orientierung, kürzeren Wegen, weniger Zögern und umfassenderer räumlicher Abdeckung verbunden. Der Begriff „optimiert“ wird hier im eingeschränkten mathematischen Sinne verwendet, um einen niedrigeren Wert der festgelegten Kostenfunktion unter den genannten Bedingungen zu beschreiben; er impliziert nicht, dass die Planung global optimal hinsichtlich ästhetischer Qualität, emotionaler Wirkung, narrativer Abfolge oder sämtlicher möglicher Ausstellungsziele ist. Die räumliche Konfiguration kann Bewegung, Sichtbarkeit und kognitive Zugänglichkeit30,31 beeinflussen, doch die Gestaltungsqualität bleibt eine mehrkriterielle, menschenzentrierte Beurteilung.
Die Teilnehmerergebnisse liefern eine nützliche, wenn auch begrenzte zusätzliche Validierungsebene, da mehrere Ergebnisse keine direkten Terme der Zielfunktion waren. Die allgemeine Zufriedenheit, Präsenz, kognitive Belastung, Simulatorschwindel, Verweildauer und Heatmap-Abdeckung wurden nach der Layouterstellung erfasst, nicht während der Suche minimiert. Die Richtung dieser Ergebnisse legt daher nahe, dass das Layout mit geringeren Kosten kein bloßes mathematisches Artefakt der Verringerung der Gehdistanz war32. Gleichzeitig blieb die Validierung auf eine Einzelbenutzer-Virtuelle-Umgebung beschränkt. Vorherige Vertrautheit mit Virtual-Reality kann die Navigationskomfort und -leistung beeinflussen; obwohl dies als kontextuelle Variable erfasst wurde, war die vorliegende Studie nicht ausreichend dimensioniert, um gruppenspezifische oder Interaktionseffekte zu schätzen. Die Ergebnisse sollten daher als randomisierte Vergleiche zwischen verschiedenen Layouts interpretiert werden, nicht als Beleg dafür, dass demografische oder erfahrungsbezogene Faktoren keinen Einfluss haben33,34.
Der algorithmische Vergleich sollte ebenfalls konservativ interpretiert werden. Die formale Herleitung der vier Vorschlagskerne zeigt, dass die bedingten Vorschlagsdichten für vorwärts und rückwärts symmetrisch sind, wenn die zulässigen Bewegungen umkehrbar sind; folglich beträgt das Hastings-Verhältnis 1, und die implementierte Akzeptanzregel entspricht der Standard-Metropolis-Regel innerhalb des simulierten Annealings. Der Beitrag stellt daher keinen neuen Metropolis-Hastings-Algorithmus dar, sondern eine domänenspezifische Konfiguration, die bewegungsabhängige Auswahl von Schritten, erneutes Aufheizen, explizite Zulässigkeitsbedingungen und die reproduzierbare Validierung in einer virtuellen Umgebung umfasst. Das Standard-simulierte Annealing dient als kontrollierter Vergleich, da es dieselbe Kodierung, Zielsetzung, Nebenbedingungen, Initialisierung, Abkühlungsstrategie und nominale Laufbudgets teilt. Das vorliegende Experiment beinhaltete keine numerischen Vergleichsläufe mit genetischen Algorithmen (GA), Partikelschwarmoptimierung (PSO), Ameisenkolonieoptimierung (ACO) oder lernbasierten Methoden; die Aussagen beschränken sich daher auf den vergleichbaren Standard-SA-Basismodell. Die kombinierte Konfiguration isoliert zudem nicht die einzelnen Effekte der Planung der Vorschlagsschritte und des erneuten Aufheizens.
Der praktische Kompromiss war für die getestete Problemgröße günstig, sollte jedoch ohne zusätzliche Benchmarking-Untersuchungen nicht verallgemeinert werden. Im Vergleich zum standardmäßigen simulierten Annealing stieg die Laufzeit um 16,8 %, während die endgültigen räumlichen Kosten um 10,7 % niedriger lagen und die Anzahl der Iterationen bis zur besten Lösung um 22,0 % geringer war. Dies legt nahe, dass die zusätzliche adaptive Steuerung im vorliegenden Ein-Etagen-Modell rechentechnisch vertretbar war. Die Zielfunktionsgewichte blieben auch bei Störungen von ±10 % in ihrer Wirkrichtung robust, doch wurden die Gewichte bewusst szenariospezifisch festgelegt: Routeneffizienz und Überfüllung wurden gegenüber Umgebungskomfort und Interaktionsbalance priorisiert. Künstlerische, historische, wissenschaftliche oder kommerzielle Ausstellungen können durchaus andere Prioritäten setzen, einschließlich nichtlinearer Besucherführung und narrativer Übergänge, die von einer auf Routeneffizienz ausgerichteten Kostenfunktion andernfalls bestraft würden. Die Optimierung sollte daher als Entscheidungsunterstützungsschicht verwendet werden, die Kompromisse explizit macht, nicht jedoch als Ersatz für kuratorische oder architektonische Urteile35.
Mehrere Einschränkungen definieren die Grenzen der vorliegenden Schlussfolgerungen. Erstens basierte die Validierung auf einer einzigen rechteckigen, einstöckigen virtuellen Ausstellung und jeweils einem einzelnen Teilnehmer; größere Hallen, unregelmäßige Geometrien, mehrstöckige Erschließung, gleichzeitige Gruppenbewegung, zwischenmenschliche Ausweichmanöver, dynamische Staus, körperliche Ermüdung und reale Umweltablenkungen wurden nicht getestet. Zweitens enthielt der Vergleichsansatz keine repräsentativen evolutionären, schwarmintelligenten oder lernbasierten Optimierer, und kein Experiment mit Komponenten-Ablation trennte die Effekte der phasenabhängigen Vorschlagswahrscheinlichkeiten von der erneuten Erwärmung. Drittens bleiben die Bewertungen der Teilnehmer teilweise subjektiv, und frühere Erfahrungen mit virtueller Realität können die Navigation und das Wohlbefinden beeinflussen, selbst bei randomisierter Zuordnung; die Studie war nicht für eine Subgruppen- oder Moderatoranalyse konzipiert. Viertens wurden zwar Zufriedenheit, Präsenzgefühl, kognitive Belastung, Simulatorschwindel, Verweildauer und Heatmap-Abdeckung erfasst, die jedoch keine expliziten räumlichen Kosten darstellen; unabhängige Endpunkte wie Aufmerksamkeit, emotionale Reaktion, Lernwirksamkeit oder Langzeitgedächtnis wurden in der Studie nicht erhoben. Fünftens kann die räumliche Kostenfunktion qualitative Dimensionen wie emotionale Reaktion, kuratorische Erzählung, Überraschung, Sinnstiftung oder Langzeitgedächtnis nicht direkt abbilden. Sechstens könnte eine kurze Exposition gegenüber virtueller Realität die Unannehmlichkeiten unterschätzen, die sich bei längeren Sitzungen entwickeln36,37. Diese Einschränkungen bedeuten, dass das Framework als reproduzierbarer Arbeitsablauf für das getestete Szenario betrachtet werden sollte und nicht als allgemein validierter Optimierer für alle Ausstellungsumgebungen.
Zukünftige Arbeiten sollten den Rahmen in größeren, unregelmäßigen und mehrstöckigen Räumen testen; die Simulation von Mehrbenutzer-Massen sowie physische oder Mixed-Reality-Validierung einbeziehen; objektive Endpunkte für Aufmerksamkeit, emotionale Reaktion, Lernen und verzögertes Gedächtnis hinzufügen; und eine schrittweise Ablation der phasenabhängigen Vorschlagsplanung und Nachheizung durchführen. Die algorithmische Wettbewerbsfähigkeit sollte unter vergleichbaren Rechenbudgets gegenüber repräsentativen Alternativen wie NSGA-II38, Particle-Swarm-Optimierung39 und Ant-System/Ameisenkolonie-Optimierung40 getestet werden, wobei die methodeinspezifische Parametertuning transparent berichtet werden muss. Die erweiterte Erfassung ausstellungsspezifischer Präferenzen könnte zudem die objektiven Gewichtungen neu kalibrieren, wenn Ziele bezüglich Erzählreihenfolge, Barrierefreiheit, pädagogischer Wirksamkeit, emotionalem Engagement oder Verweildauer von dem vorliegenden Szenario abweichen. Diese Erweiterungen würden Skalierbarkeit, Übertragbarkeit und algorithmische Wettbewerbsfähigkeit bewerten, ohne vorauszusetzen, dass eine feste Kostenfunktion das beste Ausstellungserlebnis definiert.
Offenlegungen
Die Autoren erklären, dass keine konkurrierenden finanziellen Interessen bestehen.
Danksagungen
Die Autoren danken den Teilnehmern, die an der Bewertung der Virtual-Reality-Ausstellung teilgenommen haben. Die Autoren danken außerdem der School of Art and Design und dem College of Information and Management Science der Henan Agricultural University für ihre Unterstützung bei der Entwicklung und Evaluierung des Workflows für den immersiven Ausstellungsraum-Design. Die Studie erhielt keine externe Finanzierung. Die Arbeit wurde aus den eigenen Mitteln der Autoren sowie den regulären institutionellen Einrichtungen der Henan Agricultural University unterstützt.
Materialien
| Name | Unternehmen | Katalognummer | Kommentare |
|---|---|---|---|
| 3D-Modellierungssoftware | Blender Foundation | N/V | Blender 4.0.2; dient zur Erstellung der Geometrie des Ausstellungsraums, thematischer Zonen, Trennwände und räumlicher Elemente. RRID:SCR_008606 |
| Analyseskripte | Individuelle Forschungsskripte | N/V | Version 1.0; zur statistischen Analyse, Sensitivitätsanalyse, Berechnung von Konfidenzintervallen und Aufbereitung von Daten für Abbildungen. |
| Kohlendioxid-Monitor | Testo SE & Co. KGaA | testo 535; 0563 0535 | Digitaler CO2-Messgerät; Messbereich 0–10.000 ppm; dient als protokollgesteuerter Kontrollcheck der Kohlendioxidkonzentration unter vorgegebenen Umweltbedingungen. |
| Desktop-Workstation | Dell Technologies | Precision 3660 Tower | 32 GB RAM; dient zum Rendern virtueller Szenen, zur Simulation von Layouts, zur Ausführung von Algorithmen und zur Protokollierung der Teilnehmersitzungen. |
| Skripte zur Abbildungserstellung | Individuelle Forschungsskripte | N/V | Version 1.0; zur Erstellung von Leistungsdiagrammen für Algorithmen, Darstellung von Teilnehmerergebnissen und Trajektorien-Heatmaps. |
| Spiele-Engine / VR-Plattform | Unity Technologies | N/V | Unity 2022.3.22f1 LTS; dient zum Erstellen und Ausführen der virtuellen Ausstellungsszenen. |
| Kopfgetragenes Display | Meta Platforms, Inc. | Meta Quest 2 (128 GB) | Standalone-HMD mit 6 Freiheitsgraden; 1832 × 1920 Pixel pro Auge; 90-Hz-Aktualisierungsrate; dient zur Darstellung der immersiven Virtual-Reality-Szene und zur Verfolgung der Teilnehmerbewegung. |
| Beleuchtungsstärkemessgerät | Testo SE & Co. KGaA | testo 540; 0560 0540 | Digitaler Luxmeter; Messbereich 0–99.999 lx; dient als protokollgesteuerter Kontrollcheck der Beleuchtungsstärke unter vorgegebenen Umweltbedingungen. |
| NumPy | NumPy-Entwickler | N/V | Version 1.26.4; dient für numerische Array-Operationen und Datenaufbereitung. RRID:SCR_008633 |
| Optimierungsskript | Individuelles Forschungsskript | N/V | Python 3.11, Version 1.0; implementiert Standard-Simuliertes-Annealing (Standard SA) und Adaptives Simuliertes Annealing mit Wiedererwärmung (Adaptive SA-R), einschließlich stufenabhängiger Vorschlagsauswahl, Metropolis-Akzeptanz und Wiedererwärmung. |
| pandas | pandas-Entwicklungsteam | N/V | Version 2.1.4; dient zur Bereinigung von Datensätzen, Tabellierung und Aufbereitung von daten für Abbildungen. RRID:SCR_018214 |
| Teilnehmer-Screening-Formular | Individuelles Forschungsformular | N/V | Version 1.0; dient zur Erfassung der Eignung, demografischer Variablen, bisheriger Virtual-Reality-Erfahrung sowie der Besuchshäufigkeit von Museen und Ausstellungen. |
| Bewertungsbogen nach der Erfahrung | Individuelles Forschungsformular | N/V | Version 1.0; 7-Punkte-Antwortskalen; dient zur Beurteilung der Interaktionsqualität, Orientierungsklarheit, visuellen/akustischen/thermischen Komfortempfindung, wahrgenommener Besucheranzahl, kognitiven Belastung und der Gesamtzufriedenheit. |
| Bewertungsbogen für Präsenz und räumliche Präsenz | Individuelles Forschungsformular | N/V | Version 1.0; studienspezifische 7-Punkte-Bereichswerte, interpretiert im Kontext der PQ/IPQ-Modelle; standardmäßige Gesamtscores nach PQ oder IPQ wurden nicht berichtet. |
| Python-Programmiersprache | Python Software Foundation | N/V | Version 3.11; dient zur Ausführung von Algorithmen, Berechnung von Kostenfunktionen, Datenverarbeitung und Sensitivitätsanalyse. RRID:SCR_008394 |
| SciPy | SciPy-Community | N/V | Version 1.11.4; dient für statistische Tests und unterstützende numerische Analysen. RRID:SCR_008058 |
| Bewertungsbogen für Simulatorschwindel | Individuelles Forschungsformular | N/V | Version 1.0; vorgegebene 0–30-Studienzusammenfassung basierend auf dem SSQ-Symptomrahmen; unterscheidet sich vom standardmäßigen gewichteten SSQ-Gesamtschweregrad. |
| Schallpegelmessgerät | Testo SE & Co. KGaA | testo 816-1; 0563 8170 | IEC 61672-1 Klasse 2; 30–130 dB; A/C-Frequenzbewertung; dient als protokollgesteuerter Kontrollcheck des Schalldruckpegels unter vorgegebenen Umweltbedingungen. |
| Tabellenkalkulationssoftware | Microsoft | N/V | Microsoft Excel 2021; dient zur Organisation von Datensätzen, Erstellung von Codebüchern und ergänzenden Tabellendateien. RRID:SCR_016137 |
| Statistiksoftware | IBM | N/V | IBM SPSS Statistics 27.0; dient für ANOVA, Welch-Tests, Prüfung von Annahmen und ergänzende statistische Verifizierungen. RRID:SCR_002865 |
| Temperaturmonitor | Testo SE & Co. KGaA | testo 605i; 0560 2605 03 | Thermohygrometer; Temperaturbereich −20 bis +60 °C; Auflösung 0,1 °C; dient als protokollgesteuerter Kontrollcheck der Umgebungstemperatur unter vorgegebenen Umweltbedingungen. |
| VR-Integrationspaket | Unity Technologies | N/V | XR Interaction Toolkit 2.5.4; dient für VR-Interaktionen, Bewegungssteuerung, Auslöseereignisse und Trajektorien-Protokollierung. |
| HINWEIS: Biologische Ressourcen wurden in dieser Studie nicht verwendet. RRIDs werden für anwendbare Forschungsressourcen bereitgestellt. |
Referenzen
- Falk JH, Dierking LD. The museum experience revisited. Left Coast Press; Walnut Creek, CA; 2013.
- Hillier B, Hanson J. The social logic of space. Cambridge University Press; Cambridge; 1984.
- Turner A, Doxa M, O'Sullivan D, Penn A. From isovists to visibility graphs: a methodology for the analysis of architectural space. Environ Plan B Plan Des. 2001;28:103-21.
- Kuliga SF, Thrash T, Dalton RC, Hölscher C. Virtual reality as an empirical research tool: exploring user experience in a real building and a corresponding virtual model. Comput Environ Urban Syst. 2015;54:363-75.
- Radianti J, et al. A systematic review of immersive virtual reality applications for higher education: design elements, lessons learned, and research agenda. Comput Educ. 2020;147:103778.
- Cummings JJ, Bailenson JN. How immersive is enough? A meta-analysis of the effect of immersive technology on user presence. Media Psychol. 2016;19:272-309.
- Witmer BG, Singer MJ. Measuring presence in virtual environments: a presence questionnaire. Presence-Teleop Virt. 1998;7:225-40.
- Makransky G, Petersen GB. The Cognitive Affective Model of Immersive Learning: a theoretical research-based model of learning in immersive virtual reality. Educ Psychol Rev. 2021;33:937-58.
- Kennedy RS, Lane NE, Berbaum KS, Lilienthal MG. Simulator Sickness Questionnaire: an enhanced method for quantifying simulator sickness. Int J Aviat Psychol. 1993;3:203-20.
- Kirkpatrick S, Gelatt CD Jr, Vecchi MP. Optimization by simulated annealing. Science. 1983;220:671-80.
- Metropolis N, et al. Equation of state calculations by fast computing machines. J Chem Phys. 1953;21:1087-92.
- Hastings WK. Monte Carlo sampling methods using Markov chains and their applications. Biometrika. 1970;57:97-109.
- Aarts EHL, Korst JHM. Simulated annealing and Boltzmann machines: a stochastic approach to combinatorial optimization and neural computing. John Wiley & Sons; Chichester; 1989.
- Van Laarhoven PJM, Aarts EHL. Simulated annealing: theory and applications. D. Reidel Publishing Company; Dordrecht; 1987.
- Bertsimas D, Tsitsiklis J. Simulated annealing. Stat Sci. 1993;8:10-5.
- Talbi EG. Metaheuristics: from design to implementation. John Wiley & Sons; Hoboken, NJ; 2009.
- Sörensen K. Metaheuristics: the metaphor exposed. Int Trans Oper Res. 2015;22:3-18.
- Hillier B. Space is the machine: a configurational theory of architecture. Cambridge University Press; Cambridge; 1996.
- Lolli F, et al. Post-Occupancy Evaluation's (POE) applications for improving indoor environment quality (IEQ). Toxics. 2022;10:626.
- Ministry of Housing and Urban-Rural Development of the People's Republic of China, State Administration for Market Regulation. GB/T 50034-2024 Standard for lighting design of buildings. Beijing; 2024.
- State Administration for Market Regulation, Standardization Administration of China. GB/T 23863-2024 Specification for lighting design of museum. Beijing; 2024.
- State Administration for Market Regulation, Standardization Administration of China. GB/T 18883-2022 Standards for indoor air quality. Beijing; 2022.
- Ministry of Housing and Urban-Rural Development of the People's Republic of China, General Administration of Quality Supervision, Inspection and Quarantine. GB/T 50785-2012 Evaluation standard for indoor thermal environment in civil buildings. Beijing; 2012.
- Ministry of Environmental Protection of the People's Republic of China, General Administration of Quality Supervision, Inspection and Quarantine. GB 3096-2008 Environmental quality standard for noise. Beijing; 2008.
- Chib S, Greenberg E. Understanding the Metropolis-Hastings algorithm. Am Stat. 1995;49:327-35.
- Slater M, Sanchez-Vives MV. Enhancing our lives with immersive virtual reality. Front Robot AI. 2016;3:74.
- Schubert T, Friedmann F, Regenbrecht H. The experience of presence: factor analytic insights. Presence-Teleop Virt. 2001;10:266-81.
- Stanney KM, Kennedy RS, Drexler JM. Cybersickness is not simulator sickness. Proc Hum Factors Ergon Soc Annu Meet. 1997;41:1138-42.
- Blum C, Roli A. Metaheuristics in combinatorial optimization: overview and conceptual comparison. ACM Comput Surv. 2003;35:268-308.
- Benedikt ML. To take hold of space: isovists and isovist fields. Environ Plan B Plan Des. 1979;6:47-65.
- Penn A. Space syntax and spatial cognition: or why the axial line? Environ Behav. 2003;35:30-65.
- Sherman WR, Craig AB. Understanding virtual reality: interface, application, and design. Morgan Kaufmann; San Francisco, CA; 2003.
- Slater M. Place illusion and plausibility can lead to realistic behaviour in immersive virtual environments. Philos Trans R Soc Lond B Biol Sci. 2009;364:3549-57.
- Sweller J. Cognitive load during problem solving: effects on learning. Cogn Sci. 1988;12:257-85.
- Heydarian A, Carneiro JP, Gerber D, Becerik-Gerber B. Immersive virtual environments versus physical built environments: a benchmarking study for building design and user-built environment explorations. Autom Constr. 2015;54:116-26.
- Rebenitsch L, Owen C. Review on cybersickness in applications and visual displays. Virtual Real. 2016;20:101-25.
- Clay V, König P, König SU. Eye tracking in virtual reality. J Eye Mov Res. 2019;12:3.
- Deb K, Pratap A, Agarwal S, Meyarivan T. A fast and elitist multiobjective genetic algorithm: NSGA-II. IEEE Trans Evol Comput. 2002;6:182-97.
- Kennedy J, Eberhart RC. Particle Swarm Optimization. Proc IEEE Int Conf Neural Netw. 4, 1942-1948.
- Dorigo M, Maniezzo V, Colorni A. Ant system: optimization by a colony of cooperating agents. IEEE Trans Syst Man Cybern B Cybern. 1996;26:29-41.