Bird strike experiments and SPR4-based simplified numerical simulations were performed on Ti-6Al-4V titanium alloy riveted panels. The results demonstrate that simplified rivet modeling can accurately reproduce the experimental impact response, supporting its applicability to aircraft bird-strike analysis.
Forschungsartikel
Experimental Study and Simplified Numerical Simulation of Bird Strike on Ti-6Al-4V Titanium Alloy Riveted Panels
In diesem Artikel
Zusammenfassung
Zusammenfassung
Bird strikes pose a significant threat to aircraft safety. Riveted panels, which are widely used in aircraft structures, may be vulnerable to failure under impact loading. Accurately predicting the response of multi-rivet connections during bird strikes is important for structural design; however, detailed numerical modeling of numerous rivets requires explicit representation of small-scale rivet geometries within the overall structural model. Simplified connection elements provide an alternative representation, but their applicability to bird-strike scenarios involving complex coupled loading conditions has rarely been validated. This study investigated the impact response of Ti-6Al-4V titanium alloy panels fastened with multiple metal rivets under bird-strike loading. Bird-strike experiments were conducted using a high-speed gas-gun system, and high-speed cameras captured structural deformation and failure. A corresponding simplified finite element model was subsequently established, in which shell elements represented the panels and simplified connection elements represented the rivets. The experimental and numerical results showed good agreement in the critical failure velocity (within 9.58% error), the impact process, the failure mode, and the backside response of the target panel. These findings demonstrate the feasibility of using simplified connection elements to represent rivets in numerical simulations of bird impacts on multi-riveted structures.
Einleitung
Rivets are commonly used fasteners in engineering applications, primarily relying on the deformation of the rivet shank to form a head that joins components together. A modern large aircraft requires hundreds of thousands of rivets during assembly1,2,3. Bird strike incidents pose a significant threat to aircraft flight safety, and with the rapid development of the civil aviation industry in recent years, the incidence of bird-strike accidents has increased sharply4,5,6,7,8,9,10. Bird strikes typically occur on the aircraft's surface, making rivet connections, as structurally vulnerable areas, particularly prone to failure5,8,11. For rivet connections susceptible to bird strikes, considering their bird-strike resistance during the structural design phase can provide greater assurance of the aircraft’s flight safety.
Multi-riveted panels are fundamental load-bearing structural components in modern aircraft fuselage and wing assemblies, wherein multiple rivet joints are arranged in single or multiple rows to transfer loads between skin panels and underlying stiffeners or frames. Due to the high cost and long production cycles of aircraft structural test specimens, aircraft manufacturers primarily rely on numerical simulation to design for impact resistance in riveted components, performing only limited, necessary ground tests for verification12,13,14,15. In numerical simulations of bird strikes on structures containing fasteners, the large number of rivets and cross-scale differences relative to the overall structure size can substantially increase model complexity when the details of the rivet connections are explicitly represented16,17,18. Therefore, connection panels are often modeled as shell elements, while rivets, bolts, and other fasteners are represented using virtual connection elements. In such simplified numerical simulations of bird strikes on riveted structures, defining the mechanical response of the virtual connection elements to match real-world rivet behavior is key to the accuracy of the simplified numerical model19,20.
For virtual connection elements, many failure criteria have been developed by researchers and applied in finite element analysis. Common failure criteria used to describe the failure of rivet or bolt connection structures are typically of the form21,22,23:
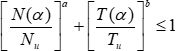 (1)
where N(α) and T(α) represent the tensile and shear components of the external load, respectively, α is the loading angle, and Nu and Tu are the maximum tensile and shear load limits that the structure can withstand. The coefficients a and b represent the tensile-shear coupling coefficients, which can be fitted based on experimental results under different loading conditions.
This form of the criterion is simple and can describe the influence of the loading state on the strength of the connection structure, making it widely used. For example, the Constrained Spot Weld simplified connection element embedded in LS-DYNA uses this failure criterion24. Building upon this failure criterion, researchers have further developed simplified models to describe the nonlinear mechanical response of connection structures. For instance, Hanssen et al.25developed a simplified single-node connection model, SPR2, based on the deformation and failure mechanisms of self-piercing riveting structures. This model allows the description of the nonlinear behavior of the connection structure from the loading phase through failure. To date, LS-DYNA has developed two improved models: SPR3 and SPR426,27. These models have been applied by many researchers, and their applicability in describing the mechanical response of individual riveted structures has been demonstrated22,28,29.
However, for typical aircraft metal rivet connections, although there has been considerable research on the mechanical behaviour of connection structures with a single rivet fastener under complex loading conditions, as well as related simplified models, studies on the bird strike mechanical performance of structures with multiple rivets and the feasibility of using simplified connection elements to replace actual rivet components in numerical simulations of bird strike impacts are still rare.
This study focuses on Ti-6Al-4V titanium alloy connection panels fastened with multiple rivets. First, bird-strike impact tests were conducted using a high-speed gas-gun system, and high-speed cameras captured the target panel's deformation and failure responses under impact. Then, a simplified bird-strike impact model of the target panel was established in LS-DYNA, in which the SPR4 simplified model was used to replace the actual rivet components. The corresponding model parameters were fitted using existing mechanical performance test results for a single-rivet connection structure. Finally, the critical failure velocity, impact deformation process, and strain responses of key points on the back of the target panel obtained from the experiments were compared with the numerical simulation results, thereby verifying the feasibility of using simplified connection elements to replace actual rivet components in numerical simulations of bird strike impacts on structures with multiple rivet fasteners.
Protokoll
Experimental methodology
Target panel and gelatin bird projectile
The test specimen was composed of an assembly of three panels connected by ten rivets, as illustrated in Figure 1A. The connection panels were made of Ti-6Al-4V titanium alloy, and MS20615-5M6 rivet fasteners were used. During test specimen preparation, the rivets were pressed with a hydraulic press, and the prepared sample is shown in Figure 1B. The backside of the target panel was equipped with seven sets of strain gauges to record strain responses at specific locations during the impact. The positions and identification numbers of the strain gauges are also indicated in Figure 1B. In structural bird-strike impact tests, using real birds as projectiles introduces significant individual variation among strikes, which may affect the results. Therefore, gelatin projectiles are commonly used as substitutes for real birds. In this experiment, cylindrical gelatin bird projectiles with a diameter of 31 mm, a length of 75 mm, and a mass of 50 g were used.
Experiment scheme
The bird strike test was conducted using a high-speed gas gun system with an 80 mm caliber. The system consisted of a high-pressure gas chamber, a launching mechanism, a barrel, a projectile holder, a projectile, and a projectile ejection device, as shown in the test setup in Figure 2. During the test, the gelatin bird projectile, mounted in the projectile holder, was accelerated by high-pressure gas within the barrel. When the projectile holder reached the rear of the barrel, it collided with the ejection device, causing the holder to stop while the gelatin projectile continued to fly forward. The projectile eventually struck the target panel at a specified location and orientation.
In the experiment, high-speed cameras were arranged at the front, rear, and side of the target panel, with all cameras set to a frame rate of 40,000 fps. Camera 1 was used to record the bird projectile's frontal-impact posture and the response at the front of the target panel. Camera 2 measured the flight speed of the bird projectile and recorded the side impact posture of the projectile. Camera 3 was used to record the backside response of the target panel. To synchronize the recording times of the three cameras, a trigger line was used to simultaneously activate all cameras during the test. Additionally, a dynamic strain gauge system was employed to synchronize and record strain data from the strain gauges on the backside of the target panel.
Numerical methodology
Simplified connection model
As mentioned in the introduction, when conducting numerical simulations of structural impact involving multiple rivet fasteners, simplified connection elements are often used in the model to replace the actual rivets, thereby simplifying the numerical representation of riveted connections. Typically, these simplified connection elements are defined as virtual elements. The key to accurately representing the mechanical behavior of the actual connected structure with virtual elements lies in defining their load-displacement response. To date, many researchers have proposed related simplified connection models, some of which have been adopted by commercial finite element software. *CONSTRAINED_INTERPOLATION_SPOTWELD, a simplified model proposed by Matthias Bier and Silke Sommer, is essentially a virtual connection element constructed based on a single node. It connects two plates by controlling the interaction forces between nodes within a specified radius around the plates, and defines the interaction force as a function of the relative displacement direction and rate between nodes on both sides. This model has been successfully incorporated into the finite element software LS-DYNA and is also referred to as the SPR4 simplified model. Over time, this model has become increasingly refined and now provides users with a simplified connection method that accounts for the effects of loading conditions and loading rates while also describing the nonlinear mechanical response of the connected structure. In this study, the simplified model was used to replace the actual rivet components during the numerical simulation. A detailed description of the model’s definition for the mechanical behavior of the connected structure can be found in Supplementary File 1.
Bird strike simulation
Based on the actual bird strike test conditions, a 1:1 bird strike finite element model was constructed in LS-DYNA, as shown in Figure 3. The model included fixtures, target plates, mounting bolts, gelatin bird pellets, and rivet connections. The units used in the numerical simulation were mm for length, tons for mass, s for time, N for load, and MPa for stress.
For modeling, the fixtures and mounting bolts were represented as solid elements with a 10 mm mesh size. The material properties were defined for an elastic body with a density of 7.85 x 10⁻⁹ ton/mm3, an elastic modulus of 210 GPa, and a Poisson's ratio of 0.33. The target plates were modeled using shell elements with a 1 mm x 1 mm mesh size, and were composed of Ti-6Al-4V titanium alloy, whose mechanical behavior was characterized using the Johnson-Cook constitutive model. The parameters for this model are provided in Table 1.
The gelatin bird projectile was modeled using Smoothed Particle Hydrodynamics (SPH) particles, with a total of 11,500 particles. The material for the bird body was defined as *MAT_NULL with a density of 1.0 x 10⁻⁹ ton/mm3, a viscosity coefficient of 0.001, and other parameters set to default values. The equation of state for the bird projectile was defined using *EOS_GRUNEISEN, with specific parameters shown in Table 230,31. Actual rivet components were replaced with SPR4 simplified connection elements, using the parameter settings provided in Table 3. The parameters of the SPR4 simplified connection model were calibrated using the load-displacement responses obtained from single-rivet tests. The initial stiffness, peak load, and failure displacement under tensile and shear loading were extracted from the experimental curves and used to determine the corresponding stiffness and failure parameters. The parameters were subsequently adjusted through iterative simulations until the predicted load-displacement responses agreed well with the experimental results. The final calibrated parameters are listed in Table 3. The detailed formulation of the SPR4 simplified connection model is provided in Supplementary File 1.
In the model, the contact between the gelatin bird pellet and the target plate was defined using the *AUTOMATIC_NODES_TO_SURFACE contact algorithm, with static and dynamic friction coefficients set to 0.2 and 0.15, respectively. All other parameters were set to default values. For other potential contact surfaces, including the bolt and fixture, the bolt and target plate, and the fixture and target plate, the *AUTOMATIC_SURFACE_TO_SURFACE contact algorithm was used.
Loading was applied according to the actual test conditions by assigning an initial velocity to the SPH gelatin bird projectile. The initial velocity was assigned using the *INITIAL_VELOCITY_GENERATION option in LS-DYNA. Boundary conditions were applied to the outer surface of the model’s frame fixture, with all degrees of freedom on this surface fixed. Moreover, a comprehensive mesh convergence study for the model was performed in advance. The mesh convergence and SPH particle sensitivity analyses showed that the numerical response remained stable when a 1 mm mesh size and 11,500 SPH particles were adopted. The corresponding results are provided in Table 4.
Ergebnisse
A total of five bird strike impact tests were conducted in this study. The gelatin projectiles used in the tests had a minimum mass of 49.1 g and a maximum mass of 51.47 g, with impact velocities ranging from 122 m/s to 171 m/s. The test results are shown in Table 5. The results indicate that no rivet failure occurred at impact velocities up to and including 160 m/s, whereas rivet failure occurred at 167 m/s and 171 m/s. This suggests that, for the current impact location and a bird mass of 50 g, the critical velocity at which the rivet fails in the target panel structure lies between 160 m/s and 167 m/s.
When the impact velocity was 160 m/s, the loading process was recorded by three high-speed cameras, as shown in Figure 4. The high-speed video footage revealed that the gelatin projectile flew smoothly after leaving the barrel and then struck the center of the target panel (the center of the grid lines) with its axis perpendicular to the panel. The projectile struck the target panel at t = 1.0 ms, causing significant compressive deformation of the gelatin. This compression deformation continued until t = 1.925 ms, during which the entire target panel exhibited noticeable bending. Subsequently, the projectile rebounded, and the target panel continued to oscillate. At this point, it was observed that the front end of the bird projectile had torn. Following the impact, no fracture occurred in the rivets of the target panel structure, but noticeable loosening was observed at the rivet connections on the panel. Additionally, the rivets showed visible deformation. Supplementary Figure 1 displays the deformation of a rivet on one side of the target panel after the impact. The axis of the rivet shank had shifted noticeably, indicating deformation in the in-plane shear direction. Furthermore, a significant gap appeared between the two riveted panels, suggesting out-of-plane tensile deformation. This indicates that the rivet deformation resulted from the coupling of shear and tensile forces.
Supplementary Figure 2 shows the strain responses collected from the strain gauges on the backside of the target panel during the 160 m/s bird strike test. The locations and identification numbers of the seven strain gauges are indicated in Figure 1B. Strain gauges 1, 3, and 5 were attached longitudinally, 2, 4, and 6 were attached transversely, and strain gauge 7 was attached at a 45° angle at the impact center. It can be observed that the strain signals from strain gauges 1, 2, and 7 quickly exceeded the gauges' ranges. This is because these three strain gauges were attached to the impact center, where the stress waves oscillated most violently, increasing the likelihood of the strain gauges detaching or the leads breaking. Therefore, strain signals that exceed the range do not represent the actual strain in this area of the target panel. For the measurement points that remained within the valid measurement range, the effective strain was less than 0.01, well below the failure strain of Ti-6Al-4V titanium alloy.
When the impact velocity was 167 m/s, the loading process was recorded by three high-speed cameras, as shown in Figure 5. The footage indicates that the bird projectile maintained a good orientation and flew smoothly after leaving the barrel, continuing this stable flight until it struck the target panel. Additionally, residual debris from the projectile holder was observed around the rear of the projectile, likely resulting from the high-speed impact between the projectile holder and the ejection device, which caused damage and fragmentation of the holder. As a result, some of the broken projectile holder fragments remained attached to the projectile.
The high-speed video footage showed that the projectile made contact with the target panel at t = 0.88 ms, causing the gelatin projectile to begin deforming. This deformation continued until t = 1.48 ms, at which point a whole row of rivets on the left side of the target panel failed. Afterward, the rivet heads from the front and back sides of the panel were ejected. Once the rivets failed, the target panel continued to oscillate, and the bird projectile was nearly completely torn apart.
It is worth noting that both the 167 m/s and 171 m/s tests, as shown in Table 5, resulted in rivet failure on one side of the target panel. However, in both tests, rivets on different sides of the target panel failed; the side on which rivet failure occurred varied between tests. This variation may be associated with individual differences among rivet fasteners and variations in bird-strike locations.
Figure 6 shows the appearance of the target panel after failure and provides cross-sectional images of the rivets. The rivet cross-section can be divided into two areas: a brittle shear zone and a sudden fracture zone, with the observed fracture morphology consistent with shear-tensile coupled failure characteristics. The figure also shows the deformation on the side of the target panel that did not fail. It can be observed that the rivets on this side underwent significant plastic deformation, exhibiting noticeable shear and tensile deformations. Specifically, the rivet shank axis was visibly deflected, and a clear gap appeared between the two connected panels. Additionally, significant bending deformation was observed at the section where the thickness transition occurred on the outer connecting panel.
The SPR4 model reproduced the ultimate load-bearing capacity with a maximum error of 9.4%, while the maximum absolute error in dynamic energy absorption was 19.3%. The simulated critical rivet-failure velocity was 151 m/s, compared with the experimental range of 160–167 m/s, corresponding to a maximum relative error of -9.58%. At an impact velocity of 167 m/s, rivet failure occurred at approximately 580 μs in the simulation and 600 μs in the experiment. The simulated impact process, strain response, and failure pattern also showed generally good agreement with the experimental observations.
Data Availability:
Data underlying the study will be made available upon reasonable request.
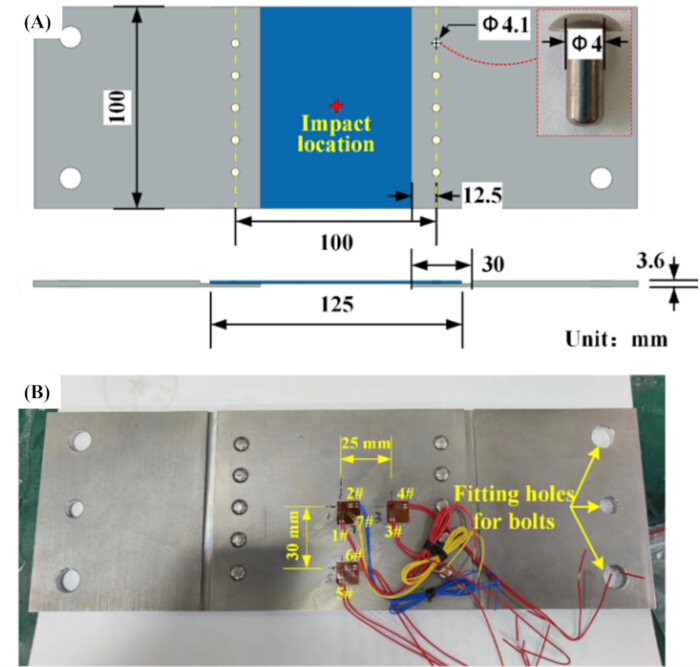
Figure 1: Configuration of the riveted target panel and strain-gauge locations. (A) Schematic of the Ti-6Al-4V target panel assembled using ten rivets, showing the specimen dimensions. (B) Prepared target panel showing the locations and identification numbers of the seven strain gauges used to measure the backside strain response during bird impact. Please click here to view a larger version of this figure.
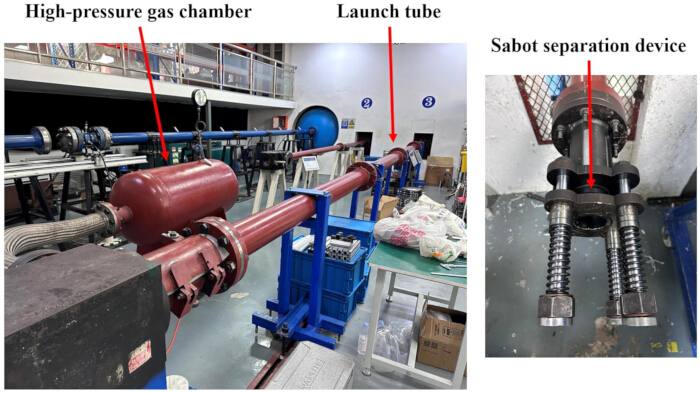
Figure 2: Bird-strike experimental setup. Photographs of the bird-strike experimental setup, showing the high-pressure gas chamber, launch tube, and sabot separation device. Please click here to view a larger version of this figure.
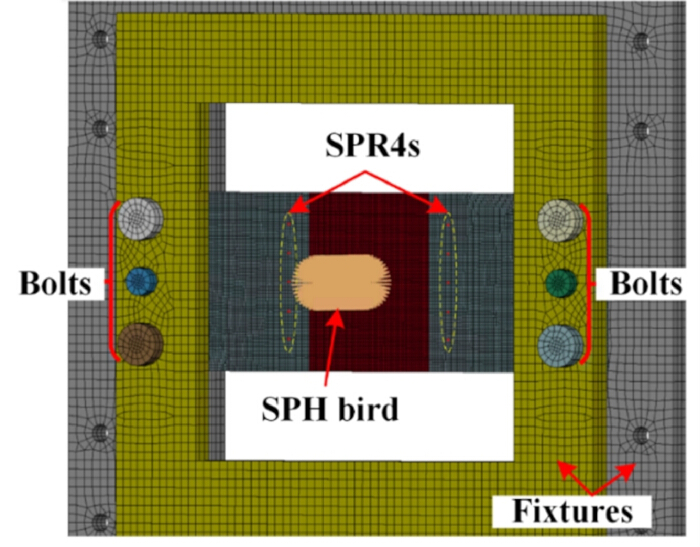
Figure 3: Finite element model of the bird-strike test. Numerical model established according to the experimental configuration, including the gelatin bird projectile, riveted target panels, fixtures, and mounting components. The gelatin bird was represented using smoothed particle hydrodynamics (SPH), and the rivets were represented using SPR4 simplified connection elements. Please click here to view a larger version of this figure.
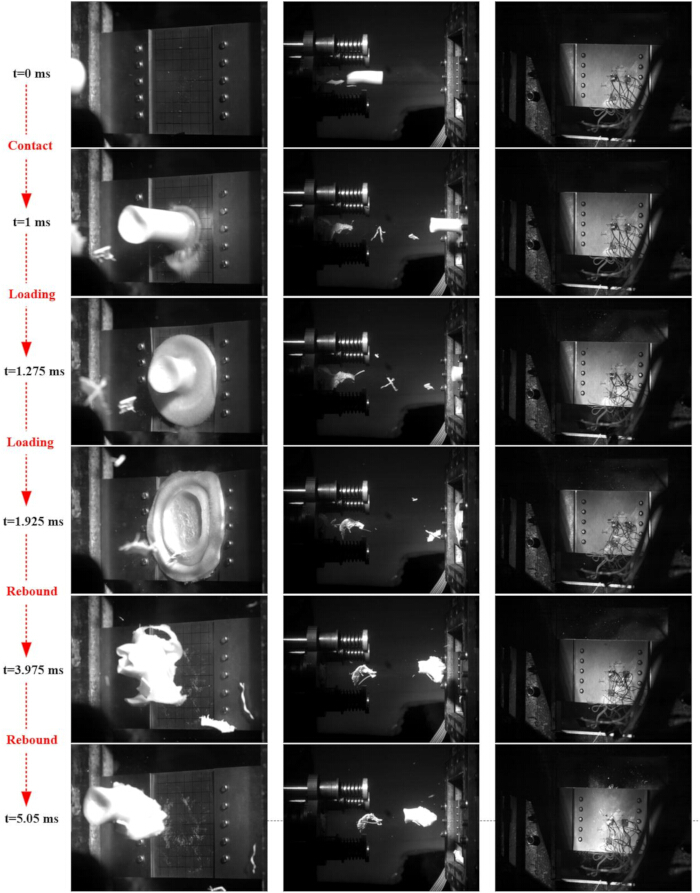
Figure 4: Experimental impact sequence at a bird-strike velocity of 160 m/s. High-speed camera images showing the gelatin projectile approaching and impacting the target panel and the subsequent deformation and rebound of the projectile and panel. Images obtained from the front, side, and rear camera views are shown at successive stages of impact. Please click here to view a larger version of this figure.
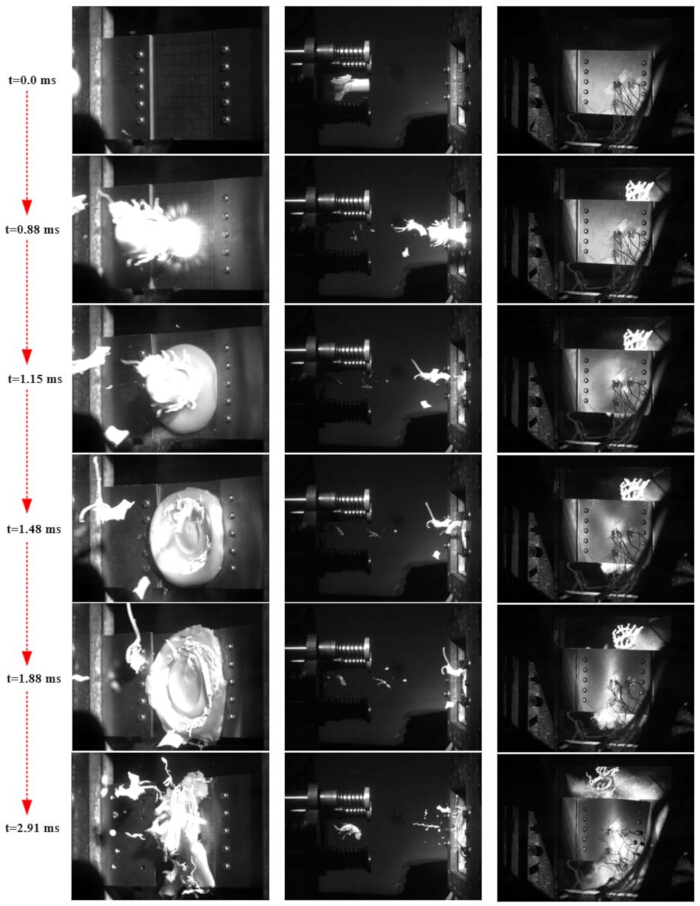
Figure 5: Experimental impact and rivet-failure sequence at a bird-strike velocity of 167 m/s. High-speed camera images from the front, side, and rear views showing projectile impact, deformation, and failure of a row of rivets on one side of the target panel. Images are shown at representative times from initial contact through rivet failure. Please click here to view a larger version of this figure.
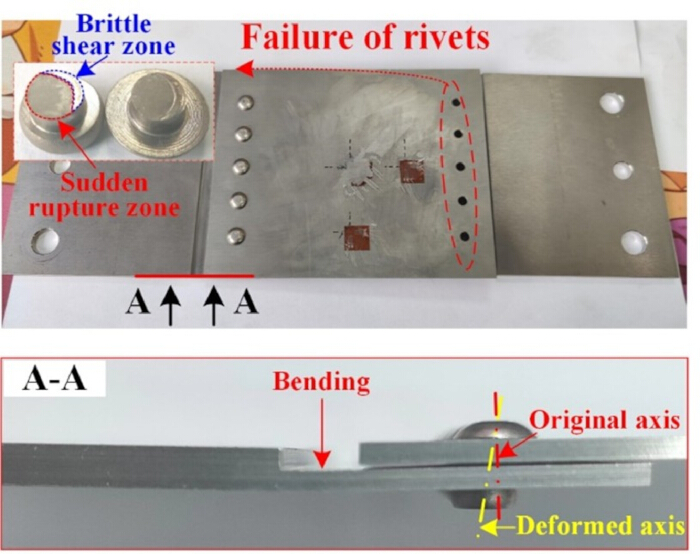
Figure 6: Target-panel and rivet failure after bird impact at 167 m/s. Overall view of the impacted target panel, showing the failure of rivets on one side, and a cross-sectional view along A–A. The enlarged rivet view identifies the brittle shear and sudden rupture zones, while the cross-sectional view shows bending and displacement of the rivet axis associated with combined shear and tensile deformation. Please click here to view a larger version of this figure.
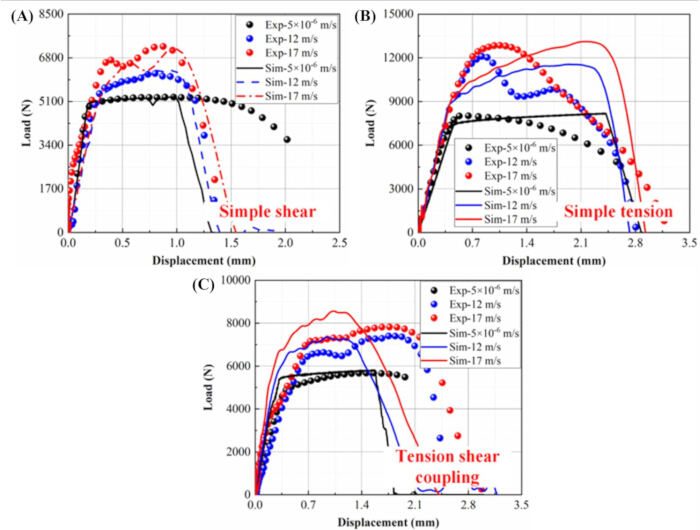
Figure 7: Comparison of experimental and simulated load-displacement responses of the riveted joint. Experimental (Exp) and numerical simulation (Sim) results obtained at different loading rates under (A) simple shear, (B) simple tension, and (C) 45° tension-shear coupled loading. Please click here to view a larger version of this figure.
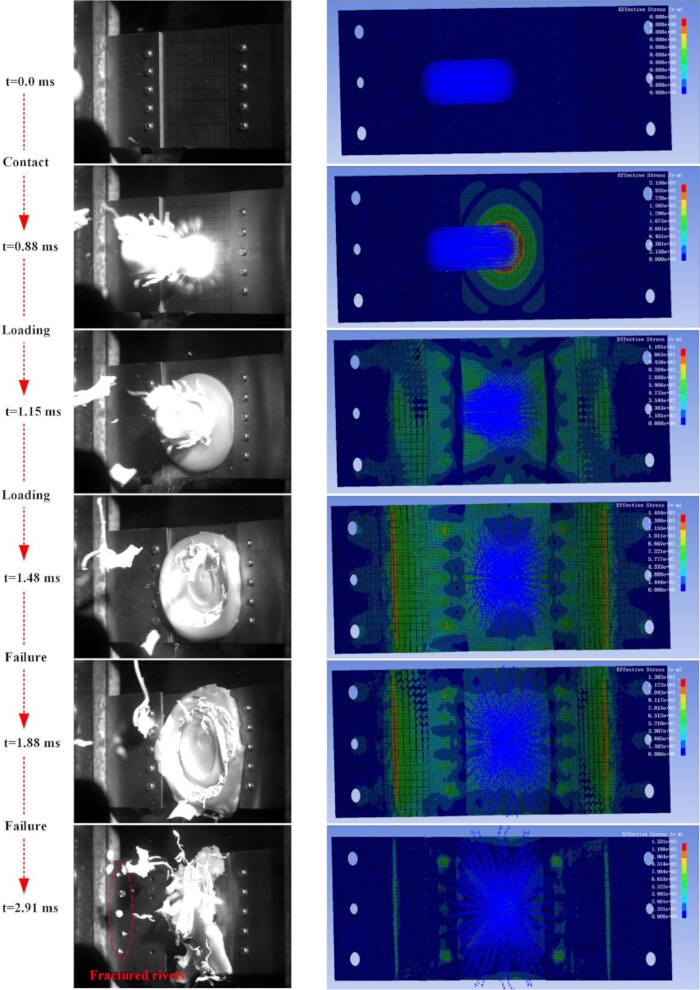
Figure 8: Comparison of experimental and simulated dynamic responses during bird impact at 167 m/s. High-speed experimental images and corresponding numerical simulation results at successive stages of impact, showing projectile contact, deformation, and loading of the target panel, and rivet failure. Please click here to view a larger version of this figure.
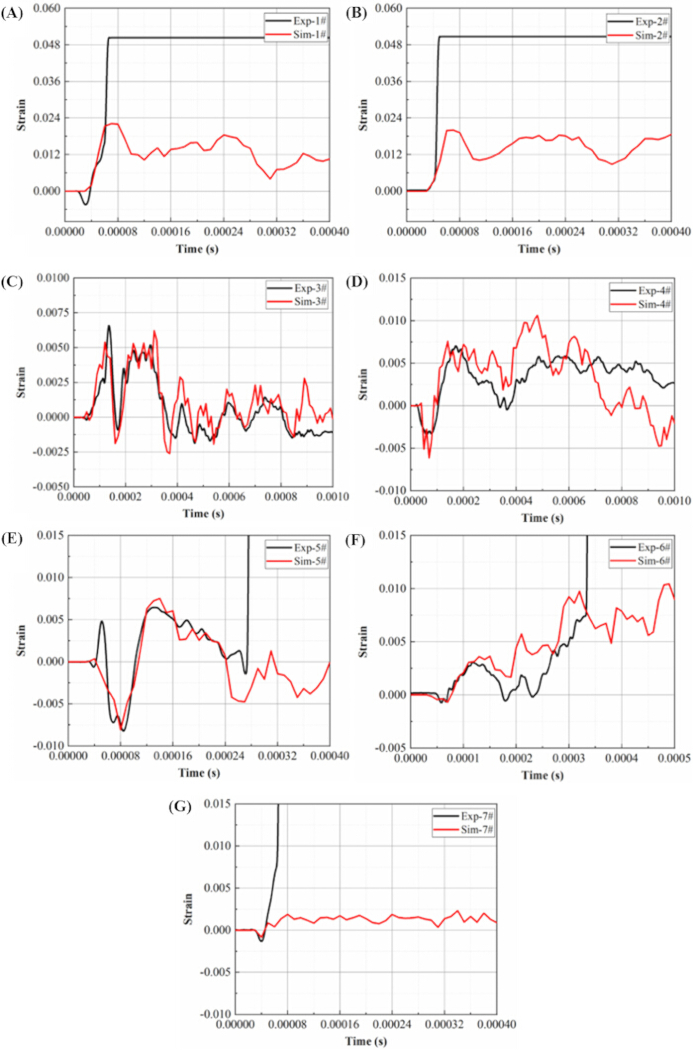
Figure 9: Comparison of experimental and simulated strain responses of the target panel. Experimental (Exp) and simulated (Sim) strain-time histories at strain-gauge locations (A) 1, (B) 2, (C) 3, (D) 4, (E) 5, (F) 6, and (G) 7. Experimental signals from gauges 1, 2, and 7 exceeded the measurement range during impact and should not be interpreted as valid strain magnitudes. Please click here to view a larger version of this figure.
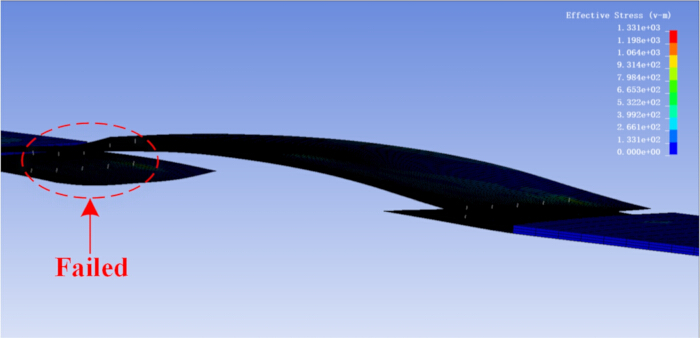
Figure 10: Simulated rivet failure during bird impact. Numerical simulation showing failure of the SPR4 connection elements on the left side of the target panel after introducing the experimentally observed 5 mm rightward offset of the bird-impact location. Please click here to view a larger version of this figure.
| Constitutive parameters | A (MPa) | B (MPa) | N | C | m |
| 1019.5 | 674.1 | 0.44 | 0.003 | 0.457 | |
| Failure parameters | D1 | D2 | D3 | D4 | D5 |
| 0.021 | 0.132 | -1.1 | 0.0238 | 3.451 |
Table 1: Johnson-Cook constitutive parameters for Ti-6Al-4V alloy. Material parameters used in the Johnson-Cook constitutive model to describe the mechanical response of the Ti-6Al-4V target panels in the numerical simulations.
| C (mm/s) | S1 | S2 | S3 | GAMMA0 | A | E0 (mJ) | V0 (mm3) |
| 1650000 | 2.56 | 1.986 | 1.2268 | 0.5 | 0 | 0 | 0 |
Table 2: Grüneisen equation-of-state parameters for the gelatin bird model. Material and equation-of-state parameters used with the *MAT_NULL and *EOS_GRUNEISEN formulations to represent the gelatin bird projectile in the smoothed particle hydrodynamics (SPH) model.
| Parameters | Number | Unit |
| THICK | 3.6 | mm |
| R | 3.7 | mm |
| DENS | 0.00000001 | ton/mm3 |
| STIFF | 125700.00 | N/mm |
| RN | 1.534 | / |
| RS | 1 | / |
| ALPHA1 | 0 | / |
| BETA | 1.5772 | / |
| UPFN | 2.8 | / |
| UPFS | 0.6 | / |
| ALPHA2 | 0 | / |
| BETA2 | 2.5 | / |
| UPRN | 1.3 | / |
| UPRS | 0.3 | / |
| ALPHA3 | 0 | / |
| BETA3 | 2 | / |
| MRN | 0.00002 | N.s/mm |
| MRS | 0.00002 | N.s/mm |
Table 3: Constitutive parameters of the SPR4 simplified connection model. Parameters used with *CONSTRAINED_INTERPOLATION_SPOTWELD to represent the mechanical response and failure of the riveted connections in the numerical simulations. RN and RS are dimensionless normalized parameters rather than physical tensile and shear loads.
| Case | Plate mesh size (mm) | SPH particle number | Maximum deformation (mm) |
| Mesh-1 | 2 | 11500 | 13.52 |
| Mesh-2 | 1.5 | 11500 | 13.81 |
| Mesh-3 | 1 | 11500 | 14 |
| Mesh-4 | 0.5 | 11500 | 14.06 |
| SPH-1 | 1 | 7850 | 13.71 |
| SPH-2 | 1 | 11500 | 14 |
| SPH-3 | 1 | 21200 | 14.08 |
Table 4: Mesh convergence and SPH particle sensitivity analysis results. Results of numerical simulations with different plate mesh sizes and SPH particle numbers, showing the corresponding maximum deformation of the target plate.
| Test number | Mass (g) | Gas pressure (MPa) | Velocity (m/s) | Test result |
| 1 | 51.45 | 0.09 | 122 | Rivet not failed |
| 2 | 51.47 | 0.14 | 146 | Rivet not failed |
| 3 | 49.5 | 0.15 | 160 | Rivet not failed |
| 4 | 49.1 | 0.16 | 167 | Rivet failure |
| 5 | 50.1 | 0.16 | 171 | Rivet failure |
Table 5: Experimental bird-strike conditions and outcomes. Projectile mass, measured impact velocity, and observed rivet-failure outcome for each of the five bird-strike experiments.
| Load state | Load velocity (m/s) | Test ultimate load (N) | Simulation ultimate load (N) | Error | Test energy absorption (N·mm) | Simulation energy absorption (N·mm) | Error |
| Simple shear | 5 x 10⁻⁶ | 5269 | 5283 | 0.30% | 9837 | 5520 | -43.90% |
| 12 | 6197 | 6313 | 1.90% | 6732 | 6431 | -4.50% | |
| 17 | 7244 | 7191 | -0.70% | 7867 | 7672 | -2.50% | |
| Uniaxial tension | 5 x 10⁻⁶ | 8037 | 8187 | 1.90% | 16914 | 19117 | 13% |
| 12 | 11548 | 12116 | -4.70% | 25205 | 23919 | 5.40% | |
| 17 | 12854 | 13117 | -7.30% | 26475 | 29614 | 11.90% | |
| 45° tension-shear coupling | 5 x 10⁻⁶ | 5674 | 5817 | 2.50% | 10307 | 8834 | -14.30% |
| 12 | 7403 | 7338 | -0.90% | 14267 | 11509 | 19.30% | |
| 17 | 7823 | 8559 | 9.40% | 17344 | 14109 | -18.70% |
Table 6: Comparison of experimental and simulated ultimate loads and energy absorption. Experimental and numerical simulation results and corresponding percentage errors for ultimate load and absorbed energy under simple shear, simple tension, and 45° tension-shear coupled loading at different loading rates.
Supplementary Figure 1: Rivet deformation after bird impact at 160 m/s. Cross-sectional view of a deformed rivet showing displacement of the rivet-shank axis and separation between the connected panels, indicating combined shear and tensile deformation.Please click here to download this file.
Supplementary Figure 2: Strain response of the target panel during bird impact at 160 m/s. Time histories of strain recorded by strain gauges 1–7 on the backside of the target panel. Signals from gauges 1, 2, and 7 exceeded the measurement range during impact and therefore do not represent the actual strain magnitude at these locations.Please click here to download this file.
Supplementary Figure 3: Riveted-joint configurations and experimental force-displacement responses under different loading conditions. (A) Specimen configuration for simple shear loading. (B) Force-displacement responses under simple shear at different loading rates. (C) Specimen configuration for simple tension loading. (D) Force-displacement responses under simple tension at different loading rates. (E) Specimen configuration for 45° tension-shear coupled loading. (F) Force-displacement responses under 45° tension-shear coupled loading at different loading rates.Please click here to download this file.
Supplementary Figure 4: Characteristic yield curve used in the SPR4 simplified connection model. Relationship between flow load and characteristic displacement used to define the nonlinear response of the SPR4 connection element.Please click here to download this file.
Supplementary Figure 5: Simplified numerical models of a single riveted joint under different loading conditions. (A) Quasi-static simple shear. (B) Dynamic simple shear. (C) Quasi-static simple tension. (D) Dynamic simple tension. (E) Quasi-static 45° tension-shear coupled loading. (F) Dynamic 45° tension-shear coupled loading. The physical rivet is represented by the SPR4 simplified connection element.Please click here to download this file.
Supplementary File 1: Formulation of the SPR4 simplified connection model. Detailed mathematical formulation of the SPR4 (*CONSTRAINED_INTERPOLATION_SPOTWELD) connection model used in the numerical simulations, including the definitions of elastic, plastic, and damage behavior and the associated load-displacement and failure relationships.Please click here to download this file.
Diskussion
Determination and preliminary verification of the simplified connection model parameters
The SPR4 simplified model contains 18 unknown parameters. To fit all parameters, load-displacement curves are required for the connected structure under shear, tension, and at least one shear-tension coupling loading condition, as well as under different loading rates. For the specific connection structure used in this study, consisting of a 1.8 mm thick Ti-6Al-4V plate paired with MS20615 rivets, Ren et al.32investigated its quasi-static and dynamic mechanical responses under simple shear, simple tension, and three shear-tension coupling conditions, obtaining load-displacement curves of the structure under different loading states and a wide range of loading rates. Supplementary Figure 3A,C,E show the specimens used in the simple shear, simple tension, and 45° shear-tension coupling tests, respectively, as detailed in reference 32. Supplementary Figures 3B,D,F show the corresponding load-displacement curves of the structure under three different loading rates (5 x 10⁻⁶ m/s, 12 m/s, and 17 m/s) for each loading condition. In this study, the nine load-displacement curves obtained under different loading conditions, shown in Supplementary Figure 3, were used to fit the unknown parameters of the simplified connection model; the fitting results are presented in Table 3. In addition to the parameters in the table, a characteristic yield curve must also be defined in the model, as shown in Supplementary Figure 4. This curve is defined as the LCF option curve in the software.
Based on the experimental tests in Ren et al.32, a series of corresponding simplified numerical models of the connection structure under simple shear, simple tension, and three shear-tension coupling conditions was constructed in the finite element software LS-DYNA, as shown in Supplementary Figure 5. In this model, the connection plates are represented as shell elements, and the rivets are modeled as SPR4 simplified connection elements. Additionally, to align with the loading conditions used in the actual dynamic tests with the Hopkinson bar apparatus, the dynamic numerical model also includes adapter fixtures and loading bars, which are modeled using solid elements. All components in the model are made of Ti-6Al-4V titanium alloy. Since the fixtures and loading bars are in the elastic deformation phase during the dynamic tests, they are modeled as elastic bodies with a density of 4.4 x 10⁻⁹ ton/mm3, an elastic modulus of 114 GPa, and a Poisson's ratio of 0.34. For the connection plates, the Johnson-Cook constitutive model is used to characterize their plastic behavior. The Johnson-Cook constitutive and failure parameters for the Ti-6Al-4V material, based on the findings of Wang et al.33, are provided in Table 1.
In the quasi-static model, the external load is applied by controlling the displacement of one side of the connection plate while fixing the degrees of freedom of the opposite side along the loading direction. The loading rate is kept consistent with the experimental test. Since the dynamic tests use an electromagnetic Hopkinson bar for loading, the dynamic model applies the external load by introducing transient stress at the outer ends of the loading bars on both sides, with the stress waveform matching the experimentally measured waveform.
Based on the finite element model shown in Supplementary Figure 5, the SPR4 simplified connection element, defined by the parameters in Table 3, is used to replace the actual rivet components. The load-displacement response obtained from the numerical simulation is compared with the experimental results, as shown in Figure 7. The results indicate that, under simple shear loading, the load-displacement curves obtained from the finite element calculations at loading rates of 12 m/s and 17 m/s match the experimental results well. However, under quasi-static loading, the curve aligns well only before the peak load, with significant discrepancies observed during the load drop phase. Additionally, the load-displacement curves obtained from numerical simulations for simple tension and 45° shear-tension conditions did not agree well with the experimental curves. The reason for this is that the deformation and failure mechanisms of this riveted structure are controlled by the loading rate and loading condition of the external load, while the SPR4 simplified model represents the load-displacement response of the connected structure under all conditions using only one characteristic yield curve (LCF, shown in Supplementary Figure 4). This model cannot capture changes in structural deformation and failure mechanisms as loading rate and loading state vary, thereby limiting the numerical simulation to matching experimental results for a specific loading condition. In view of this limitation, the numerical model’s accuracy in predicting the structure's overall energy absorption is inevitably compromised. Furthermore, existing simplified connection models have a limited ability to characterize changes in the failure mechanisms of actual riveted structures across different loading conditions.
For structural impact applications, the ultimate load-bearing capacity and energy absorption during failure are important parameters for evaluating the performance of the simplified connection model. Based on the curves shown in Figure 7, Table 6 presents the experimental results for the limit load and energy absorption at failure under different loading conditions, as well as the simplified numerical simulation results and the corresponding errors between the numerical and experimental results. The limit load represents the load corresponding to the peak of the load-displacement curve, while energy absorption is the area of the closed region formed by the load-displacement curve and the horizontal axis.
From the data in the table, the numerical simulation demonstrates high accuracy in representing the structure's ultimate load-bearing capacity, with the maximum error across all loading conditions being 9.4%, observed during the 17 m/s loading under the 45° shear-tension coupling. During the SPR4 model parameter optimization process, it was found that this simplified model cannot accurately represent the structure's energy absorption under all loading conditions. Since this study aims to explore the feasibility of using simplified connection elements in structural impact numerical simulations, the focus of parameter fitting was to obtain results that correspond to the experimental data under dynamic loading. For energy absorption, the errors under dynamic simple shear and simple tension loading conditions were below 15%. Under dynamic shear-tension coupling conditions, the maximum absolute error was 19.3%.
Overall, the SPR4 model reproduced the ultimate load-bearing capacity with good accuracy, although its ability to reproduce the complete load-displacement response and energy absorption varied with the loading condition and rate.
Bird strike simulation results and accuracy verification
The numerical simulation calculates the critical impact velocity for rivet fastener failure in the target plate as 151 m/s. Since the experimental range for the critical failure velocity of the target plate is between 160 m/s and 167 m/s, the maximum error is calculated as (151-167)/167 = -9.58%. This deviation may arise from the combined effects of uncertainties in material parameters, bird idealization, rivet variability, and contact settings. However, the individual contributions of these uncertainty sources were not quantitatively separated in the present study, as a dedicated sensitivity analysis was not performed. This represents a limitation of the current study. The following analysis compares the deformation of the bird body and the target plate, and the strain response on the back of the target plate, to illustrate the reliability of the numerical simulation results, using a loading rate of 167 m/s as an example.
When the bird pellet impact velocity is set to 167 m/s in the numerical simulation, the SPR4 connection element fails. Figure 8 compares the numerical simulation results with the experimental high-speed camera footage. In the figure, the Mises stress field on the impact surface of the target plate is provided by the numerical simulation. It is worth noting that in the numerical simulation, the SPH bird pellet is set to be only 1 mm away from the target plate, and the entire simulation duration is set to 2 ms. The results indicate that the numerical simulation accurately reproduces the deformation of the gelatin bird pellet observed in the experiment. In the simulation, the SPR4 connection element fails at 580 microseconds, while the experimental measurement of the time from bird pellet contact with the target plate to rivet failure is approximately 600 microseconds, showing good agreement between the two.
It is important to note that since the numerical simulation represents an idealized scenario, the deformation and failure of the target plate are perfectly symmetric on both sides. Therefore, in the simulation of the 167 m/s bird strike test, if the normal settings are applied, all connection elements on both sides of the target plate would fail. However, in the actual experiment, failure occurs only on one side of the rivets. The analysis indicates that this phenomenon in the experiment may be due to one of the following two reasons: (1) the rivet performance on both sides of the target plate is not identical, and (2) the impact location of the bird body is not perfectly centered.
In the experiment, strain gauges were used to measure strain at several points on the back of the target plate during loading. Similarly, in the numerical simulation, strain can be output from the corresponding elements at the same locations, and in the same direction as in the experimental measurements. Figure 9 compares the strain output from the numerical simulation with the experimental results. For the measurement points that remained within the valid measurement range, the numerical and experimental strain responses showed generally comparable trends and magnitudes. The experimental signals from gauges 1, 2, and 7 exceeded the measurement range and were therefore not used for quantitative validation.
Additionally, high-speed images reveal that the impact location of the gelatin bird is offset by 5mm to the right of the center of the target plate. Therefore, in the numerical simulation, the impact point of the bird pellet was also shifted 5mm to the right of the target plate center. This adjustment allows the simulation to replicate the failure of the connection elements on the left side of the target plate. The specific failure pattern of these connection elements is shown in Figure 10.
Conclusion:
This study experimentally and numerically investigated the bird-strike response of multi-riveted Ti-6Al-4V panels and evaluated the applicability of the SPR4 simplified connection model. The experimental critical velocity for rivet failure was determined to lie between 160 m/s and 167 m/s, with failure characterized by coupled tensile-shear deformation and fracture. The simplified numerical model showed good agreement with the experiments on critical failure velocity, impact deformation, and rivet failure behavior, and provided valid strain responses. The SPR4 model also reproduced the ultimate load-bearing capacity with an error below 10% and dynamic energy absorption with an error below 20% under the evaluated loading conditions. These findings support the feasibility of using simplified connection elements for the numerical analysis of multi-riveted structures under bird impact. However, because SPR4 accuracy depends on the loading state and rate used for parameter calibration, appropriate experimental validation remains necessary when applying the model to other impact conditions.
Offenlegungen
The authors have no conflicts of interest to declare.
Danksagungen
This work was financially supported by the National Natural Science Foundation of China (grant Nos. 12472349, 12002264), the project of Shaanxi Province Key Research and Development Plan (Grant No. 2024GH-ZDXM-30), and Fundamental Research Funds for the Central Universities (Grant No. D5000230140).
Materialien
| Name | Unternehmen | Katalognummer | Kommentare |
|---|---|---|---|
| 80 mm Caliber High-speed Gas Gun Test System | Self-developed (NPU Test Lab) | N/A | Main facility for bird strike launching test, including high-pressure gas chamber, launch barrel, separator fixture |
| Ballistic Gelatin Powder | Sigma-Aldrich | G7041 | Used for manufacturing cylindrical substitute bird projectile |
| Dynamic Strain Acquisition System | Hottinger Baldwin Messtechnik GmbH | HBM-GEN3i | Synchronously collect dynamic strain data of back-panel strain gauges during impact |
| High-speed Digital Camera | Phantom | V711 | Frame rate set as 40,000 fps, three cameras arranged at front/side/rear for deformation recording |
| LS-DYNA Explicit Finite Element Software | LSTC | N/A | Numerical simulation, SPR4(*CONSTRAINED _INTERPOLATION_SPOTWELD) simplified rivet connection modeling |
| MS20615-5M6 Solid Rivet | Aerospace Standard Fastener Manufacturer | MS20615-5M6 | Aircraft standard titanium rivet, cold upset forming by hydraulic press |
| Strain Gauge | Zhonghang Electronic Measuring Instruments Co.,Ltd | N/A | 7 groups pasted on rear surface of target panel for strain measurement |
| Ti-6Al-4V (TC4) Titanium Alloy Sheet | Western Superconducting Technologies Co., Ltd. | N/A | Thickness=1.8 mm, aircraft grade titanium alloy for riveted panel fabrication |
Referenzen
- Vivio F. A new theoretical approach for structural modelling of riveted and spot welded multi-spot structures. Int J Solids Struct. 2009;46:4006-24.
- Zhao L, Yang T, Huang Q, Zuo Y. Damage behavior and mechanical property investigation of CFRP/CFRP washer-bushing riveted joints. Xibei Gongye Daxue Xuebao. 2023;41(6):1089-96.
- Ren T et al. Experimental and numerical investigation on the impact response of a riveted structure subjected to bird strike. Aerosp Sci Technol. 2025;161:110111.
- Ha KM. Bird strikes on civil aircraft: a systematic literature review. Transp Res Interdiscip Perspect. 2025;34:101755.
- Li G et al. Bird strike-induced damage studies on aero-engine hollow fan blades: a soft tissue-skeleton coupled bird model with calibrated constitutive parameters. Int J Impact Eng. 2026;208:105530.
- Zhang H et al. Effect of bird strike on residual strength and vibration of fan blades for aero-engines. Aerosp Sci Technol. 2026;168:110925.
- Caprio FD et al. Bird strike mitigation in civil tiltrotor: a shielded leading edge approach. Chin J Aeronaut. 2025;39:103825.
- Kop MD, Garg A, Avcar M. Analysis of bird strike-induced damage on bio-inspired laminated plates: a comparative study. Archives of Advanced Engineering Science. 2026;4(3):288-94.
- Ning S, Zhou Y. Crashworthiness of composite sandwich structures with tailored Poisson’s ratios under bird strike. Int J Non-Linear Mech. 2026;181:105273.
- Garg A et al. Bird strike-induced damage studies on bio-inspired laminated plates with holes. Aerosp Sci Technol. 2025;162:110200.
- Sun J et al. Bird strike on aeroengine fan blades: a combined experimental and numerical study. Aerosp Sci Technol. 2026;168:110955.
- Belardi VG, Vivio F. Application of a custom FE simulation technique for the analysis of hybrid double-cover butt joints. Key Eng Mater. 2023;970:113-18.
- Gao G et al. Progressive damage numerical modelling and simulation of aircraft composite bolted joints bearing response. Materials. 2020;13:5606.
- Zhao W et al. Test and simulation of high-temperature-resistant polyamide composite with a single lap single bolt connection. Thin-Walled Struct. 2025;206:112649.
- Ma CH, Xu F. Simulation of low-velocity impact on composite laminates using a strain-based damage model. Key Eng Mater. 2012;525-526:393-96.
- Li X, Zhang Z, Zhou Z, Chen D. Modeling of bolted beam utilizing modified joint element and identification of contact parameters at the joint. Chin J Mech Eng. 2025;39:100081.
- Fasan M, Bedon C, Amadio C, Pecce MR. Non-linear component-based modeling strategy for beam-to-column steel-concrete composite joints under seismic loads. J Constr Steel Res. 2024;212:108314.
- David Müzel S, Bonhin EP, Guimarães NM, Guidi ES. Application of the finite element method in the analysis of composite materials: a review. Polymers (Basel). 2020;12(4):818.
- Yunus MA, Abdul Rani MN, Sani MSM, Aziz Shah MAS. Finite element model updating of riveted joints of simplified model aircraft structure [conference paper]. Presented at: International Conference on Electrical, Electronics, Materials and Applied Science; Secunderabad, India; 2017. Available from: https://doi.org/10.1063/1.5031975.
- Behera SK, Singh SP, Behera BK. A review of multiscale FE modelling of lightweight composite for automotive part. Proc Inst Mech Eng Part D J Automob Eng. 2026;240(6):3105-45.
- Langrand B, Markiewicz E. Strain-rate dependence in spot welds: non-linear behaviour and failure in pure and combined modes I/II. Int J Impact Eng. 2010;37:792-805.
- Wang C, Suo T, Gao H, Xue P. Determination of constitutive parameters for predicting dynamic behavior and failure of riveted joint: testing, modeling and validation. Int J Impact Eng. 2019;132:103319.
- Liu X et al. Dynamic response and failure mechanism of Ti-6AL-4V hi-lock bolts under combined tensile-shear loading. Int J Impact Eng. 2019;131:140-51.
- Porcaro R, Hanssen AG, Aalberg A, Langseth M. Joining of aluminium using self-piercing riveting: testing, modelling and analysis. Int J Crashworthiness. 2004;9:141-54.
- Hanssen AG, Olovsson L, Porcaro R, Langseth M. A large-scale finite element point-connector model for self-piercing rivet connections. Eur J Mech A Solids. 2010;29:484-95.
- Duan L et al. Simplified modelling of self-piercing riveted joints and application in crashworthiness analysis for steel-aluminium hybrid beams. J Manuf Process. 2023;85:948-62.
- Bier M, Sommer S. Modeling of self-piercing riveted joints for crash simulation: state of the art and future topics [conference paper]. Presented at: 10th European LS-DYNA Conference; Würzburg, Germany; 2015. Available from: https://www.semanticscholar.org/paper/Modeling-of-self-piercing-riveted-joints-for-crash-Bier-Sommer/49ad36bd9f8d52b762236b3f0c284d4c8d7e6722
- Leconte N et al. Strength and failure of an aluminum/PA66 self-piercing riveted assembly at low and moderate loading rates: experiments and modeling. Int J Impact Eng. 2020;142:103587.
- Du Z et al. Experimental and numerical investigations of aluminium-steel self-piercing riveted joints under quasi-static and dynamic loadings. Thin-Walled Struct. 2021;169:108277.
- Shepherd CJ, Appleby-Thomas GJ, Hazell PJ, Allsop DF. The dynamic behaviour of ballistic gelatin [conference paper]. Presented at: Shock Compression of Condensed Matter 2009; Nashville, TN, USA; 2009. Available from: https://doi.org/10.1063/1.3295071.
- Liu L et al. Bird impact response and damage mechanism of 3D orthogonal woven composite aeroengine blades. Compos Struct. 2023;304:116311.
- Ren T et al. Analytical models for characterizing coupling effects of loading state and loading rate on ultimate strength and yield strength of riveted joints. Int J Solids Struct. 2023;279:112387.
- Wang C et al. A new experimental and numerical framework for determining of revised J-C failure parameters. Metals. 2018;8:396.