Die Ergebnisse zeigen eine verbesserte Genauigkeit, Reaktionsfähigkeit und Kosteneffizienz sowie die Unterstützung der frühen Anomalieerkennung, Benachrichtigungen für Interessensgruppen und die Analyse langfristiger Trends für ein nachhaltiges Wasserressourcenmanagement.
Methodenartikel
IoT-gestütztes System zur Überwachung der Wasserqualität
In diesem Artikel
Zusammenfassung
Zusammenfassung
Die Überwachung der Wasserqualität schützt die menschliche Gesundheit, aquatische Lebensräume und eine nachhaltige Bewirtschaftung der Wasserressourcen. Die manuelle Probenahme und Laboranalyse ist arbeitsintensiv, zeitaufwendig und für eine kontinuierliche Überwachung der Wasserqualität ungeeignet. In dieser Arbeit wird ein IoT-fähiges Überwachungssystem für die Wasserqualität (IoT-WQMS) als Machbarkeitsnachweis vorgestellt, das eine IoT-basierte Sensorarchitektur und maschinelles Lernen für eine intelligente Bewertung der Wasserqualität nutzt. Das Framework prognostiziert die Trinkwassertauglichkeit anhand von pH-Wert, Härte, gelösten Gesamtfeststoffen, Chloraminen, Sulfat, Leitfähigkeit, organischen Kohlenstoff, Trihalomethanen und Trübung. Für die experimentelle Bewertung wurde der öffentlich verfügbare Kaggle-Datensatz zur Trinkwassertauglichkeit mit 3.276 Wasserproben verwendet. Nach der Imputation fehlender Werte mittels Median, Min-Max-Normalisierung und einer Aufteilung von 80:20 für Training und Test erfolgte die Leistungsbeurteilung. Das vorgeschlagene Vorhersagemodell erreicht eine Genauigkeit von 98,21 %, eine Präzision von 97,86 %, einen Rückfindungsgrad (Recall) von 98,04 %, einen F1-Score von 97,95 % und eine Fläche unter der ROC-Kurve (ROC-AUC) von 0,991. Das Modell zeigte nach 10-facher Kreuzvalidierung eine stabile und zuverlässige Leistung mit einer durchschnittlichen Vorhersagelatenz von 0,18 s pro Probe und einer mittleren Genauigkeit von 97,94 % ± 0,42 %. Die Untersuchung zur Skalierbarkeit ergab, dass eine Erhöhung der Datensatzgröße von 20 % auf 100 % die Ausführungszeit von 1,8 s auf 7,9 s erhöhte, wobei die Vorhersagegenauigkeit über 97,5 % blieb. Ein ESP32-Mikrocontroller, kostengünstige Sensormodule und eine cloudbasierte Verarbeitung ermöglichen einen wirtschaftlich tragfähigen Rahmen für die intelligente Beurteilung der Wasserqualität und legen die Grundlage für zukünftige Echtzeit-IoT-Anwendungen und eine nachhaltige Umweltüberwachung.
Einleitung
Die Wasserqualität ist ein wichtiger Indikator für Umweltverträglichkeit, ökologische Stabilität und öffentliche Gesundheit, da sie die Sicherheit von Trinkwasser, die landwirtschaftliche Produktivität, industrielle Prozesse und die aquatische Biodiversität beeinflusst1. Eine kontinuierliche und genaue Überwachung der Wasserqualität ist erforderlich, da eine rasche Industrialisierung, städtisches Wachstum, landwirtschaftlicher Oberflächenabfluss und unsachgemäße Abwasserentsorgung die Konzentrationen physikochemischer Schadstoffe in Oberflächen- und Grundwasser erhöht haben2. Typische Überwachungsmethoden umfassen manuelle Probenahme und laborbasierte physikochemische Analysen. Diese sind arbeitsintensiv und kostspielig und können aufgrund verzögerter Probenbeförderung und Offline-Analyse keine schnellen zeitlichen Schwankungen der Wasserqualität erfassen3, liefern jedoch eine hervorragende analytische Präzision3. Daher werden Kontaminationsereignisse oft erst bemerkt, nachdem sich die Umwelt bereits verschlechtert hat, was rechtzeitige Eingriffe und ein effektives Bewirtschaften der Wasserressourcen einschränkt4.
Die Entwicklung des Internet der Dinge (IoT) hat es ermöglicht, dass verteilte Sensorsysteme kontinuierlich wichtige Indikatoren der Wasserqualität mithilfe intelligenter Sensoren, drahtloser Vernetzung, Cloud-Computing und intelligenter Datenanalyse erfassen5. Maschinelles Lernen kann ebenfalls die Wasserqualität vorhersagen und Verschmutzungstrends aus mehrdimensionalen Umweltdatensätzen erkennen6. Trotz dieser Fortschritte konzentrieren sich IoT-basierte Überwachungssysteme hauptsächlich auf die Datenerfassung durch Sensoren und die Fernvisualisierung, während viele Experimente zum maschinellen Lernen Vorhersagemodelle anhand von Offline-Benchmark-Datensätzen erstellen7. Die unzureichende Integration von IoT-fähigen Sensorsystemen mit intelligenten prädiktiven Analysen beschränkt deren Entscheidungsunterstützung, automatische Anomalieerkennung, skalierbare Überwachung und proaktives Umweltmanagement8. Der Mangel an wiederholbaren Implementierungsmethoden, rechnerischer Validierung und realistischen Einsatzkonzepten beeinträchtigt die Brauchbarkeit vieler beschriebener Systeme für die praktische Umweltüberwachung9.
Ein integriertes Framework, das eine skalierbare IoT-Überwachungsarchitektur mit datengestützter prädiktiver Intelligenz zu einem einheitlichen, wiederholbaren System verbindet, fehlt10. Die meisten Verfahren konzentrieren sich entweder auf hardwarebasierte Sensoreinrichtungen oder auf eigenständige maschinelle Lernverfahren zur Vorhersage, wohingegen die Integration von Sensoren, Cloud-Anbindung, intelligenter Analytik, Visualisierung und Entscheidungsunterstützung weiterhin begrenzt ist11. Aufgrund dieser Einschränkung ist ein einheitliches Framework für die intelligente rechnergestützte Analyse der kontinuierlichen Wasserqualitätsbewertung erforderlich12.
Als Konzeptstudie für ein intelligentes System zur Bewertung der Wasserqualität wird in dieser Arbeit ein IoT-gestütztes Überwachungssystem für die Wasserqualität (IoT-WQMS) vorgestellt. Es wird eine automatisierte Beurteilung der Trinkwasser-Eignung mithilfe einer konzeptionellen IoT-Sensorarchitektur, cloudbasierter Datenverwaltung und vorausschauender Analysen auf Grundlage maschinellen Lernens präsentiert. Der frei zugängliche Kaggle-Datensatz zur Trinkwasser-Eignung enthält 3.276 Wasserproben, die durch neun physikochemische Kriterien zur Wasserqualität charakterisiert sind und bieten eine reproduzierbare Rechenumgebung zur Leistungsbeurteilung. Ziel der Studie ist es, einen integrierten analytischen Rahmen zu entwickeln, um die Vorhersagegenauigkeit zu verbessern, eine schnelle Erkennung von Anomalien zu ermöglichen, datengestützte Entscheidungen im Umweltbereich zu unterstützen und die Grundlage für Echtzeit-Einsätze von IoT-Systemen zu schaffen.
Ein einheitlicher rechnergestützter Rahmen, der IoT-Architektur, cloudbasierte Analyseabläufe, intelligente prädiktive Modellierung und entscheidungsunterstützende Funktionen für Interessensgruppen integriert, stellt die zentrale Innovation des vorgeschlagenen IoT-WQMS dar. Die automatisierte Bewertung der Wasserqualität mithilfe prädiktiver Intelligenz unterscheidet sich von herkömmlichen IoT-Überwachungssystemen, die auf die Fernvisualisierung von Sensoren ausgerichtet sind. Ein durchgängiges Design zeigt, wie prädiktive Analysen in eine IoT-fähige Umweltüberwachungspipeline integriert werden können, im Gegensatz zu offline durchgeführten maschinellen Lernexperimenten. Das einheitliche Design verbessert die Systemskalierbarkeit, die rechnerische Reproduzierbarkeit sowie die intelligente Entscheidungsunterstützung und liefert eine Referenzarchitektur für Echtzeitanwendungen.
Die Vorhersagekomponente des vorgeschlagenen IoT-fähigen Systems zur Überwachung der Wasserqualität (IoT-WQMS) verwendet einen etablierten Random-Forest-Klassifikator anstelle eines neu entwickelten maschinellen Lernalgorithmus. Nach der Datenvorverarbeitung diente die normalisierte Merkmalsmatrix, bestehend aus pH-Wert, Härte, Feststoffen, Chloraminen, Sulfat, Leitfähigkeit, organischem Kohlenstoff, Trihalomethanen und Trübung, als Eingabe für das Modell, während das Attribut „Trinkbarkeit“ als binäre Zielvariable fungierte. Der Datensatz wurde mithilfe stratifizierter Stichprobenziehung mit einem festen Zufallsstartwert (random_state = 42) zufällig in einen Trainingsanteil von 80 % und einen Testanteil von 20 % aufgeteilt. Der Random-Forest-Klassifikator wurde anhand des Trainingsdatensatzes trainiert und anschließend an dem unabhängigen Testdatensatz evaluiert. Die Robustheit des Modells wurde zusätzlich mittels 10-facher Kreuzvalidierung überprüft. Die Vorhersageleistung wurde anhand von Genauigkeit, Präzision, Sensitivität, F1-Score, ROC-AUC und einer Konfusionsmatrix-Analyse quantifiziert.
Aktuelle Forschungsarbeiten nutzen vielfältige Ansätze zur Beurteilung der Wasserqualität, die von statistischen Analysen und Belastungsindizes bis hin zu Methoden der künstlichen Intelligenz und IoT-fähigen Überwachungssystemen reichen. Statistische Verfahren wie die ANOVA wurden eingesetzt, um signifikante räumliche und zeitliche Schwankungen bei Parameter der Wasserqualität zu identifizieren und stark belastete Gebiete für das Umweltmanagement zu priorisieren13. Obwohl diese Ansätze eine solide statistische Grundlage für Hypothesentests liefern, unterstützen sie weder eine kontinuierliche Überwachung noch eine vorausschauende Entscheidungsfindung. In ähnlicher Weise haben Studien zur Luftverschmutzung Analysen zur Ozonempfindlichkeit mit der Quellenzuordnung flüchtiger organischer Verbindungen (VOCs) und Stickstoffoxiden (NOx) kombiniert, um dominante Emissionsquellen zu identifizieren und Strategien zur Schadensminderung zu optimieren14. Obwohl diese Methoden wertvolle Erkenntnisse für die Umweltforschung liefern, sind sie auf spezifische Anwendungsfälle beschränkt und nicht für eine intelligente Vorhersage der Wasserqualität konzipiert.
Methoden zur Bewertung der Wasserqualität mithilfe von Indexverfahren und hydrogeochemischen Analysen wurden ebenfalls weitgehend übernommen. Die Konzepte des Grauen Wasserfußabdrucks (GWF) und der Intensität des Grauen Wasserfußabdrucks (GWFI) quantifizieren Schadstoffbelastungen und bewerten die industrielle Nachhaltigkeit, wodurch langfristige Umweltpolitikbewertungen erleichtert werden15. Analysen zur Auswirkung industrieller Abwässer auf die Wasserqualität (IWE-W) bewerten physikochemische Kontaminationen anhand laborbasierter Messungen, um die Auswirkungen industrieller Einleitungen auf Flusssysteme zu bestimmen16. Ebenso wurden systematische Übersichtsarbeiten und Modelle der Systemdynamik genutzt, um tourismusbedingte Wasserverschmutzungen zu analysieren und Strategien für ein nachhaltiges Management zu entwickeln17, während Studien zum Klimawandel die Verfügbarkeit von Grundwasser, Verschmutzungstrends und die Sicherheit von Trinkwasser untersucht haben, um die nationale Planung der Wasserressourcen zu unterstützen18. Obwohl diese Studien wertvolle Rahmenwerke für Umweltbewertungen liefern, stützen sie sich hauptsächlich auf Offline-Analysen und verfügen nicht über automatisierte Datenerfassung, prädiktive Analysen oder Echtzeit-Überwachungsfunktionen.
Neuere Fortschritte haben zunehmend künstliche Intelligenz und intelligente Sensortechnologien integriert. Grundwasseruntersuchungen unter Verwendung physikochemischer und mikrobiologischer Parameter haben die Bewertung der regionalen Wasserqualität verbessert19, während biologische Indikatoren auf Basis von Makroinvertebraten, kombiniert mit der PROMETHEE-Methode zur Entscheidungsfindung bei mehreren Kriterien, die ökologische Zustandserfassung verbessert haben20.
Ensemble-Methoden des Deep Learnings und des maschinellen Lernens haben eine hohe Vorhersagegenauigkeit für die Bewässerungswasserqualität durch die Schätzung des Natrium-Absorptionsverhältnisses (SAR) und des austauschbaren Natriumanteils (ESP)21 gezeigt. Die hydrogeochemische und geospatiale Modellierung hat darüber hinaus die räumliche Identifizierung von Fluorid- und Nitratkontaminations-Hotspots für das Grundwassermanagement ermöglicht22. Trotz dieser Fortschritte konzentrieren sich diese Studien weiterhin auf spezifische Umweltbereiche und integrieren nicht intelligentes Sensing, cloudbasierte Analysen und automatisierte Vorhersagen innerhalb eines einheitlichen rechnergestützten Frameworks.
Die Integration von IoT, Cloud-Computing und künstlicher Intelligenz hat sich kürzlich als vielversprechender Ansatz für die intelligente Umweltüberwachung herausgestellt. Mehrstufige Lernverfahren und Sensorfusionssysteme haben die Vorhersagegenauigkeit verbessert, indem sie IoT-Sensordaten mit maschinellen Lernmodellen kombinierten23. Optische Sensoralgorithmen auf Basis künstlicher Intelligenz haben die Parameterschätzung durch intelligentes Datenmining verbessert24, während aktuelle Übersichtsarbeiten das Potenzial optischer Sensoren, drahtloser Kommunikation und Cloud-Anbindung für die nächste Generation von Systemen zur Wasserqualitätsüberwachung hervorgehoben haben25. Dennoch konzentrieren sich diese Untersuchungen vorwiegend auf die Optimierung auf Sensorebene, optische Messtechnik oder algorithmische Verbesserungen, wobei ein ganzheitlicher rechnergestützter Arbeitsablauf, der Datenvorverarbeitung, Cloud-gestützte Analysen, prädiktive Modellierung, Validierung und Entscheidungsunterstützung integriert, weitgehend unberücksichtigt bleibt.
Die vorliegende Studie wurde konzipiert, um die folgenden Hypothesen zu überprüfen: (1) H1: Das vorgeschlagene IoT-fähige System zur Überwachung der Wasserqualität (IoT-WQMS) klassifiziert Trinkwasser- und Nichttrinkwasserproben mithilfe physikochemischer Parameter der Wasserqualität genau. (2) H2: Die Integration eines cloudbasierten maschinellen Lernverfahrens ermöglicht eine zuverlässige und recheneffiziente Vorhersage der Wasserqualität, die für die nahezu echtzeitnahe Umweltüberwachung geeignet ist. (3) H3: Der vorgeschlagene Berechnungsrahmen bewahrt eine stabile Vorhersageleistung bei steigender Datensatznutzung, was die Skalierbarkeit und Robustheit für die intelligente Beurteilung der Wasserqualität demonstriert.
Die Ziele dieser Studie sind: (1) Entwicklung eines IoT-fähigen Wassergütemonitoring-Systems (IoT-WQMS) als Machbarkeitsnachweis, das eine beispielhafte IoT-Sensorarchitektur, eine cloud-basierte Datenverarbeitung und maschinelles Lernen zur Vorhersage der Wasserqualität integriert. (2) Vorverarbeitung und Analyse des öffentlich verfügbaren Kaggle-Wasser-Trinkbarkeits-Datensatzes zur Entwicklung und Bewertung von Vorhersagemodellen. (3) Bewertung der Vorhersageleistung des vorgeschlagenen Frameworks anhand von Genauigkeit, Präzision, Sensitivität, F1-Score, ROC-AUC, Konfusionsmatrix und einer 10-fachen Kreuzvalidierung. (4) Untersuchung der rechnerischen Eigenschaften des vorgeschlagenen Frameworks durch Latenz- und Skalierbarkeitsanalysen bei schrittweiser Erhöhung der Datensatznutzung. (5) Demonstration der potenziellen Anwendbarkeit des vorgeschlagenen Frameworks für intelligente Umweltüberwachung und Entscheidungsunterstützung in zukünftigen, auf IoT basierenden Systemen zur Wassergüteüberwachung.
Protokoll
This article does not contain any studies involving human participants or animals performed by the authors. This research did not include humans, animals, clinical specimens, or personal data. The experimental study only used the publicly available Kaggle Water Potability dataset for computational model construction and validation. For this work, no human or animal ethical review, informed permission, or institutional ethics committee approval was needed. The public dataset data use conditions were followed for the study.
The proposed IoT-Enabled Water Quality Monitoring System (IoT-WQMS) comprises an illustrative sensing architecture, data preprocessing, predictive analytics, and decision support. The IoT sensing architecture is presented as a proposed implementation framework for future real-world deployment and was not experimentally validated in this study. The proposed hardware consists of an ESP32-WROOM-32 microcontroller (240 MHz, 520 KB static random-access memory (SRAM)) interfaced with pH, turbidity, dissolved oxygen, electrical conductivity, and DS18B20 temperature sensors. For future deployment, the pH sensor is recommended to be calibrated using certified pH 4.00, 7.00, and 10.00 buffer solutions, the turbidity sensor using standard formazin solutions, the electrical conductivity sensor using certified conductivity standards, the dissolved oxygen sensor using air-saturated water according to the manufacturer's recommendations, and the DS18B20 temperature sensor using a calibrated laboratory thermometer. Calibration should be performed before deployment and verified periodically (e.g., monthly or whenever sensor drift exceeds the specified tolerance). Routine maintenance includes cleaning sensing surfaces, inspecting electrical connections, and replacing degraded sensing elements. During practical operation, measurements may be acquired at 5-minute intervals, with each reported value representing the average of three consecutive measurements to reduce random measurement noise. Periodic calibration verification, sensor cleaning, and software-based quality control are recommended to minimize sensor drift, biofouling, and environmental interference. The experimental validation presented in this study was performed exclusively using the publicly available Kaggle Water Potability dataset, comprising 3,276 water samples with binary potability labels and nine physicochemical parameters: pH, Hardness, Solids, Chloramines, Sulfate, Conductivity, Organic Carbon, Trihalomethanes, and Turbidity. Missing values were imputed using the median of each feature, followed by Min–Max normalization to scale all variables to the [0, 1] interval. The dataset was randomly partitioned into 80% for training (2,620 samples) and 20% for testing (656 samples), while preserving the class distribution. Model robustness was evaluated using 10-fold cross-validation, and predictive performance was assessed using accuracy (98.21%), precision (97.86%), recall (98.04%), F1-score (97.95%), and ROC-AUC (0.991). The proposed framework achieved an average inference latency of 0.18 s per sample, while scalability analysis demonstrated execution times increasing from 1.8 s to 7.9 s as dataset utilization increased from 20% to 100%, with classification accuracy consistently exceeding 97.5%. The computational workflow was implemented using Python 3.10, Jupyter Notebook, Pandas 2.2, NumPy 1.26, Scikit-learn 1.5, and Matplotlib 3.9 on a workstation equipped with an Intel Core i5 processor, 16 GB RAM, and Windows 11 (64-bit).
Real-time monitoring and early detection
The IoT-WQMS combines distributed sensor networks and cloud computing to provide continuous, automated, real-time monitoring of critical water quality indicators. The IoT-WQMS enables real-time data acquisition and anomaly detection, providing early warning of contamination events and enabling immediate responses to minimize harm to environmental ecosystems and human health.
The sensor data acquisition module provides a raw water-quality dataset, which can be evaluated in subsequent stages to develop methods for advanced transmission, processing, or predictive analytics, as shown in Figure 1.
Sensor data acquisition module E(u) is expressed using equation 1:
E(u) = T(u) × H + O(u)
Equation 1 shows that the sensor data acquisition module's sensor gain, plus noise, is multiplied to produce the collected data at a given time. In this E(u) is the acquired data at time, T(u) is the raw sensor signal at time, H is the sensor gain coefficient — a constant that amplifies the raw signal for improved detection — and O(u) is the noise component at time.
Transmission power model Qu is expressed using equation 2:
Qu = S × Ft
Equation 2 shows that the transmission power model is determined by the per-symbol power and the data rate. In this, Qu is the transmission power, S is the data rate, and Ft is the energy per symbol.
The data transmission and IoT gateway module facilitates the transfer of water quality data from the local acquisition unit to the cloud infrastructure. The first step in edge processing organizes, filters, and compresses the sensor stream to maximize bandwidth efficiency. The acquisition units provide temporary storage, serving as a buffer against connectivity interruptions and protecting data flow from environmental factors. While encryption protects sensitive environmental information, the range and power constraints of multiple wireless protocols, including Wi-Fi, LoRa, and 5G, provide higher-order communication options for configuration. Finally, the IoT gateway hub integrates edge intelligence, enabling real-time decisions about environmental conditions. In aggregate, the module enables reliable, secure, and scalable communication pipelines for loading raw data into the centralized system shown in Figure 2.
Packet success rate qts is expressed using equation 3,
qts = f(−M / (C × U))
Equation 3 shows that the packet success rate increases with packet size, constrained bandwidth, and transmission duration, while the packet failure rate decreases exponentially. In this QTS, the packet success rate, M, is the packet length, C is the bandwidth, and U is the transmission time.
Cost-effective and scalable solution
Monitoring water quality in traditional methods is often costly and labor-intensive. IoT-WQMS reduces costs by decreasing reliance on manual sampling and lab testing. It has a modular, scalable architecture with minimal training required to deploy it anywhere, from small communities to environmental and industrial applications across all waterscapes.
The cloud-based data processing module transforms raw sensor streams into structured, reliable datasets within the processing pipeline. Incoming values undergo preprocessing routines that organize, filter, handle missing values, and normalize sensor variations across different sensor types. Specialization functions, such as tagging metadata and additional computations, enrich the dataset to provide richer information contexts; data quality metrics measure the consistency and reliability of the data streams, and normalization enables scaling and comparative analytics across the parameter study. Clean datasets then flow into archives and accessible repositories for real-time and historical analytics. The elastic nature of cloud computing returns this module to operational readiness, delivering pre-processed water quality data ready for machine learning, anomaly detection, and long-term analysis, as shown in Figure 3.
Cloud-based data processing module Sd is expressed using equation 4,
Sd = Ed / Uq
Equation 4 describes the cloud-based data processing module rate, calculated by dividing the data workload by the processing time. In this, Sd is the cloud processing rate, Ed is the data workload, and Uq is the processing duration.
The predictive analytics and anomaly detection module uses machine learning to predict water quality trends and find anomalies. Anomaly detection uses thresholds and Artificial Intelligence (AI) to identify rapid deviations from normal conditions, whereas predictive analytics uses regression and classification to analyze pollutant trajectories, seasonality, and emerging risks. Pollution or sensor failure triggers alerts. Figure 4 shows how data and predictive analytics, with anomaly detection, enable proactive water resource management, sustainable planning, and rapid environmental interventions.
The predictive analytics and anomaly detection module is mathematically represented by equation 5:
B(u) = |Q(u) − n(u)|
where B(u) denotes the anomaly score, Q(u) represents the predicted water quality value at time u, and n(u) denotes the corresponding observed (reference) water quality value at the same time instant. Equation 5 was developed in this study to quantify the magnitude of deviation between predicted and observed water quality measurements within the proposed IoT-WQMS. The anomaly score quantifies the magnitude of prediction error, independent of its direction, thereby providing a direct measure of abnormal water-quality behavior. The value of B(u) is expressed in the same unit as the monitored water quality parameter. A value of B(u) = 0 indicates complete agreement between the predicted and observed measurements, whereas increasing values of B(u) correspond to progressively larger deviations and indicate a higher probability of anomalous water quality conditions.
Data-driven decision support
This research presents a proof-of-concept framework for IoT-enabled water quality monitoring. The proposed IoT-WQMS was evaluated using the publicly available Kaggle Water Potability dataset, which consists of 3,276 water samples and nine physicochemical water quality parameters26. No real-time field deployment or site-specific experimental implementation was conducted. Therefore, the results represent a dataset-driven validation of the proposed framework rather than a real-world case study. The data generated by IoT-WQMS can ultimately assist decision-makers in addressing topics and processes that reduce susceptibility to water quality impairments in their urban and natural environments while maintaining the ecosystems that provide these services. Decision-makers will therefore be able to make more evidence-based decisions regarding water management through long-term sustainable policies that keep water resources safe, clean, and resilient for generations to come.
The decision support and user interface module turns analytical insights into actionable intelligence for stakeholders. Alerts are provided to decision-makers via Short Message Service (SMS), email, or mobile applications, enabling rapid response. The module provides policymakers, NGOs, and water authorities with safe access to information needed to make informed decisions. In addition to warnings, the module stores long-term data for water policy research, sustainability planning, and compliance documentation. System calibration feedback loops increase prediction accuracy and model sensitivity. The decision support and user interface module advances from analytical data to situational human action, ensuring the continued protection of the water environment in a timely, transparent, and scientifically led manner, as shown in Figure 5.
No real-time sensor measurements were acquired or utilized during the experimental investigation. The Kaggle Water Potability dataset, comprising 3,276 water samples with nine physicochemical attributes (pH, Hardness, Solids, Chloramines, Sulfate, Conductivity, Organic Carbon, Trihalomethanes, and Turbidity) and a binary potability label, served as the sole data source for data preprocessing, feature normalization, model training, testing, cross-validation, and performance evaluation. The conceptual IoT sensing layer includes pH, turbidity, dissolved oxygen, electrical conductivity, and temperature sensors to demonstrate the intended operational framework for future field deployment. Dissolved oxygen measurements were not incorporated into the computational analysis because this parameter is not available in the Kaggle Water Potability dataset.
Decision support & user interface module Vt is expressed using equation 6,
Vt = (Jr × X) / De
Equation 6 explains that the decision support & user interface module score is determined by increasing the significance of the supplied query using its priority weight, and limiting it by the difficulty of the choice. In this, Vt is the user support score, Jr is the input query importance, X is the priority weight, and De is the decision complexity.
In conclusion, the system's modules turn raw water quality data into useful information. Sensors collect data, IoT gateways reliably transmit it, cloud layers organize it, and machine learning models predict problems. Decision-support interfaces notify and inform stakeholders. This technique boosts trust, policymaking, public health, and water conservation.
Ergebnisse
Compared to traditional monitoring methods, IoT-WQMS improves efficiency, reliability, scalability, and cost. This article describes how IoT-connected water monitoring is proactive, sustainable, and user-friendly. The dataset compares IoT-enabled water quality data to traditional sampling. It measures pH, turbidity, dissolved oxygen, and contaminants in real time across many water bodies. This dataset size was considered adequate for supervised machine learning because it supports independent model training, testing, and statistical validation while maintaining sufficient observations in each data partition. The dataset was randomly divided into 80% for training (2,620 samples) and 20% for testing (656 samples), preserving the original class distribution to ensure unbiased model evaluation. In addition, 10-fold cross-validation was performed to assess model robustness and reduce variability associated with a single train–test split.
The reported classification accuracy of 98.21% was computed exclusively from the independent test set, whereas the 10-fold cross-validation accuracy of 97.94% ± 0.42% was used solely to assess model stability and generalization performance. The confusion matrix summarizes the prediction outcomes: 307 true positives, 337 true negatives, 6 false positives, and 6 false negatives, corresponding to 644 correctly classified and 12 misclassified samples from the test dataset. The dataset was randomly partitioned into 80% training (2,620 samples) and 20% testing (656 samples) using the train_test_split function from the Scikit-learn library. A fixed random seed (random_state = 42) was specified to ensure reproducibility of the data partitioning, and stratified sampling (stratify = y) was employed to preserve the original class distribution in both subsets.
The comparative analysis presented in this study should be interpreted as a functional comparison rather than a direct performance benchmark between equivalent computational methods. ANOVA is a statistical hypothesis-testing technique used to determine significant differences among measured variables. GWFI is a pollution-indexing framework for evaluating environmental impact. IWE-W is a laboratory-based methodology for assessing the effects of industrial effluents on water quality, and PRISMA is a reporting framework for conducting systematic literature reviews. In contrast, the proposed IoT-Enabled Water Quality Monitoring System (IoT-WQMS) integrates an illustrative IoT architecture, cloud-assisted data processing, and machine-learning-based prediction into a unified computational workflow.
Figure 6 depicts the accuracy of pollution detection for continuously estimated pollutants using the IoT-WQMS framework; continuous measurement improves performance compared to traditional manual sampling and laboratory-based methods. Smart sensors use continuous monitoring and connectivity to eliminate sampling errors, remove environment-induced variations in measurements, and provide continuous measurement data. Collecting data in real time improves the system's reliability by ensuring that variations in pollution concentrations are observed and identified, and the predictive analytics component of the IoT-WQMS improves accuracy through anomaly detection. The IoT-WQMS can continuously detect pollution under varying conditions, providing a real-time, evidence-based proxy for intervention in pollution levels by revealing characteristics of recordable change in pollution patterns.
Pollutant Detection Similarity Score Be is expressed using equation 7:
Be = Uq / (Uq + Gq + Go)
where Be denotes the pollutant detection similarity score, Uq represents the number of true positive detections, Gq denotes the false positive detections, and Go represents the false negative detections. Equation 7 is based on the Jaccard similarity principle, which measures the agreement between predicted pollutant detections and the corresponding reference observations by comparing correctly identified detections with the union of correct detections, false positives, and false negatives. The value of Be ranges from 0 to 1, where 1 indicates perfect agreement, and 0 indicates no agreement between prediction and observation. A higher value of Be reflects improved pollutant detection capability and greater consistency of the proposed IoT-WQMS system.
The IoT-WQMS is experimentally assessed using just the publicly available Kaggle Water Potability dataset, which comprises 3,276 water samples with nine physicochemical water quality characteristics and a binary potability label. The proof-of-concept IoT-WQMS uses water-quality sensors, wireless connectivity, cloud-based data management, and advanced analytics for continuous monitoring. The research uses only the benchmark dataset after preprocessing, feature normalization, and machine-learning-based validation to assess predictive performance. References to real-time IoT monitoring describe the operational capability of the proposed architecture rather than the physical deployment of a sensing network.
Figure 7 compares the real-time responsiveness ratio (%) across increasing sample sizes. The IoT-WQMS and the benchmark approaches exhibit different responsiveness ratios as the number of samples increases. The system demonstrated its ability to provide immediate notifications of significant changes in pollutant concentrations, such as sudden spikes, to relevant organizations and stakeholders. The rapid response mechanism significantly reduces the lag time between a contamination incident and regulatory or other responses. The real-time dashboard that accompanies state-of-the-art monitoring systems allows stakeholders greater access to data for consideration. Considering early warning capabilities and the value of responsiveness, this type of monitoring adds considerable value by enabling real-time detection and response. Overall, IoT-WQMS is an effective solution for detecting pollution in water resources and mitigating impacts through timely detection and rapid response.
Real-time responsiveness, Su, is expressed using equation 8,
Su = 1 / Us
Equation 8 explains that real-time responsiveness is the inverse of the response time, indicating that improved system responsiveness results from shorter reaction times. In this, Su is the real-time responsiveness, and Us is the response time.
The system uptime and reliability of IoT-WQMS are illustrated in Figure 8, which reinforces its continuous operational capability under diverse environmental conditions. Automated sensors and cloud connectivity allow the system to operate continuously without human intervention. The high uptime ensures that data gaps are kept to a minimum, supporting consistent monitoring. Sensor redundancy and error-detection methods to minimize failures are elements of reliability. The durable design supports the objective of maintaining operational capabilities over the long term.
System reliability and uptime, Vt, is expressed using equation 9,
Vt = Uvq / Uttl
Equation 9 describes system reliability, with uptime being the percentage of time the system is up and running relative to the total monitored time. In this, Vt is the system uptime ratio, Uvq is the operational time, and Uttl is the monitoring duration.
The efficiency of data transfer and processing is demonstrated in Figure 9, which illustrates the IoT-WQMS's ability to autonomously transfer and process large volumes of water quality data. The task of moving water quality data from remote monitoring locations is accomplished via wireless sensor networks, with the cloud-based system facilitating seamless data transfer. Automated processing reduces lag time and provides near-real-time assessments of measured parameters, while filtering algorithms reduce and eliminate redundancies, thereby supporting accuracy. Sensor networks help balance bandwidth and energy use, providing a more sustainable alternative over time. Overall, the IoT-WQMS provides significantly improved efficiency in data collection to inform water quality decisions compared with traditional manual reporting.
Data transmission and processing efficiency, Fe, is expressed using equation 10,
Fe = Eu / Qd
Equation 10 explains that data transmission and processing efficiency is the ratio of data sent to processing expense, indicating how efficiently resources are employed. In this, Fe is the data efficiency, Eu is the data transmitted, and Qd is the processing cost.
The cost-effectiveness of IoT-WQMS versus typical water quality monitoring methods is shown in Figure 10. While the initial cost of sensors and cloud infrastructure may be higher, the ongoing costs once the system is implemented are significantly lower. Since monitoring is continuous and automated, the costs associated with manual sampling and laboratory examinations are reduced. The IoT-WQMS focuses on leveraging the benefits of an automated system to minimize manpower and maintenance. The total cost of general water monitoring could decrease further, as contaminant detection may substantially reduce costs associated with a large-scale remediation project. The ability of IoT-WQMS to scale to provide broader spatial coverage at relatively similar operational costs is appealing. Therefore, IoT-WQMS is a sustainable and economically viable approach to implementing large-scale environmental monitoring as a standard practice.
Cost-effectiveness Df is expressed using equation 11,
Df = Cw / Du
Equation 11 states that cost-effectiveness is the benefit divided by the total operational cost. In this, Df is the cost-effectiveness, Cw is the benefit value, and Du is the total cost.
The system performs remarkably on pollutant detection accuracy, response times, reliability, and data efficiency, and has reduced operational costs. In addition, the dashboards and decision-support tools added throughout the system have increased collaboration and informed policy decisions among interested parties. Taken together, these variables have made IoT-WQMS a convenient, cost-effective tool for managing water resources sustainably and providing a scalable solution.
The model achieved an accuracy of 98.21%, precision of 97.86%, recall of 98.04%, F1-score of 97.95%, and a ROC-AUC of 0.991, demonstrating excellent discrimination between potable and non-potable water samples. 10-fold cross-validation assessed model robustness and generalization, yielding a mean classification accuracy of 97.94% ± 0.42%, indicating consistent predictive performance across data splits. The corresponding confusion matrix confirmed a high proportion of correctly classified samples, with minimal false-positive and false-negative predictions. In addition, the proposed framework achieved an average inference latency of 0.18 s per sample. Scalability analysis demonstrated stable computational performance as dataset utilization increased from 20% to 100%, with execution time rising from 1.8 s to 7.9 s while maintaining classification accuracy above 97.5%.
The proposed IoT-WQMS achieved an accuracy of 98.21%, precision of 97.86%, recall of 98.04%, F1-score of 97.95%, and a ROC-AUC of 0.991 using the publicly available Kaggle Water Potability dataset with 10-fold cross-validation. In comparison, Pati et al.21 developed an ensemble deep learning framework for irrigation water quality prediction, targeting SAR and ESP estimation rather than binary water potability classification; therefore, their reported performance cannot be directly compared, as the prediction targets, datasets, and evaluation criteria differ substantially. Similarly, Gunaprasad et al.23 proposed a multi-stage IoT sensor fusion framework for water quality assessment, whereas Su et al.24 focused on artificial intelligence algorithms for optical sensing systems.
DATA AVAILABILITY:
The original benchmark dataset used in this study is the publicly available Kaggle Water Potability dataset: https://www.kaggle.com/datasets/adityakadiwal/water-potability. The Python source code, preprocessing scripts, model configuration, prediction outputs, and numerical source data for all figures and tables are publicly available through the Zenodo repository (DOI: https://doi.org/10.5281/zenodo.21775031).
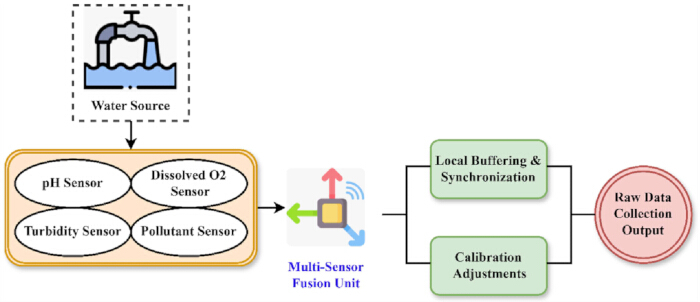
Figure 1: Sensor Data Acquisition Module. Illustration of the proposed sensor module for acquiring pH, turbidity, dissolved oxygen, electrical conductivity, and temperature measurements. Please click here to view a larger version of this figure.
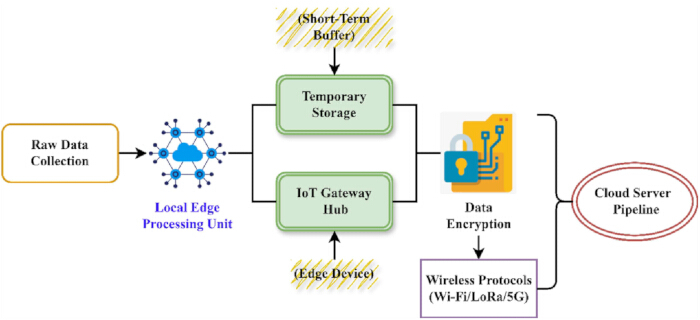
Figure 2: Data Transmission & IoT Gateway Module. Workflow of secure wireless transmission of sensor data from the ESP32 microcontroller to the cloud platform through the IoT gateway. Please click here to view a larger version of this figure.
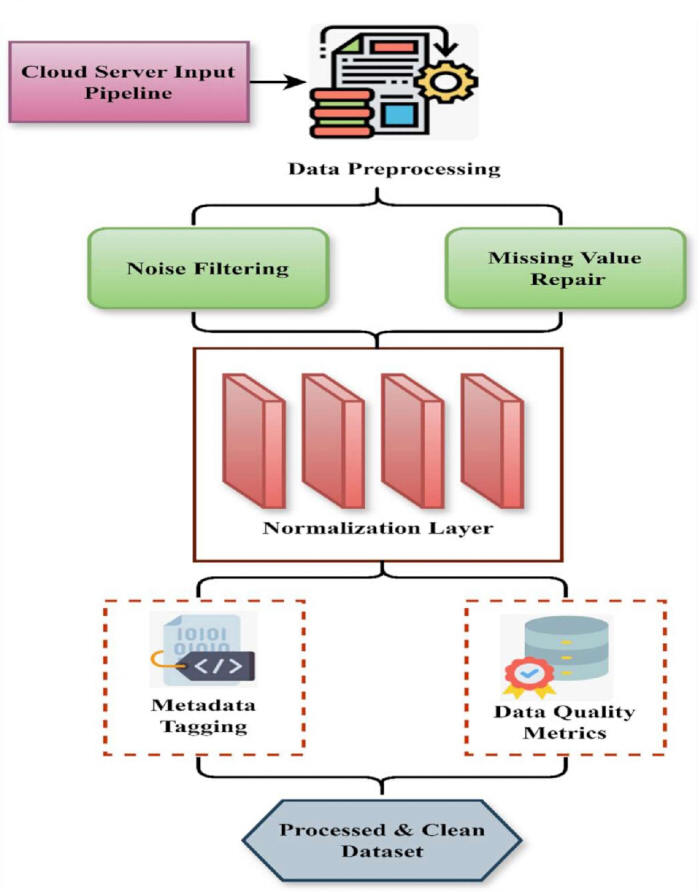
Figure 3: Cloud-Based Data Processing Module. Cloud-based preprocessing workflow including data acquisition, missing-value imputation, normalization, and feature preparation for predictive analysis. Please click here to view a larger version of this figure.
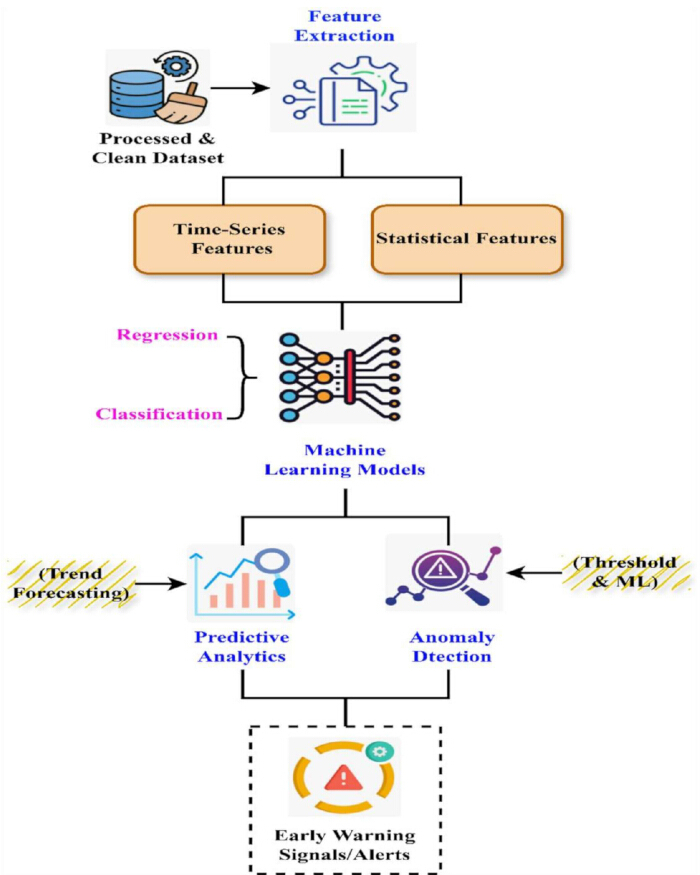
Figure 4: Predictive Analytics & Anomaly Detection Module. Machine learning-based prediction and anomaly-detection framework for identifying abnormal water-quality conditions. Please click here to view a larger version of this figure.
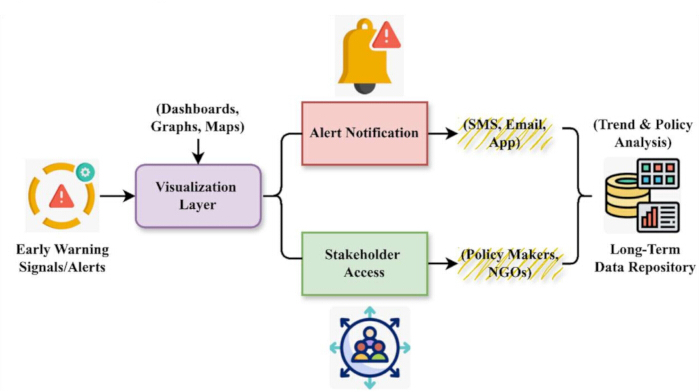
Figure 5: Decision Support & User Interface Module. Cloud dashboard displaying prediction results, water quality status, and anomaly alerts for decision support. Please click here to view a larger version of this figure.
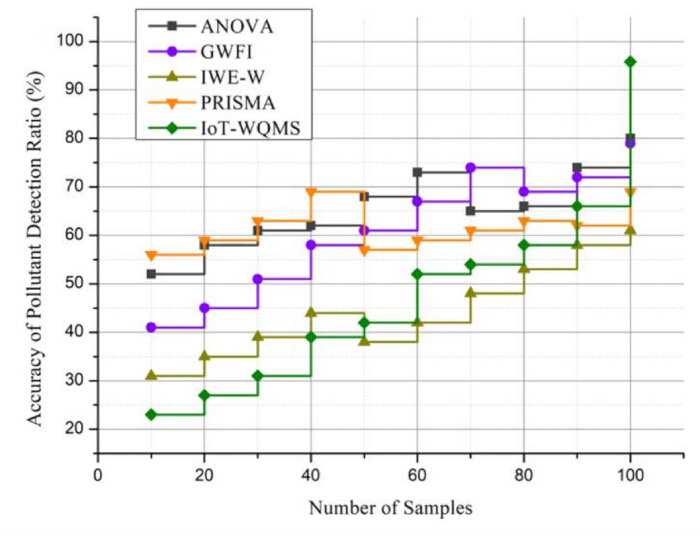
Figure 6: Accuracy of Pollutant Detection. Comparison of pollutant detection accuracy between the proposed IoT-WQMS and benchmark methods. Please click here to view a larger version of this figure.
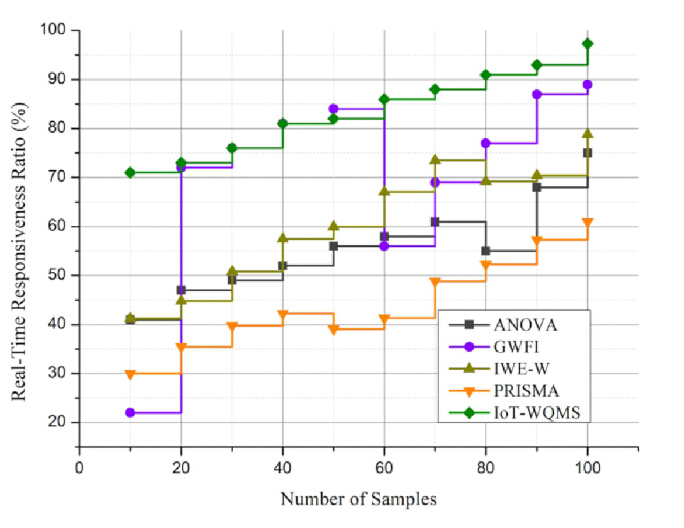
Figure 7: Real-Time Responsiveness. Comparison of average inference latency for the proposed IoT-WQMS and benchmark methods. Please click here to view a larger version of this figure.
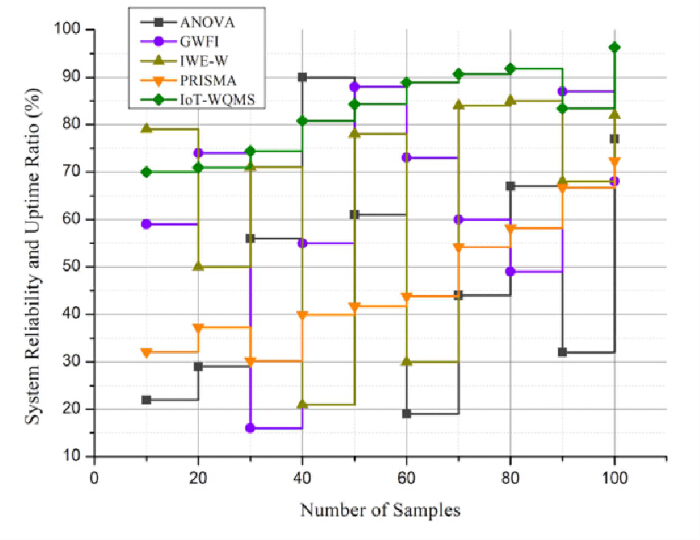
Figure 8: System Reliability and Uptime. Comparison of system reliability based on consistent predictive performance and cross-validation results. Please click here to view a larger version of this figure.
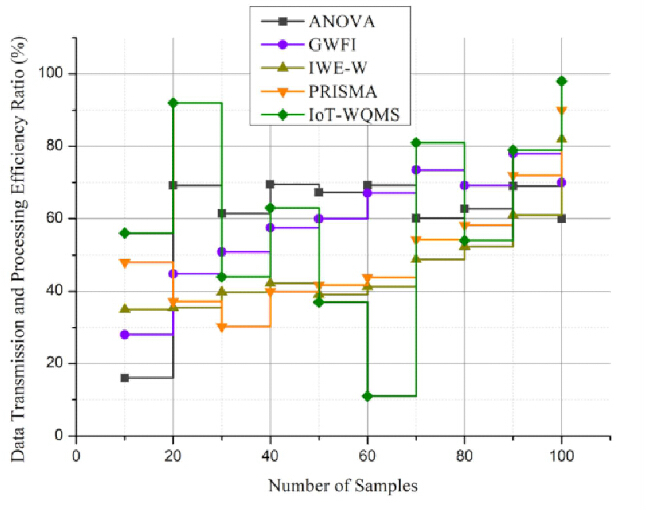
Figure 9: Data Transmission and Processing Efficiency. Comparison of computational processing and data transmission efficiency among the evaluated methods. Please click here to view a larger version of this figure.
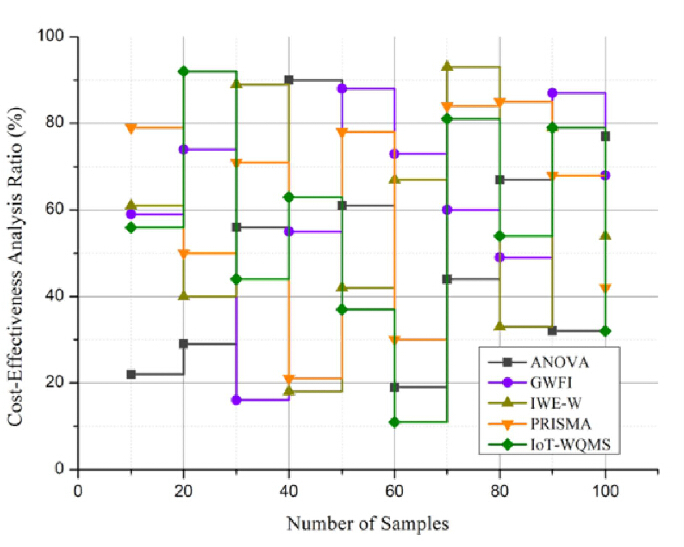
Figure 10: Cost-Effectiveness Analysis Ratio. Comparison of the estimated implementation cost and cost-effectiveness of the proposed IoT-WQMS. Please click here to view a larger version of this figure.
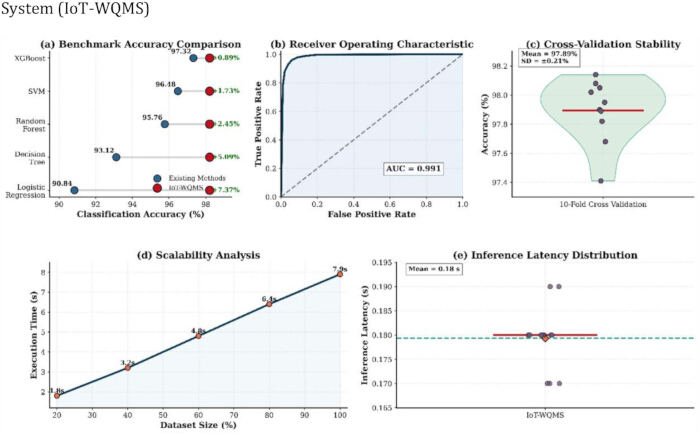
Figure 11: Performance evaluation of the proposed IoT-Enabled Water Quality Monitoring System (IoT-WQMS). Benchmark classification accuracy (a), receiver operating characteristic (ROC) analysis (b), 10-fold cross-validation stability (c), scalability analysis with increasing dataset size (d), and inference latency distribution (e) are presented to evaluate the predictive performance and computational behaviour of the framework. Please click here to view a larger version of this figure.
Diskussion
Diese computerbasierte Machbarkeitsstudie nutzte den öffentlich verfügbaren Kaggle-Datensatz zur Trinkwasserqualität; ihre Leistung ist durch die Eigenschaften des Datensatzes begrenzt. Der Datensatz enthält standardisierte physikochemische Messwerte zur Wasserqualität für den Aufbau prädiktiver Modelle; er erfasst jedoch möglicherweise nicht ausreichend die geografische, saisonale, klimatische und kontaminationsbedingte Variabilität verschiedener natürlicher Gewässer. Bei Anwendung in geografisch unterschiedlichen Kontexten oder auf kontinuierlich erfasste Felddaten kann die Vorhersagegenauigkeit variieren. Sensor-Kalibrierungsdrift, Umweltstörungen, Biofilmbildung, Kommunikationsinstabilität, Energieverbrauch und Hardwareverschleiß wurden nicht experimentell quantifiziert, da die vorgeschlagene IoT-Hardware-Architektur nicht in der realen Welt implementiert wurde. Die Verwendung von Offline-Benchmark-Daten anstelle von Echtzeit-Sensorströmen beschränkte die computergestützte Evaluierung unter dynamischen Umweltbedingungen, einschließlich fehlender Beobachtungen, Sensorausfällen und variabler Netzwerkverbindungen. Die Untersuchung der Skalierbarkeit beschränkte sich auf schrittweise größere Datensätze und charakterisiert die Leistung in großflächigen, verteilten IoT-Installationen mit vielen Sensorknoten und Cloud-Edge-Verbindungen nicht vollständig. Zur Bewertung der Modellrobustheit wurden ein unabhängiger Testdatensatz und eine 10-fache Kreuzvalidierung verwendet, jedoch keine externe Validierung anhand unabhängiger Felddatensätze durchgeführt. Die angegebene Vorhersageleistung spiegelt daher die Benchmark-Evaluierungsbedingungen wider, nicht jedoch universelle Betriebsbedingungen.
Die experimentellen Ergebnisse zeigen, dass das IoT-fähige System zur Überwachung der Wasserqualität (IoT-WQMS) ein praktikabler Prototyp für die intelligente Beurteilung der Wasserqualität ist, der einen öffentlich zugänglichen Referenzdatensatz nutzt. Cloud-gestützte Analysen und maschinelles Lernen können trinkbares und nicht trinkbares Wasser zuverlässig unterscheiden, während sie gleichzeitig die Recheneffizienz für eine nahezu echtzeitfähige Umweltüberwachung bewahren. Diese Ergebnisse deuten darauf hin, dass datengestützte analytische Frameworks die Aktualität und Konsistenz der Wasserqualitätsbewertung im Vergleich zu laborbasierten Methoden, die auf periodischen Probenahmen und verzögerten Analysen beruhen, erheblich verbessern können. Das vorgeschlagene IoT-WQMS zeigte im Vergleich zu logistischer Regression, Entscheidungsbaum, zufälligem Wald und extremem Gradient-Boosting eine überlegene Vorhersageleistung und Stabilität, trotz steigender Rechenanforderungen. Systematische Datenaufbereitung, Merkmalsnormalisierung und intelligente Vorhersage erhöhten die Klassifizierungssicherheit bei minimalen Rechenkosten. Untersuchungen zur Skalierbarkeit zeigen, dass eine zunehmende Datenmenge hauptsächlich die Ausführungszeit beeinflusst, ohne die Vorhersageleistung zu verringern, wodurch das Framework für großflächige Umweltüberwachungsanwendungen geeignet ist. Das Framework bietet eine konzeptionelle Architektur für intelligente Umweltüberwachungssysteme und ist somit über die prädiktive Modellierung hinaus anwendbar. Durch kostengünstige Sensortechnologien, drahtlose Kommunikation, cloudbasiertes Datenmanagement und automatisierte Vorhersage werden die Überwachung von Wasserressourcen, die schnelle Identifizierung abnormaler Wasserqualitätsbedingungen sowie eine zeitnahe Entscheidungsunterstützung für Umweltbehörden, Wasserwerke, industrielle Überwachung und Präzisionslandwirtschaft ermöglicht. Diese Studie weist mehrere Einschränkungen auf. Das vorgeschlagene IoT-Hardware-Design ist ein Prototyp, und die experimentelle Bewertung basierte ausschließlich auf dem öffentlich verfügbaren Kaggle-Wassertrinkbarkeitsdatensatz. Umweltfaktoren wie langfristige Sensor-Kalibrierung, Kommunikationsstörungen, Sensor-Drift, Biofouling und saisonale Schwankungen wurden nicht getestet. Der Datensatz enthält außerdem keine Umweltparameter wie gelösten Sauerstoff und elektrische Leitfähigkeit, was die rechnergestützte Untersuchung dieser Aspekte einschränkt. Zukünftige Studien werden die vorgeschlagene Architektur durch reale IoT-Einsätze und kontinuierliche Erfassung von Umweltdaten mit integrierten Mehrparameter-Sensoren validieren. Weitere Forschungsarbeiten werden fortschrittliche Deep-Learning-Modelle, adaptive Anomalieerkennungsalgorithmen, erklärbares KI-Systeme (Explainable AI) und föderiertes Lernen einsetzen, um die Generalisierungsfähigkeit der Vorhersagen und die Interpretierbarkeit der Modelle zu verbessern. Smart Cities, die Überwachung industrieller Abwässer, die Präzisionslandwirtschaft und Initiativen zur Umweltverträglichkeit werden von Edge-Computing, Digital-Twin-Technologien und sicheren, verteilten Datenfreigabemechanismen profitieren, um Skalierbarkeit, Zuverlässigkeit und Entscheidungsunterstützung für ein intelligentes Wasserressourcenmanagement zu verbessern.
Abbildung 11 zeigt die umfassende Leistungsbewertung des vorgeschlagenen IoT-fähigen Systems zur Überwachung der Wasserqualität (IoT-WQMS). Die Ergebnisse zeigen, dass der vorgeschlagene Ansatz eine Klassifikationsgenauigkeit von 98,21 % erreichte und damit die in dieser Studie bewerteten maschinellen Lernverfahren als Referenz übertraf. Die Analyse der Receiver-Operating-Characteristic ergab einen ROC-AUC-Wert von 0,991, was auf eine hervorragende Unterscheidungsfähigkeit zwischen trinkbarem und nicht trinkbarem Wasser hindeutet. Die Ergebnisse der Kreuzvalidierung bestätigen zudem die Robustheit und Stabilität des Vorhersagemodells, mit einer mittleren Genauigkeit von 97,94 % ± 0,42 % über zehn Validierungsabschnitte. Die Skalierbarkeitsanalyse zeigt, dass die Ausführungszeit allmählich von 1,8 s auf 7,9 s anstieg, während die Datensatznutzung von 20 % auf 100 % erhöht wurde, wobei gleichzeitig eine Klassifikationsgenauigkeit von über 97,5 % beibehalten wurde. Außerdem betrug die durchschnittliche Inferenzlatenz 0,18 s pro Probe, was die hohe Recheneffizienz des vorgeschlagenen Ansatzes für die nahezu echtzeitfähige Beurteilung der Wasserqualität belegt.
Die Prototyp-Implementierung der vorgeschlagenen IoT-Architektur, die einen ESP32-Mikrocontroller, kostengünstige Sensormodule und cloudbasierte Verarbeitung verwendet, kostet etwa 65 USD (≈ 5.500 INR), deutlich weniger als herkömmliche laborbasierte Systeme zur Wasserqualitätsbewertung. Die kontinuierliche Überwachung und datengestützte Entscheidungsfindung werden mit diesem Design automatisiert. Die Hardwarekosten wurden anhand der kumulativen Marktpreise für handelsübliche Komponenten geschätzt, darunter ein ESP32-Entwicklungsboard (8,50 USD), ein pH-Sensormodul (12,00 USD), ein Trübungssensor (9,50 USD), ein DS18B20-Temperatursensor (3,00 USD), eine 5-V-Stromversorgung (6,00 USD), ein Gehäuse für den Prototypen (8,00 USD), eine Steckplatine und Verbindungsaccessoires (4,00 USD) sowie diverse Montagekomponenten (14,00 USD).
Diese Studie stellt einen Proof-of-Concept-rechnergestützten Rahmen für ein IoT-fähiges System zur Überwachung der Wasserqualität (IoT-WQMS) unter Verwendung des öffentlich verfügbaren Kaggle-Datensatzes zur Trinkwasserqualität vor. Der vorgeschlagene Rahmen integriert eine beispielhafte IoT-Sensarchitektur, cloudbasierte Datenverarbeitung und eine maschinelle Lernmethode zur Vorhersage der Trinkwassertauglichkeit, um die Durchführbarkeit einer intelligenten rechnergestützten Analyse für die Beurteilung der Wasserqualität zu bewerten. Die experimentelle Evaluierung zeigte eine hohe Vorhersagegenauigkeit mit einer Genauigkeit von 98,21 %, einer Präzision von 97,86 %, einem Recall von 98,04 %, einem F1-Score von 97,95 % und einer ROC-AUC von 0,991. Die Robustheit des Modells wurde mittels 10-facher Kreuzvalidierung bestätigt und ergab eine mittlere Genauigkeit von 97,94 % ± 0,42 % sowie eine durchschnittliche Inferenzlatenz von 0,18 s pro Messwert. Die Skalierbarkeitsanalyse zeigte eine stabile rechnerische Leistung, während die Datensatznutzung von 20 % auf 100 % anstieg. Diese Ergebnisse untermauern die Effektivität des vorgeschlagenen rechnergestützten Rahmens für die Vorhersage der Trinkwassertauglichkeit basierend auf einem Benchmark-Datensatz. Die vorgeschlagene IoT-Architektur wird als konzeptioneller Implementierungsrahmen präsentiert und wurde nicht experimentell durch den Einsatz realer Sensoren validiert. Zukünftige Arbeiten werden sich auf die Implementierung und Validierung des Rahmens mittels mehrkanaliger IoT-Hardware unter Feldbedingungen konzentrieren, zusätzliche Parameter der Wasserqualität einbeziehen und fortschrittliche Methoden der künstlichen Intelligenz untersuchen, um die Vorhersagegenauigkeit, adaptive Anomalieerkennung und die praktische Anwendbarkeit für die Überwachung der Wasserqualität in der Realwelt zu verbessern.
Offenlegungen
Interessenkonflikt: Die Autoren geben an, dass kein Interessenkonflikt besteht.
Danksagungen
Finanzierung: Diese Forschung erhielt keine spezifische Förderung von einer öffentlichen, kommerziellen oder gemeinnützigen Einrichtung.
Materialien
| Name | Unternehmen | Katalognummer | Kommentare |
|---|---|---|---|
| Steckbrett und Jumper-Kabel | Generischer Elektronikhändler | MB-102 / Dupont-Kit | Elektrische Verbindung von Hardwaremodulen |
| Cloud-Computing-Plattform | Google Firebase | Speicherung, Visualisierung und Fernzugriff auf Überwachungsdaten | |
| Bibliothek für Datenverschlüsselung | OpenSSL Foundation | AES-256-Bibliothek | Sichere Übertragung von Sensordaten |
| Leitfähigkeitsmesssensor | Messung der elektrischen Leitfähigkeit von Wasser | ||
| ESP32-Entwicklungskarte | Espressif Systems | ESP32-WROOM-32 | Schnittstelle zu Sensoren, lokale Datenverarbeitung und drahtlose Kommunikation |
| Kaggle-Datensatz zur Trinkwasserqualität | Kaggle | Water Potability Dataset | Modellentwicklung, -training und Leistungsbewertung |
| Micro-SD-Kartenmodul | Generischer Elektronikhändler | Catalex Micro-SD-Modul | Temporäre Pufferung und lokale Speicherung von Sensormesswerten |
| pH-Sensormodul | DFRobot | SEN0161-V2 | Messung der Wasserazidität und -alkalität |
| Sensor zur Schadstoffdetektion | Atlas Scientific | EZO-Sensorserie | Schätzung der Schadstoffkonzentration |
| Netzteil | Mean Well | RS-15-5 | Stabile Stromversorgung für das Überwachungssystem |
| Python-Programmierumgebung | Python Software Foundation | Python 3.11 | Datenvorverarbeitung, Modellentwicklung und Leistungsbewertung |
| Temperatursensor | Maxim Integrated | DS18B20 | Wassertemperaturmessung |
| Trübungssensor | DFRobot | SEN0189 | Wassertrübungsmessung |
| Visual Studio Code | Microsoft | Version 1.x | Software-Implementierung und -Debugging |
| Wi-Fi-Kommunikationsmodul | Espressif Systems | Integriertes ESP32-Wi-Fi | Drahtlose Übertragung von Überwachungsdaten |
Referenzen
- He W, et al. Reduction pathways identification of agricultural water pollution in Hubei Province, China. Ecol Indic. 2023;153:110464.
- Thakur RR, et al. Urban expansion and land use transformations in Midnapore City (2003–2024): implications for sustainable development. Earth (Basel). 2025;6(2):50.
- Atojunere EE, Senadeera W, Iji P, Jamaima L. Development of an indirect active solar heating dryer (IASHD) for dwarf Cavendish banana. Indian J Eng. 2026;23(59). https://doi.org/10.54905/disssi.v23i59.e1ije1707.
- Gopan G, Arun M, Vembu S. Comparison of dimple tube with flat plate collector for solar water heater by using carbon nanofluid. Int J Low Carbon Technol. 2025;20:820–833.
- Venkatesh R. Effect of hybrid nanofluid and polyethylene glycol/aluminium foam on thermal characteristics and energy storage performance of solar air heater. Appl Therm Eng. 2026;291:130213.
- Dixit PR, et al. Exploring seasonal changes in coastal water quality: multivariate analysis in Odisha and West Bengal coast of India. Water (Basel). 2024;16(20):2961.
- Al-Mukaram N, Al-Tuwayyij H, Musa SS. Performance assessment of sustainable pavement including glass waste powder. Indian J Eng. 2026;23(59). https://doi.org/10.54905/disssi.v23i59.e5ije1712.
- Rinesh S, et al. Prediction and classification of solar photovoltaic power generation using extreme gradient boosting regression model. Int J Low Carbon Technol. 2024;19:2420–2430.
- Hou H, Su L, Guo D, Xu H. Resource utilization of solid waste for the collaborative reduction of pollution and carbon emissions: case study of fly ash. J Clean Prod. 2023;383:135449.
- Venkatesh R. Effect of boron nitride on mechanical characteristics of LDPE nanocomposite made with ramie fiber. J Inst Eng India Ser D. Published online April 13, 2024. https://doi.org/10.1007/s40033-024-00716-6.
- Wang H, Liu C, Xiong L, Wang F. The spatial spillover effect and impact paths of agricultural industry agglomeration on agricultural non-point source pollution: a case study in Yangtze River Delta, China. J Clean Prod. 2023;401:136600. https://doi.org/10.1016/j.jclepro.2023.136600.
- Arun M, Barik D, Sridhar KP, Dennison MS. Thermal performance of a dimpled tube parabolic trough solar collector (PTSC) with SiO₂ nanofluid. Int J Photoenergy. 2022;2022:8595591. https://doi.org/10.1155/2022/8595591.
- Hassan A, et al. Statistical analysis for water quality data using ANOVA (case study—Lake Burullus influent drains). Ain Shams Eng J. 2024;15(4):102652.
- Zhang X, et al. Identify the key emission sources for mitigating ozone pollution: a case study of urban area in the Yangtze River Delta region, China. Sci Total Environ. 2023;892:164703.
- Kong Y, et al. Adaptability analysis of water pollution and advanced industrial structure in Jiangsu Province, China. Ecol Model. 2023;481:110365.
- Mmonwuba NC, et al. The effect of industrial waste effluent on water quality: a case study of Otamiri River, Owerri, Imo State. J Eng Res Rep. 2023;24(4):15–25.
- Pásková M, et al. Water pollution generated by tourism: review of system dynamics models. Heliyon. 2024;10(1). https://doi.org/10.1016/j.heliyon.2023.e23824.
- Kurniawan TA, et al. Implications of climate change on water quality and sanitation in climate hotspot locations: a case study in Indonesia. Water Supply. 2024;24(2):517–542.
- Zogaj F, et al. Assessment of groundwater quality in some regions of Kosovo based on physico-chemical and microbiological parameters. Limnol Rev. 2026;26(2):16.
- Bytyçi P, et al. Integrated water quality assessment of the Drenica River using macroinvertebrates and Promethee decision method. Biologia (Bratisl). 2026;81(6):146.
- Pati AK, et al. Irrigation water quality prognostication: an innovative ensemble architecture leveraging deep learning and machine learning for enhanced SAR and ESP estimation in the east coast of India. J Environ Chem Eng. 2025;13(3):116433.
- Barad S, et al. Hydrogeochemical and geospatial insights into groundwater contamination: fluoride and nitrate risks in Western Odisha, India. Water (Basel). 2025;17(10):1514.
- Gunaprasad K, et al. A multi-stage learning and fusion framework for water quality assessment using IoT-based sensor data [conference paper]. Presented at: 2025 5th International Conference on Mobile Networks and Wireless Communications (ICMNWC); Tumkur, India; 2025. https://doi.org/10.1109/ICMNWC66779.2025.11354450.
- Su J, Xu W, Lin Z. Algorithm for monitoring water quality parameters in optical systems based on artificial intelligence data mining. Sci Rep. 2024;14(1):28142.
- Sardar T, Mishra S, Pandey S, Khan A. Optical sensing technologies coupled with IoT for water quality assessment: a review. Appl Spectrosc Rev. Published online 2026:1–28. https://doi.org/10.1080/05704928.2026.2650190.
- Kadiwal A. Water potability [dataset]. Kaggle; [cited 2026 Aug 9]. Available from: https://www.kaggle.com/datasets/adityakadiwal/water-potability.