This umbrella reviews non-invasive neuromodulation for anxiety symptoms after stroke. Anxiety was often a secondary outcome in pain, sleep, or depression studies. Very uncertain evidence supports only further investigation. These interventions should not replace standard multidisciplinary stroke care or be adopted routinely for post-stroke anxiety.
Forschungsartikel
Non-Invasive Neuromodulation for Post-Stroke Anxiety Symptoms: An Umbrella Review and Evidence Mapping of Systematic Reviews and Meta-Analyses
* These authors contributed equally
In diesem Artikel
Zusammenfassung
Zusammenfassung
Post-stroke anxiety can impair rehabilitation, participation, and quality of life. This umbrella review mapped systematic reviews on non-invasive neuromodulation for anxiety symptoms after stroke. PubMed, Web of Science, the Cochrane Library, and Embase were searched from inception through June 1, 2026. Published reviews with quantitative anxiety results were eligible, including reviews in which anxiety was secondary to pain, sleep disturbance, or depression. Reporting completeness, methodological quality, and certainty of evidence were assessed using the Preferred Reporting Items for Systematic Reviews and Meta-Analyses (PRISMA) 2020 statement, A MeaSurement Tool to Assess systematic Reviews 2 (AMSTAR 2), and the Grading of Recommendations Assessment, Development and Evaluation (GRADE) approach, respectively. Seven reviews were mapped, comprising six pairwise meta-analyses and one Bayesian network meta-analysis. Selected estimates suggested symptom improvement, whereas others showed no clear difference. All reviews had low or critically low methodological quality. Interpretation was limited by overlapping trials, small outcome-specific sample sizes, heterogeneous interventions, and inconsistencies across source reports. Anxiety-score changes in populations recruited for other post-stroke conditions do not establish a direct effect on clinically defined post-stroke anxiety. Source-level population eligibility and certainty judgments require particular scrutiny when mixed neurological populations contribute to pooled estimates. Non-invasive neuromodulation remains investigational for post-stroke anxiety. Current evidence does not support routine use of a specific protocol or replacement of standard multidisciplinary stroke care. Future trials should prospectively define anxiety, standardize stimulation and sham procedures, and assess sustained benefit and safety.
Einleitung
Post-stroke anxiety (PSA) is a clinically important neuropsychiatric complication that may emerge during the acute phase of stroke or become more apparent during rehabilitation. Its manifestations can include persistent worry, fear, irritability, sleep disturbance, autonomic symptoms, and avoidance behaviors1,2. PSA frequently coexists with post-stroke depression, fatigue, cognitive impairment, sleep disturbance, and other nonmotor symptoms, thereby increasing the burden on patients, caregivers, and healthcare systems3,4. PSA has also been associated with poorer participation in rehabilitation, less favorable functional recovery, reduced quality of life, and unmet long-term care needs5. These consequences highlight the importance of identifying effective and feasible interventions specifically targeting anxiety symptoms after stroke.
Current research has examined the biological mechanisms, clinical correlates, pharmacological treatments, psychological interventions, and rehabilitation strategies relevant to emotional disturbances after stroke6,7,8,9. Cognitive behavioral therapy, reminiscence-based care, problem-solving therapy, social support, exercise-based rehabilitation, and pharmacotherapy may provide benefit for selected patients10,11,12. However, evidence specifically addressing PSA remains limited, and treatment may be complicated by aphasia, cognitive impairment, physical disability, multimorbidity, and polypharmacy. Pharmacological treatment may also be constrained by adverse effects, drug interactions, and limited tolerability in older or medically complex patients. Therefore, safe, repeatable, and nonpharmacological interventions that can be integrated into conventional stroke rehabilitation warrant further investigation.
Non-invasive neuromodulation is used here as the umbrella term. Non-invasive brain stimulation (NIBS) refers specifically to techniques directed at the brain, among which repetitive transcranial magnetic stimulation (rTMS) and transcranial direct current stimulation (tDCS) are the most widely investigated. Peripheral stimulation such as transcutaneous electrical nerve stimulation is not synonymous with NIBS; its presence in mixed-modality source reviews is identified separately. These techniques may modify cortical excitability, functional connectivity, and experience-dependent neuroplasticity13,14. In patients with stroke, non-invasive neuromodulation has been explored for motor impairment, cognitive dysfunction, aphasia, pain, sleep disorders, and affective symptoms. The dorsolateral prefrontal cortex is involved in emotional regulation through its connections with limbic, attentional, and salience-related neural networks; therefore, modulation of prefrontal activity may provide a biologically plausible approach for reducing anxiety and depressive symptoms15,16. Nevertheless, stimulation effects may vary according to modality, target, frequency, intensity, session duration, treatment course, concurrent rehabilitation, and the clinical characteristics of the treated population.
Previous systematic reviews and meta-analyses have suggested that rTMS, tDCS, and other non-invasive brain stimulation strategies may improve depressive symptoms and selected functional outcomes after stroke17,18,19. However, most available reviews have focused primarily on post-stroke depression, central post-stroke pain, sleep disorders, or broadly defined emotional disturbances. Anxiety has often been assessed only as a secondary or ancillary outcome, resulting in a fragmented evidence base for PSA. In addition, substantial clinical and methodological heterogeneity across reviews complicates interpretation of their findings. An umbrella review can synthesize evidence at the review level, identify areas of agreement and inconsistency, and assess whether apparently favorable effects are supported by methodologically robust and sufficiently certain evidence. Therefore, this study aimed to synthesize and map evidence from systematic reviews and meta-analyses evaluating non-invasive neuromodulation for anxiety symptoms in adults after ischemic or hemorrhagic stroke. Secondary objectives were to summarize evidence for depressive symptoms, quality of life, and functional outcomes; assess reporting completeness and methodological quality; evaluate the certainty of outcome-specific evidence; and identify priorities for future clinical research.
Protokoll
Study design and registration
An umbrella review and evidence mapping study was conducted, with published systematic reviews and meta-analyses serving as the unit of analysis. Literature identification, study selection, data extraction, critical appraisal, and evidence synthesis were therefore performed at the review level rather than at the level of individual randomized controlled trials (RCTs). The methodological approach was informed by the JBI Manual for Evidence Synthesis20. The review protocol was registered with the International Platform of Registered Systematic Review and Meta-analysis Protocols under registration number INPLASY202660098 and digital object identifier (DOI) 10.37766/inplasy2026.6.0098. Reporting was guided by the Preferred Reporting Items for Systematic Reviews and Meta-Analyses (PRISMA) 2020 statement and PRISMA-S, an extension to the PRISMA Statement for Reporting Literature Searches in Systematic Reviews21,22.
Eligibility criteria and outcomes
Eligibility criteria were defined before study selection using the population, intervention, comparator, outcome, and study design framework. Published systematic reviews with quantitative synthesis were eligible, including conventional pairwise meta-analyses and frequentist or Bayesian network meta-analyses, provided that RCTs constituted the principal source of evidence.
Eligible populations included adults aged 18 years or older with ischemic or hemorrhagic stroke, regardless of lesion location, stroke stage, or severity of neurological impairment. Reviews of post-stroke depression, central post-stroke pain, post-stroke sleep disorders, or other stroke-related complications were eligible when all participants had experienced a stroke and an extractable pooled estimate for an anxiety outcome was reported. Anxiety could be a primary or secondary outcome of the source review. For mixed neurological populations, eligibility required an extractable stroke-specific anxiety estimate; a review title referring to stroke was not sufficient to establish this.
Eligible interventions included rTMS, tDCS, theta-burst stimulation, transcranial ultrasound stimulation, and other non-invasive brain stimulation approaches. Interventions could be administered alone or in combination with pharmacotherapy, routine rehabilitation, psychological therapy, or other standard treatments. Comparators included sham stimulation, usual care, pharmacotherapy, rehabilitation, psychological therapy, placebo, or another non-invasive neuromodulation intervention.
Anxiety symptoms after stroke were designated as the primary outcome. Eligible reviews were required to report a pooled quantitative estimate for at least one anxiety outcome measured using a validated instrument, together with the number of contributing RCTs and a corresponding measure of uncertainty. Secondary outcomes included depressive symptoms, activities of daily living or functional independence, quality of life, and safety.
Reviews were excluded when stroke-specific data could not be separated from data for other neurological populations; non-invasive neuromodulation effects could not be separately extracted; or no pooled quantitative anxiety estimate was available. Narrative reviews, scoping reviews, rapid reviews, protocols, conference abstracts, commentaries, editorials, case reports, and original clinical trials were excluded.
Duplicate publications reporting the same review were also excluded. Different systematic reviews were not excluded solely because they included overlapping primary randomized controlled trials (RCTs), provided that each review independently met the eligibility criteria. Overlap was considered during synthesis and interpretation. Participant numbers were not summed across reviews, and review-level effect estimates were not subjected to a second-order meta-analysis. An outcome-specific citation matrix was used to document identifiable shared trials (Supplementary Table 1). A complete overall corrected covered area was not calculated because the full contributing-trial list for the anxiety network could not be verified.
Search strategy and study selection
PubMed, Web of Science, the Cochrane Library, and Embase were searched from database inception through June 1, 2026. Reference lists of included reviews, relevant umbrella reviews, and influential systematic reviews were also examined.
The search combined controlled vocabulary and free-text terms related to stroke, anxiety, depression, and non-invasive neuromodulation. Depression-related terms were retained because anxiety outcomes were frequently reported as secondary or supplementary outcomes in reviews primarily addressing post-stroke depression. Search strategies were adapted to the indexing systems and syntax of each database. Complete database-specific strategies and final search dates are provided in Supplementary File 1.
Retrieved records were imported into spreadsheet software for management and deduplication (see Table of Materials). Automated duplicate detection was followed by manual verification using titles, author names, publication years, journal names, and digital object identifiers.
Two reviewers independently screened titles and abstracts according to the predefined eligibility criteria. Potentially relevant reports were retrieved in full and independently assessed by the same reviewers. Disagreements were resolved through discussion, with a third reviewer making the final decision when consensus could not be reached. Full-text exclusions were documented during eligibility assessment; reason-specific exclusion counts were not reconstructed without a verifiable screening log. The selection process was summarized using a PRISMA 2020 flow diagram21.
Data extraction
A standardized data-extraction form was developed before formal extraction. Two reviewers independently extracted data, and disagreements were resolved through discussion or consultation with a third reviewer.
Review-level information included the first author, publication year, country or region, review design, final search date, primary-study designs, number of included RCTs, reported sample size, participant characteristics, interventions and comparators, stimulation targets and parameters, assessed outcomes, risk-of-bias tools, certainty-of-evidence methods, and the original authors’ main conclusions.
For each anxiety-related comparison, the extracted data included the intervention and control conditions, co-interventions, number of contributing RCTs and participants, anxiety instrument, assessment time point, effect measure, pooled estimate, and corresponding 95% confidence interval (CI). For Bayesian network meta-analyses, 95% credible intervals (CrIs) were extracted. Statistical models and reported heterogeneity measures, including I2 values and heterogeneity-test P values, were also recorded.
When a review reported multiple neuromodulation modalities, comparators, anxiety instruments, or assessment time points, all eligible findings were extracted. The main evidence table prioritized the primary anxiety outcome identified by the source review and the estimate obtained at the end of treatment. Additional comparisons were retained in the complete evidence table. Network meta-analysis findings were presented separately from conventional pairwise meta-analysis findings. Source-text, table, and forest-plot discrepancies were documented with the original result, extracted estimate, source interpretation, and handling decision in Supplementary Table 2. Unresolved discrepancies were not corrected by guessing an effect size, direction, or participant count.
Reporting, methodological quality, and certainty assessment
Two reviewers independently assessed reporting completeness using the 27 main items of the PRISMA 2020 checklist21. Each item was scored as fully reported (1), partially reported (0.5), or not reported (0); items with subitems contributed one item-level score. The resulting author-defined total (range, 0–27) was used only to summarize reported information and visualize item-level profiles. Scores were reported without categorical cutoffs and were not used to assess methodological quality, risk of bias, or evidence certainty. The item-level scoring record was retained to allow reproduction of each total.
Methodological quality was independently assessed using A MeaSurement Tool to Assess Systematic Reviews 2 (AMSTAR 2)23. Each of the 16 domains was rated as “yes,” “partial yes,” or “no,” and overall confidence was categorized as high, moderate, low, or critically low according to AMSTAR 2 guidance. Disagreements were resolved through discussion or consultation with a third reviewer.
The certainty of each outcome-comparison evidence body was independently reassessed by two reviewers using the Grading of Recommendations Assessment, Development and Evaluation (GRADE) framework24. Randomized evidence was initially rated as high certainty and was downgraded, when appropriate, for risk of bias, inconsistency, indirectness, imprecision, and publication bias. Risk-of-bias judgments were based on outcome-relevant methodological limitations of the contributing randomized trials reported in the source reviews rather than on review-level AMSTAR 2 ratings. Inconsistency was evaluated according to the direction and magnitude of effect estimates, overlap of confidence or credible intervals, reported heterogeneity, and plausible clinical explanations; no single I2 threshold was used as the sole basis for downgrading. Indirectness was downgraded when anxiety outcomes were derived predominantly from populations recruited for post-stroke depression, central post-stroke pain, or sleep disorders without a prospectively defined diagnosis or threshold for post-stroke anxiety. Mixed stroke and non-stroke populations that could not be separated were treated as an eligibility issue rather than retained solely by downgrading for indirectness. Imprecision was judged according to the amount of outcome-specific information and the width of confidence or credible intervals; a small number of trials alone was not considered sufficient to justify a two-level downgrade. Publication bias was downgraded only when outcome-specific evidence suggested a meaningful concern; absence of an informative assessment was not interpreted as evidence that publication bias was absent. For network meta-analysis evidence, transitivity, within-comparison heterogeneity, agreement between direct and indirect evidence, network sparsity, and precision were considered separately. Inability to assess incoherence because of limited network structure was not interpreted as evidence of consistency. These judgments were made by the present review authors on the basis of data and primary-study assessments reported in the source reviews, rather than by simply adopting the certainty ratings of the original reviews. Disagreements were resolved through discussion or consultation with a third reviewer.
Evidence synthesis and statistical analysis
Review-level findings were synthesized descriptively because of substantial differences in participant populations, stroke-related conditions, neuromodulation modalities, stimulation targets, intervention parameters, co-interventions, comparators, anxiety measures, and primary-study composition.
No second-order meta-analysis was performed because overlapping primary RCTs could lead to double-counting and overstatement of precision, while substantial clinical heterogeneity made a single pooled review-level estimate difficult to interpret. Mean differences, weighted mean differences, standardized mean differences, and network meta-analysis estimates were retained using the source labels, with any conflicting labels documented in Supplementary Table 2. Network and conventional pairwise meta-analysis findings were not statistically combined.
Heterogeneity statistics were extracted as reported without recalculation. No new subgroup analysis, sensitivity analysis, meta-regression, publication-bias test, or heterogeneity test was performed at the umbrella-review level.
Effect direction was checked against group ordering, whether endpoint or change scores were analyzed, forest-plot labels, and the source interpretation. Negative symptom-score differences do not universally favor active treatment because some reviews reported improvement scores or reversed group ordering. Original numerical signs were retained. A positive sign was interpreted as favoring the intervention only where the source plot or analysis convention supported that interpretation. Unresolved effect-unit or interpretation discrepancies were flagged rather than silently harmonized.
PRISMA 2020 reporting scores were presented as individual values and ranges without categorical cutoffs. AMSTAR 2 overall confidence ratings and GRADE certainty judgments were summarized as counts within their respective categories. Item-level PRISMA 2020 reporting profiles were displayed as radar charts using statistical computing software and a plotting package listed in the Table of Materials.
Ergebnisse
Study selection
The database searches identified 1,078 records, and an additional 8 records were identified through supplementary search methods, yielding 1,086 records in total. After removal of 336 duplicates, 750 unique records underwent title and abstract screening, of which 581 were excluded. Full texts were sought for 169 records; 15 reports could not be retrieved, leaving 154 reports for eligibility assessment. Following full-text review, 147 reports were excluded for prespecified reasons. Seven systematic reviews and meta-analyses were ultimately included in the umbrella review and evidence map (Figure 1)18,25,26,27,28,29,30.
Characteristics of the included reviews
The seven reviews included were published between 2022 and 2026. Six conducted conventional pairwise meta-analyses, whereas one used a Bayesian network meta-analysis. Individual reviews included 6–50 randomized controlled trials and reported total sample sizes ranging from 258 to 3,852 participants. Participant numbers were not summed across reviews because the underlying primary trials overlapped to varying degrees. One included review27 reported 13 RCTs involving 430 participants in the abstract; however, the Results section and Table 1 identified 11 included RCTs, with sample sizes totaling 330 participants. Therefore, this umbrella review used the verifiable full-text values of 11 RCTs and 330 participants. The discrepant abstract values were retained only as a source-level audit note in Supplementary Table 2.
The review populations included patients with post-stroke depression, central post-stroke pain, post-stroke sleep disorders, and broader post-stroke emotional disturbances. Anxiety was frequently evaluated as a secondary outcome rather than the primary clinical endpoint. The interventions included repetitive transcranial magnetic stimulation (rTMS), transcranial direct current stimulation (tDCS), transcranial ultrasound stimulation (TUS), and mixed non-invasive neuromodulation strategies. Considerable variation was observed in stimulation targets, treatment parameters, concomitant interventions, comparators, and outcome instruments. Review-level characteristics and pooled estimates are summarized in Tables 1 and 2.
Effects of non-invasive neuromodulation on post-stroke anxiety symptoms
All seven reviews reported pooled quantitative estimates for anxiety outcomes, but the direction and magnitude of the findings were inconsistent. The included Bayesian network meta-analysis29 contained 13 trials reporting anxiety outcomes across the network. In its graphical results, tDCS plus psychotherapy versus sham stimulation was labeled mean difference (MD) −10.20 (95% CrI, −11.90 to −8.58), and TUS plus conventional medical treatment versus conventional medical treatment was labeled MD −5.00 (95% CrI, −5.90 to −4.10). The review’s methods and narrative results instead described these estimates using standardized mean differences (SMDs) and CIs. The graphical labels were retained for traceability; the 13 trials refer to the network as a whole, not to either individual contrast.
Among pairwise meta-analyses, rTMS for post-stroke sleep disorders was associated with lower anxiety scores in two RCTs with 110 participants (MD, −4.05; 95% CI, −4.77 to −3.32; I2 = 39%)30. By contrast, four reviews did not demonstrate a clear benefit in the retained anxiety analyses18,25,26,27. One tDCS review reported a standardized mean difference (SMD) of 1.09 (95% CI, −0.22 to 2.40; I2 = 92%) based on three RCTs18. A review of rTMS for central post-stroke pain reported a weighted mean difference of −0.49 on the Hamilton Anxiety Rating Scale (95% CI, −1.06 to 0.08; I2 = 0%) based on two RCTs25. One review26 contributed a source-reported stroke-specific <1-month subgroup based on two comparisons (MD, −0.63; 95% CI, −1.37 to 0.12; I2 = 45.4%). Findings based on three or fewer trials or comparisons are vulnerable to the influence of individual studies and should not be taken as robust confirmation of benefit or absence of benefit. A separate review28 reported an anxiety subgroup assessed using the Hamilton Anxiety Rating Scale (HAMA) in two RCTs (SMD, 1.64; 95% CI, 0.04 to 3.25; I2 = 86%). The corresponding plot nevertheless carried an odds ratio (OR) label despite presenting a continuous outcome analyzed using SMDs. Its overall symptom aggregate also includes the HAMA subgroup alongside depression scales and repeats some trial participants across scales. Only the anxiety-specific subgroup was retained as an anxiety estimate; the overall aggregate was not treated as an independent depression effect.
Secondary outcomes and safety
Five reviews18,25,26,27,29 reported pooled estimates for depressive symptoms. The overall depression estimates from two pain-focused reviews26,27 were not retained as eligible evidence because stroke-specific results could not be separated from mixed or non-stroke contributors. Three eligible depressive-symptom evidence bodies remained18,25,29. The overall quality-of-life estimate from one review27 was likewise not retained for the same reason. Evidence for daily functioning was limited to two reviews18,29.
Five of the seven mapped reviews contained study-related safety information, although one only tabulated the absence of adverse effects. Reported events included headache, dizziness, scalp redness or itching, tingling, nausea, vomiting, drowsiness, insomnia, and numbness. One review26 reported 126 adverse events, including three serious events, across six of 16 source reports; treatment attribution and a stroke-specific denominator were not established. Two reviews28,29 stated that no serious events were reported, although one28 contained conflicting statements about adverse-event occurrence. Two other reviews25,27 did not provide a structured synthesis of treatment-emergent adverse events in the reviewed full texts. Incomplete reporting and overlapping trials precluded a pooled safety rate (Supplementary Table 3).
Reporting completeness, methodological quality, and certainty of evidence
PRISMA 2020 reporting-completeness scores ranged from 17.5 to 25.0 out of 27 across the seven included reviews. Individual scores and item-reporting profiles are presented in Table 3 and Figure 2, respectively. These descriptive scores do not represent validated ratings of review quality, measure treatment efficacy, or constitute a validated risk-of-bias scale.
The recorded AMSTAR 2 judgments classified two reviews as low confidence and five as critically low. Domain-specific AMSTAR 2 judgments are presented in Table 4. Partial-yes ratings were distinguished from no ratings. Domain judgments and their contribution to overall confidence require explicit justification and should not be replaced by a numerical quality score. A total of 12 eligible outcome-specific evidence bodies were reassessed using GRADE, including seven for anxiety symptoms, three for depressive symptoms, and two for activities of daily living or functional independence. All 12 evidence bodies were rated as having very low certainty. The principal reasons for downgrading were methodological limitations in contributing randomized trials, inconsistency, indirectness, and imprecision. Indirectness was particularly relevant because anxiety was frequently assessed as a secondary outcome in populations primarily defined by post-stroke depression, central post-stroke pain, or post-stroke sleep disorders. Detailed final GRADE judgments are presented in Table 5 and Supplementary Table 4.
Overall findings
Selected estimates suggested anxiety score improvements, but the effects were inconsistent and limited by small samples, indirect populations, overlapping trials, and source-report discrepancies. The evidence does not establish a neuromodulation protocol for routine PSA care. Use for this indication should remain investigational and should not replace standard multidisciplinary treatment.
Data availability
Review-level study characteristics, pooled outcome estimates, reporting-completeness scores, methodological-quality assessments, and certainty judgments are summarized in Tables 1–5. Database-specific search strategies are provided in Supplementary File 1; screening-count reconciliation in Supplementary File 2; primary-trial overlap data in Supplementary Table 1; source-level extraction discrepancies in Supplementary Table 2; safety reporting in Supplementary Table 3; and GRADE operational criteria and detailed outcome-specific assessments in Supplementary Table 4. No individual participant data were collected or analyzed.
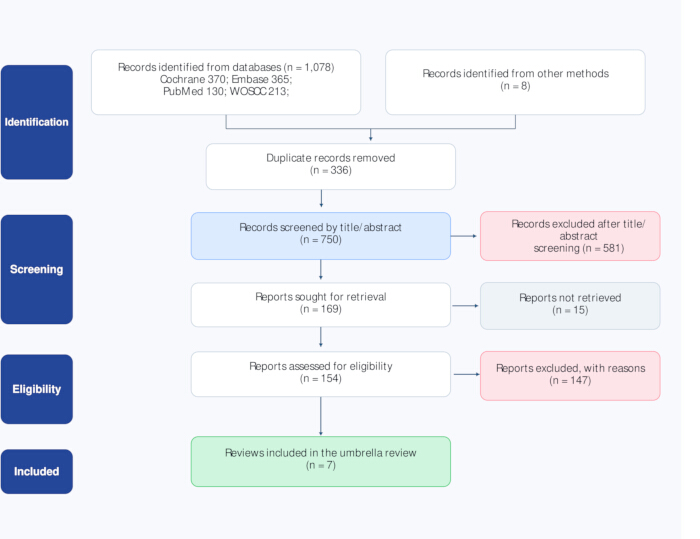
Figure 1: PRISMA 2020 flow diagram of review identification and selection. The diagram summarizes the number of records identified through electronic database searches and supplementary methods, duplicates removed, records screened, reports sought for retrieval, full-text reports assessed for eligibility, reports excluded, and systematic reviews and meta-analyses included in the umbrella review. PRISMA, Preferred Reporting Items for Systematic Reviews and Meta-Analyses. Records refer to bibliographic entries, reports to full-text documents, and included reviews to the units of this umbrella review. Records screened were counted after deduplication; reports assessed excluded those that could not be retrieved, and full-text exclusions were assigned a single primary reason per report. Please click here to view a larger version of this figure.
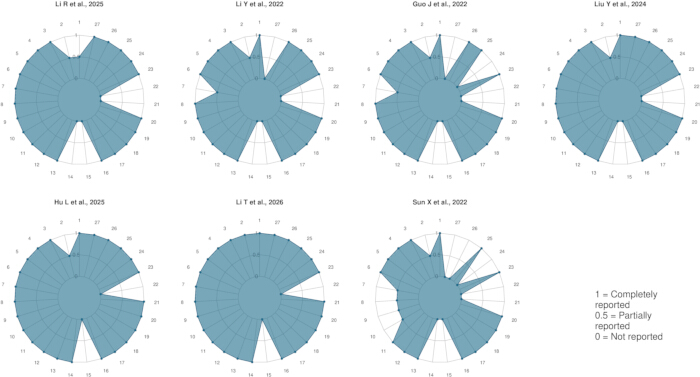
Figure 2: PRISMA 2020 item-reporting profiles of the included systematic reviews and meta-analyses. One radar chart is presented for each included review. The 27 axes represent the individual items in the PRISMA 2020 checklist. Fully reported, partially reported, and unreported items were assigned scores of 1, 0.5, and 0, respectively. Greater radial distance indicates more complete reporting. PRISMA, Preferred Reporting Items for Systematic Reviews and Meta-Analyses. The radius ranges from 0 to 1 for every axis. Each main checklist item contributes once, including items with subitems, and the 27 item scores sum to the descriptive total. These item-level reporting categories are not official PRISMA quality grades, and polygon area is not interpreted as an efficacy or methodological-quality statistic. Please click here to view a larger version of this figure.
Table 1: Characteristics of the systematic reviews and meta-analyses included in the umbrella review. The table presents review design, number of randomized controlled trials and participants, stimulation protocols, comparators, outcomes, and methods used by the source reviews to assess risk of bias. For the review listed with 11 trials and 330 participants, the full-text Results section and source Table 1 report those figures, whereas the abstract reports 13 trials and 430 participants. The discrepancy in the source review remains unresolved. Please click here to download this file.
Table 2: Review-level pooled estimates for anxiety and selected secondary outcomes. Effect estimates and directions are reproduced as reported; no estimates were pooled across reviews. The network estimates follow the source figure labels of mean difference and 95% credible interval, although its methods and narrative describe standardized mean differences and confidence intervals. The source does not resolve this discrepancy. Heterogeneity was not reported for these network contrasts. The 13 anxiety trials refer to the network as a whole, not to each contrast. The positive depression and functioning estimates of 1.61 and 0.82 retain the source direction. The depression estimate of 0.95 conflicts with its source narrative. The anxiety estimate of 1.64 follows the source forest plot, which also carries an odds ratio label despite presenting a continuous outcome. Only the stroke-specific anxiety subgroups with estimates of −0.63 and −0.14 were retained, each based on two comparisons; the mixed-population overall psychosocial pools were excluded. No primary trials were reanalyzed. The mixed anxiety–depression aggregate from the review reporting an anxiety estimate of 1.64 was excluded from the depression-specific synthesis and certainty assessment. Please click here to download this file.
| Reference | Reporting checklist score out of 27 items | Number of critical methodological flaws | Overall methodological confidence rating |
| 29 | 22 | 2 | Critically low |
| 18 | 21 | 2 | Critically low |
| 30 | 20 | 3 | Critically low |
| 25 | 22.5 | 2 | Critically low |
| 26 | 24.5 | 1 | Low |
| 27 | 25 | 1 | Low |
| 28 | 17.5 | 2 | Critically low |
Table 3: Reporting completeness and AMSTAR 2 overall confidence ratings of the included reviews. Reporting completeness was assessed with the 27-item Preferred Reporting Items for Systematic Reviews and Meta-Analyses 2020 checklist: fully reported items received one point, partially reported items half a point, and unreported items zero points. These are descriptive continuous scores; no author-defined categories or validated reporting-quality cutoffs were applied. Overall methodological confidence follows A MeaSurement Tool to Assess systematic Reviews 2 guidance: one critical flaw yields low confidence, and two or more critical flaws yield critically low confidence.
Table 4: Domain-specific AMSTAR 2 ratings of the included systematic reviews and meta-analyses. The 16 items are from A MeaSurement Tool to Assess systematic Reviews 2. Items 2, 4, 7, 9, 11, 13, and 15 are critical domains. Ratings are shown as Yes, Partial yes, or No, in accordance with the instrument. Please click here to download this file.
Table 5: GRADE certainty assessments for anxiety and selected secondary outcomes. The judgments follow Grading of Recommendations Assessment, Development and Evaluation. Randomized evidence started at high certainty. Zero indicates no downgrade in a domain, −1 a downgrade by one certainty level, and −2 a downgrade by two levels; a cumulative downgrade of at least three levels yields very low certainty. Numbers of trials in the network rows refer to the entire outcome network, not to the individual contrast shown. The anxiety-network judgment was made at network level: inconsistency was not downgraded because closed loops were insufficient for a defensible assessment of incoherence; publication bias was downgraded because the source reported funnel-plot outliers. Only the verifiable stroke-specific anxiety subgroups reporting estimates of −0.63 and −0.14 were retained; mixed or non-stroke overall anxiety, depressive-symptom, and quality-of-life pools were excluded. Each retained subgroup comprised two comparisons; no new meta-analysis of primary trials was performed. Please click here to download this file.
Supplementary File 1: Database-specific search strategies. Provides the complete search strategies, final search dates, and retrieval counts for PubMed, Web of Science Core Collection, the Cochrane Library, and Embase.Please click here to download this file.
Supplementary File 2: Screening-count reconciliation. Reconciles the numbers of records identified, duplicates removed, records screened, reports sought and assessed, exclusions, and included reviews. The count of 147 excluded full-text reports is retained from the revised screening record; reason-specific counts were not reconstructed without a verifiable screening log.Please click here to download this file.
Supplementary Table 1: Primary-trial overlap matrix. Maps identifiable anxiety-reporting primary trials across the seven included reviews. It distinguishes verified overlap, possible or probable matches, trials not identified in the reviewed anxiety results, and trial contributions that could not be verified. A trial not identified in the anxiety results may have contributed to other outcomes.Please click here to download this file.
Supplementary Table 2: Source-level extraction discrepancies. Documents the source locations, reported results, extracted estimates, discrepancies, and handling decisions for results requiring source-level verification.Please click here to download this file.
Supplementary Table 3: Safety reporting. Summarizes adverse-event information reported by the included reviews and the limitations concerning treatment attribution and denominators. The available data does not support a pooled safety rate.Please click here to download this file.
Supplementary Table 4: GRADE operational criteria and outcome-specific assessments. Describes the Grading of Recommendations Assessment, Development and Evaluation (GRADE) criteria and the final assessments for 12 eligible outcome-specific evidence bodies. A value of −1 or −2 denotes a one- or two-level downgrade, respectively; 0 denotes no downgrade in that domain. Network trial counts refer to the full outcome network, not to each individual treatment contrast.Please click here to download this file.
Diskussion
This umbrella review and evidence map evaluated systematic review evidence on non-invasive neuromodulation for anxiety symptoms after stroke. Potential reductions in anxiety were reported for selected applications of rTMS, tDCS, transcranial ultrasound stimulation, and mixed non-invasive brain stimulation strategies. However, the findings were not consistent across reviews, and all seven anxiety-related evidence bodies were rated as having very low certainty. In addition, every included review received either a low or critically low AMSTAR 2 confidence rating. Consequently, the available evidence does not establish the effectiveness of any specific stimulation protocol for routine treatment of PSA. At present, non-invasive neuromodulation should be regarded as an investigational adjunctive rehabilitation approach rather than a replacement for established psychological, pharmacological, and multidisciplinary stroke care.
The pattern of potentially favorable effects accompanied by substantial uncertainty is broadly consistent with evidence from post-stroke depression. Previous overviews and meta-analyses have suggested that rTMS and tDCS may improve depressive symptoms after stroke, but their conclusions have been limited by weaknesses in the contributing randomized controlled trials, variability in stimulation parameters, and inconsistent outcome assessment18,19,31,32,33. These findings cannot be directly extrapolated to PSA. Although anxiety and depression frequently coexist and may involve partially overlapping neural networks, anxiety has distinct clinical manifestations, trajectories, and interactions with pain, sleep disturbance, cognitive impairment, and rehabilitation participation34,35,36. In the present review, several positive anxiety findings were derived from populations primarily defined by central post-stroke pain, post-stroke sleep disorders, or post-stroke depression. Improvement in anxiety scores within these populations may reflect indirect effects mediated through reduced pain, improved sleep, or broader emotional recovery rather than a direct therapeutic effect on PSA. This indirectness was a major reason for downgrading the certainty of evidence. Review-level methodological limitations further weaken confidence: incomplete searches, insufficiently justified exclusions, and inadequate consideration of bias may distort the available evidence even when a pooled result is statistically significant.
The principal translational challenge is the marked variability and incomplete reporting of neuromodulation protocols. Future rTMS studies should clearly report the stimulation target and hemisphere, coil type, target-localization method, motor-threshold procedure, stimulation frequency and intensity, number of pulses, train and intertrain parameters, session duration, treatment course, and sham procedure37,38,39. tDCS studies should report electrode material, size and placement, current intensity and density, ramping procedures, duration per session, total treatment course, impedance monitoring, and sham design40. Studies of transcranial ultrasound stimulation should provide transducer characteristics, acoustic exposure parameters, pulse settings, targeting methods, and estimated dose delivered to the intended brain region41. Concurrent rehabilitation, psychological therapy, and pharmacotherapy must also be described because these co-interventions may substantially influence anxiety outcomes. Systematic monitoring of headache, scalp discomfort, dizziness, seizure-related risk, skin reactions, cognitive changes, and other adverse events is required to determine whether short-term symptom changes are accompanied by an acceptable safety profile. Trials should prespecify how events are elicited, graded, attributed, and followed, report events and withdrawals by treatment arm with denominators, and define procedures for seizure-risk screening and serious-event reporting. Absence of reported events should not be equated with established safety.
Future clinical trials should prospectively define PSA as the principal clinical condition and designate anxiety as a primary outcome. Stroke diagnosis should be confirmed by neuroimaging, and the interval between stroke onset and treatment initiation should be specified. New-onset anxiety after stroke should be distinguished from pre-existing anxiety, with the timing, prior diagnosis, and treatment history recorded. Anxiety should be identified using a structured diagnostic assessment or a validated instrument with a prespecified clinical threshold. Because aphasia and cognitive impairment may influence the validity of self-reported anxiety measures, trials should prioritize appropriately validated clinician-administered anxiety assessments when feasible, document communication and cognitive limitations, and specify any adapted or caregiver-supported procedures. Proxy reports should not be treated as interchangeable with validated patient or clinician ratings. Trials should apply adequate randomization, allocation concealment, credible sham stimulation, and blinded outcome assessment. Intervention and control groups should receive comparable routine rehabilitation and background treatment. In addition to anxiety, studies should assess depression, sleep, pain, activities of daily living, functional independence, quality of life, and safety. Follow-up after treatment completion is particularly important because short-term changes in symptom scores may not translate into sustained clinical or functional benefits.
This review has several strengths, including its focus on anxiety outcomes, inclusion of both conventional and network meta-analyses, and simultaneous assessment of reporting completeness, methodological quality, and certainty of evidence using PRISMA 2020, AMSTAR 2, and GRADE. Depression-related search concepts were intentionally retained to identify reviews in which anxiety was reported as a secondary outcome. Review-level estimates were not re-pooled because of overlapping primary trials and substantial clinical heterogeneity, thereby reducing the risk of double-counting evidence and overstating precision. Nevertheless, several limitations should be acknowledged. Seven reviews were included, although several outcome-specific estimates were supported by only a small number of randomized trials. Outcome-level eligibility restrictions were required for the Hu and Li T reviews because their overall psychosocial pools contained non-stroke or mixed-neurological evidence; only source-reported stroke-specific anxiety subgroups were retained from these reviews. Anxiety was often a secondary outcome in clinically indirect populations, and substantial variation existed in stimulation modality, target, dose, comparator, co-intervention, and outcome measure. In some reviews, inconsistencies were observed between effect estimates, forest plots, and textual interpretations. Moreover, safety and long-term outcomes were incompletely reported. Unpublished reviews and conference-only reports were excluded, which may have increased susceptibility to publication and availability bias. The anxiety-trial overlap matrix remains incomplete for the network meta-analysis, so avoiding re-pooling does not eliminate the risk of overstating the independence of repeated findings. Two pain-focused reviews included Galhardoni et al., which recruited participants with either stroke or spinal cord injury. Accordingly, mixed-population overall psychosocial estimates were not retained as eligible evidence; only source-reported anxiety subgroups whose contributing comparisons could be verified as stroke-specific were used in the final synthesis. Future multicenter randomized trials should address efficacy, while prospective registries can complement them with information on implementation, uncommon harms, and durability. Overall, these techniques may represent investigational adjunctive strategies for PSA, but the current evidence is insufficient to support routine clinical use of any specific protocol.
Offenlegungen
The authors declare no competing interests. Generative artificial intelligence (AI) tools were used solely for language editing and polishing of the manuscript. All AI-assisted text was reviewed and approved by the authors, who take full responsibility for the content of the manuscript.
AUTHOR CONTRIBUTIONS:
Tiantian Li and Lijuan He contributed to conceptualization, methodology, literature screening, data extraction, formal analysis, visualization, and writing the original draft. Fenghui Li contributed to literature screening, data verification, and reviewing and editing of the manuscript. Jianyun Zhang contributed to conceptualization, methodology, supervision, and review and editing of the manuscript. All authors read and approved of the final manuscript
Danksagungen
The authors sincerely thank Wanqun Gong and Shuangmei Cao of the Geriatric Rehabilitation Department, Hunan Rehabilitation Hospital, for their valuable clinical insights and professional advice related to this study. The authors thank the investigators and participants of the primary studies included in the systematic reviews and meta-analyses synthesized in this umbrella review. This research received no specific grant from any funding agency in the public, commercial, or not-for-profit sectors.
Materialien
| Name | Unternehmen | Katalognummer | Kommentare |
|---|---|---|---|
| AMSTAR 2 checklist | AMSTAR | 2017 version | Used to assess the methodological quality of the included systematic reviews and meta-analyses. |
| Cochrane Library | Cochrane | Online database; RRID: SCR_013000 | Searched from database inception through June 1, 2026. |
| Embase | Elsevier | Online database RRID: SCR_001650 | Searched from database inception through June 1, 2026. |
| fmsb plotting package | Minato Nakazawa; distributed via CRAN | Version 0.7.6 | Used to generate PRISMA 2020 item-reporting radar charts. |
| Microsoft Excel | Microsoft Corporation | Microsoft 365 | Used for record management, duplicate detection, and manual verification |
| PRISMA 2020 checklist | PRISMA Group | 2020 version | Used to assess reporting completeness of the included reviews. |
| PubMed | U.S. National Library of Medicine | Online database RRID: SCR_004846 | Searched from database inception through June 1, 2026. |
| R statistical computing software | R Core Team; R Foundation for Statistical Computing | Version 4.5.3 RRID: SCR_001905 | Used for descriptive summaries and radar-chart generation. |
| Web of Science Core Collection | Clarivate | Online database RRID: SCR_017657 | Searched from database inception through June 1, 2026. |
Referenzen
- Luan X, et al. High levels of plasma fibrinogen and prothrombin time are related to post-stroke emotional impairment. Brain Res. 2020;1748:147017.
- Barki S, et al. Safety and efficacy of fluoxetine in post-stroke anxiety: A pilot prospective randomized open blinded endpoint (PROBE) study. Int J Psychiatry Med. 2025;60(5):495–507.
- Ruthmann F, et al. Prevalence of poststroke anxiety and its associations with global cognitive impairment: An individual participant data analysis. J Affect Disord. 2025;369:1136–1144.
- Ozkan H, et al. Prevalence, trajectory, and factors associated with patient-reported nonmotor outcomes after stroke: A systematic review and meta-analysis. JAMA Netw Open. 2025;8(2):e2457447.
- Tang E, et al. Stroke rehabilitation in adults: Summary of updated NICE guidance. BMJ. 2024;384:q498.
- Lu W, Wen J. Neuroinflammation and post-stroke depression: Focus on the microglia and astrocytes. Aging Dis. 2025;16(1):394–407.
- Zhou J, Fangma Y, Chen Z, Zheng Y. Post-stroke neuropsychiatric complications: Types, pathogenesis, and therapeutic intervention. Aging Dis. 2023;14(6):2127–2152.
- Liu Z, Cai Y, Zhang X, Zhu Z, He J. High serum levels of malondialdehyde and antioxidant enzymes are associated with post-stroke anxiety. Neurol Sci. 2018;39(6):999–1007.
- Cheng C, Fan W, Liu C, Liu Y, Liu X. Reminiscence therapy-based care program relieves post-stroke cognitive impairment, anxiety, and depression in acute ischemic stroke patients: A randomized, controlled study. Ir J Med Sci. 2021;190(1):345–355.
- Ahrens J, et al. Cognitive-behavioral therapy for managing depressive and anxiety symptoms after stroke: A systematic review and meta-analysis. Top Stroke Rehabil. 2023;30(4):368–383.
- Le HT, Honma K, Annaka H, Sun S, Nomura T. Effectiveness of problem-solving therapy in improving patient mental health, function, quality of life, and mortality post-stroke: A systematic review. Behav Sci (Basel). 2024;14(6):446.
- Balram V, Ingleton R, Parsons D, George S, Van Den Berg M. Non-pharmacological interventions to treat mood disturbances post-stroke: A systematic review. Top Stroke Rehabil. 2025;32(2):188–207.
- Schwippel T, Plewnia C. Non-invasive brain stimulation in psychiatric disorders. Fortschr Neurol Psychiatr. 2022;90(1–2):63–79.
- Duarte-Moreira RJ, et al. Evidence-based umbrella review of non-invasive neuromodulation in chronic neuropathic pain. Eur J Pain. 2025;29(2):e4786.
- Chen R, et al. Advances in non-invasive neuromodulation techniques for improving cognitive function: A review. Brain Sci. 2024;14(4):354.
- Liu Y, et al. Anodal transcranial direct current stimulation (tDCS) over the left dorsolateral prefrontal cortex improves attentional control in chronically stressed adults. Front Neurosci. 2023;17:1182728.
- Shen Y, Cai Z, Liu F, Zhang Z, Ni G. Repetitive transcranial magnetic stimulation and transcranial direct current stimulation as treatment of poststroke depression: A systematic review and meta-analysis. Neurologist. 2022;27(4):177–182.
- Li Y, Li HP, Wu MX, Wang QY, Zeng X. Effects of transcranial direct current stimulation for post-stroke depression: A systematic review and meta-analysis. Clin Neurophysiol. 2022;142:1–10.
- Liang J, et al. Effects of noninvasive brain stimulation combined with antidepressants in patients with poststroke depression: A systematic review and meta-analysis. Front Pharmacol. 2022;13:887115.
- Aromataris E, Lockwood C, Porritt K, Pilla B, Jordan Z, editors. JBI Manual for Evidence Synthesis. JBI; 2024.
- Page MJ, et al. The PRISMA 2020 statement: An updated guideline for reporting systematic reviews. BMJ. 2021;372:n71.
- Rethlefsen ML, et al. PRISMA-S: An extension to the PRISMA Statement for reporting literature searches in systematic reviews. Syst Rev. 2021;10(1):39.
- Shea BJ, et al. AMSTAR 2: A critical appraisal tool for systematic reviews that include randomised or non-randomised studies of healthcare interventions, or both. BMJ. 2017;358:j4008.
- Guyatt G, et al. GRADE guidelines: 1. Introduction—GRADE evidence profiles and summary of findings tables. J Clin Epidemiol. 2011;64(4):383–394.
- Liu Y, et al. Repetitive transcranial magnetic stimulation in central post-stroke pain: A meta-analysis and systematic review of randomized controlled trials. Front Neurosci. 2024;18:1367649.
- Hu L, et al. Non-invasive brain stimulation improves pain in patients with central post-stroke pain: A systematic review and meta-analysis. Top Stroke Rehabil. 2025;32(1):92–107.
- Li T, Zhang X, Yu X, Zhong M, Gao C. Effectiveness of noninvasive brain stimulation for patients with central poststroke pain: A systematic review and meta-analysis of randomized controlled trials. Am J Phys Med Rehabil. 2026;105(6):533–539.
- Sun X, et al. A meta-analysis of the effect of transcranial direct current stimulation on post-stroke depression. J Int Psychiatry. 2022;49(3):411–415.
- Li R, et al. Advancing network meta-analysis in non-invasive brain stimulation: Optimizing post-stroke mood through combined therapies. J Neurosci Methods. 2025;419:110460.
- Guo J, et al. Repetitive transcranial magnetic stimulation (rTMS) for post-stroke sleep disorders: A systematic review of randomized controlled trials. Neurol Sci. 2022;43(12):6783–6794.
- Liu S, Huang Z, Tan J, Zhao N. Effects of noninvasive brain stimulation in the treatment of poststroke depression: An overview of systematic reviews. Front Neurol. 2026;17:1723901.
- Gao W, et al. Repetitive transcranial magnetic stimulation for post-stroke depression: An overview of systematic reviews. Front Neurol. 2023;14:930558.
- Pan J, et al. Effects of low-frequency rTMS combined with antidepressants on depression in patients with post-stroke depression: A systematic review and meta-analysis. Front Neurol. 2023;14:1168333.
- Wright F, Wu S, Chun HY, Mead G. Factors associated with poststroke anxiety: A systematic review and meta-analysis. Biomed Res Int. 2017;2017:2124743.
- Hackett ML, Köhler S, O'Brien JT, Mead GE. Neuropsychiatric outcomes of stroke. Lancet Neurol. 2014;13(5):525–534.
- Terrill AL, Moreno-Gomez V, Kumar M, MacKenzie JJ. Poststroke depression and anxiety: A comprehensive topical review. Stroke. 2026;57(5):1406–1417.
- Edwards JD, et al. A translational roadmap for transcranial magnetic and direct current stimulation in stroke rehabilitation: Consensus-based core recommendations from the third Stroke Recovery and Rehabilitation Roundtable. Neurorehabil Neural Repair. 2024;38(1):19–29.
- Rossi S, et al. Safety and recommendations for TMS use in healthy subjects and patient populations, with updates on training, ethical and regulatory issues: Expert Guidelines. Clin Neurophysiol. 2021;132(1):269–306.
- Trapp NT, et al. Consensus review and considerations on TMS to treat depression: A comprehensive update endorsed by the National Network of Depression Centers, the Clinical TMS Society, and the International Federation of Clinical Neurophysiology. Clin Neurophysiol. 2025;170:206–233.
- Sreeraj VS, Arumugham SS, Venkatasubramanian G. Clinical practice guidelines for the use of transcranial direct current stimulation in psychiatry. Indian J Psychiatry. 2023;65(2):289–296.
- Martin E, et al. ITRUSST consensus on standardised reporting for transcranial ultrasound stimulation. Brain Stimul. 2024;17(3):607–615.