Dieser Artikel schlägt einen physikalischen Berechnungsrahmen vor, der ein gemeinsames zeitliches zufälliges Graphmodell mit einem verbesserten Motter-Lai-Algorithmus kombiniert, um die strukturelle Entwicklung zu bewerten und die Resilienzschwelle von digitalen Ökonomie-Ökosystemen unter kaskadierenden Ausfällen zu quantifizieren.
Forschungsartikel
Strukturelle Evolution und Resilienz von Ökosystemen der digitalen Wirtschaft: Ein kombinierter Ansatz aus einem Temporal Exponential Random Graph Model und dem Motter-Lai-Framework
In diesem Artikel
Zusammenfassung
Zusammenfassung
Bestehende Methoden der statischen Analyse vernachlässigen die strukturelle Entwicklung komplexer Netzwerktopologien und die durch lokale Lastumverteilung ausgelösten kaskadierenden Ausfälle, was zu Bewertungsverzerrungen bei der Analyse der Widerstandsfähigkeit digitaler Ökosysteme führt. Um die Resilienzschwelle des Systems genau quantifizieren zu können, schlägt diese Arbeit einen physikalischen Berechnungsrahmen vor, der ein kombiniertes zeitliches exponentielles Zufallsgraph-Modell (TERGM) mit einem verbesserten Motter-Lai-Algorithmus (TERGM-ML) verbindet. Dieser Rahmen nutzt die Markov-Chain-Monte-Carlo-Maximum-Likelihood-Schätzung (MCMC-MLE), um endogene strukturelle Effekte zu modellieren und die zeitliche Entwicklungsverlauf der realen Netzwerktopologie zu rekonstruieren, wodurch die Einschränkungen statischer Referenzmodelle überwunden werden. Anschließend wird basierend auf der Zentralität der Knoten und deren nichtlinearer physikalischer Kapazität eine Regel zur Verkehrsverteilung ausgelöst, die von der verbleibenden Kapazität benachbarter Knoten abhängt, sobald ein gezielter Angriff erfolgt, und verfolgt damit den gesamten Prozess der Systemauflösung, der durch die Ausbreitung lokaler Überlast verursacht wird. Multimodell-vergleichende Simulationen zeigen, dass nach Einführung eines dualen Mechanismus aus zeitlicher Entwicklung und dynamischer Neuzuteilung die kritische Schwelle für das Entfernen von Knoten, die zum Zusammenbruch der globalen Übertragungseffizienz im Szenario eines gezielten Angriffs führt, bei 12,41 % ± 0,63 % liegt. Dieser Wert ist signifikant höher als der statische skalenfreie Referenzwert (7,85 % ± 0,42 %, p < 0,001).
Einleitung
Durch die tiefe Integration der globalen Informationstechnologie hat sich das Ökosystem der digitalen Wirtschaft schrittweise zu einem komplexen Netzwerksystem entwickelt, das grenzüberschreitend, verzahnt und hochgradig voneinander abhängig ist1,2. Die Erforschung der strukturellen Entwicklung und der Resilienzgrenzen dieses Systems ist von großer strategischer Bedeutung, um den stabilen Betrieb der Volkswirtschaft und die Sicherheit der digitalen Industrie zu gewährleisten. Vor dem Hintergrund der Neugestaltung der globalen Wirtschaftslandschaft und häufig auftretender asymmetrischer externer Schocks ist jedoch die netzwerktopologische Verwundbarkeit, die das Ökosystem der digitalen Wirtschaft aufweist, zunehmend in den Vordergrund gerückt3,4. Bestehende makroökonomische ökonometrische und statische statistische Analysemethoden betrachten die inneren Beziehungen des Systems oft als lineare Kombinationen von Variablen und können daher die dynamischen Phasenübergangsgesetze im Hinblick auf extreme Risiken aus mikrotopologischer Kaskadenperspektive nicht aufdecken5,6,7.
Um diese Einschränkungen zu überwinden, wurde ein physikalisches Computermodell mit einem kombinierten zeitlichen exponentiellen Zufallsgraphmodell (TERGM)8,9 und einem verbesserten Motter-Lai-Algorithmus entwickelt, um die technischen Probleme im Zusammenhang mit zeitlicher Diskretheit, Annahmen zur Lastverteilung und der Entkopplung von Architekturen in bestehenden Forschungsarbeiten10 zu lösen. Es schließt die mathematischen Lücken zwischen Interaktionen auf mikroskopischer Ebene und dem Ausfall eines gesamten Systems auf makroskopischer Ebene, indem es die Resilienzgrenze des digitalen Ökosystems unter gezielten asymmetrischen Angriffen misst. Der in dieser Studie konstruierte integrierte Computeransatz verbessert nicht nur den mathematischen Schlussmechanismus zur Resilienz der komplexen Netzwerkevolution, sondern bietet auch eine hochgradig reproduzierbare mathematische Grundlage zur Verhinderung globaler Netzwerkstörungskrisen im digitalen Zeitalter.
Protokoll
The protocol consists of four sequential computational stages that transform empirical panel data into a quantified resilience threshold for the digital economy ecosystem.
Temporal topology evolution via TERGM
The first stage executes topology evolution using the Temporal Exponential Random Graph Model with Markov Chain Monte Carlo Maximum Likelihood Estimation. The empirical longitudinal panel dataset ICT-DE500, which represents digital economy entities over the 2018–2023 observation period, is imported into the system environment, and entity index numbers are aligned across different time steps to construct a vertically directed graph sequence. The parameter update step size is fixed at 0.01, and the initial 10,000 MCMC iterations are discarded as the burn-in period to achieve stationary distribution. The ICT-DE500 dataset is constructed from Crunchbase global corporate investment and merger records spanning 2018 to 2023, with entities filtered to include only those operating in the Information and Communication Technology and Digital Economy sectors. In this constructed network, nodes represent individual digital economy entities (i.e., enterprises and investment institutions), and directed edges represent the unweighted binary capital flows via investment or merger and acquisition (M&A) events. These financial interactions serve as logical pathways for modeled load propagation, as equity dependencies and capital flows create direct risk transmission channels; financial distress in one node forces liquidity redistribution and asset devaluation that directly propagate to its topologically connected partners. The 500 core entities are selected based on the highest network centrality ranking and most active interaction records during the observation period. Annual edge slices are extracted for each of the six years. To ensure strict temporal alignment of entity index numbers and unify matrix dimensions (N = 500) for the TERGM estimation, isolated nodes with degree zero in any given year's slice were retained as temporarily inactive entities rather than being structurally removed. TERGM convergence is assessed by monitoring the MCMC-MLE parameter trajectories for all endogenous structural coefficients, including edge density, reciprocity, and geometrically weighted edgewise shared partnership. The chain is declared converged when all parameter trajectories exhibit stable oscillation around their respective mean values without directional drift after the 10,000-step burn-in threshold. After parameter convergence, the system performs 10,000 sequential Gibbs sampling iterations to model endogenous effects such as star hub tendencies, generating continuous time-aligned topologies that represent the network's macroscopic structural evolution.
To formally define the generation process, the mathematical specification of the TERGM models the conditional probability of observing the target network topology Gt at macro-time step t, given the preceding network Gt-1, as

Here, θ is the core parameter vector controlling the structural evolution, h(Gt, Gt-1) is the network's sufficient statistics vector quantifying the endogenous structural terms described previously (i.e., edge density, reciprocity, and geometrically weighted edgewise shared partnership), and c(θ, Gt-1) is the partition function ensuring probability normalization. For the subsequent nonlinear cascading-failure simulations, a final stable network realization from the generated prior sequence G1:T is extracted to serve as the initial topological substrate. Crucially, because macroeconomic structural evolution operates on a vastly longer timescale (macro-time steps, t) than instantaneous local cascading failures, the network topology does not continue to evolve via TERGM mechanisms during the cascade simulation. Instead, topological changes during the rapid micro-cascade time steps (τ) are exclusively driven by the deliberate node removals and subsequent overload-induced secondary failures.
Physical capacity calibration and load initialization
The second stage performs physical capacity calibration for all nodes in the outputted network topology matrix sequence. The total degree and directed betweenness centrality for every node are extracted, with a small constant of 10-8 introduced in betweenness centrality calculations to avoid division by zero caused by local network discreteness. The initial service load Li(0) is mapped to all network nodes using a nonlinear power-law equation

where ki is the normalized total degree, Bi is the normalized directed betweenness centrality, λ is the equilibrium weight factor (fixed at 0.5 to ensure equal weighting), and β is the load allocation index constrained within the range of 1.0 to 1.5. The physical carrying capacity limit Ci for each node is established by applying a system-level capacity tolerance hyperparameter α (ranging from 0.1 to 0.5) to build the physical redundancy boundary against shocks

The lower bound α = 0.1 represents a minimal redundancy scenario where nodes possess only 10% spare capacity above their baseline load, while the upper bound α = 0.5 corresponds to a high-redundancy configuration with 50% spare capacity. Intermediate values α = 0.2, 0.3, and 0.4 are also employed in the bivariate sensitivity analysis to construct the full orthogonal parameter space with the load heterogeneity exponent β. The load allocation index β is constrained within the range of 1.0 to 1.5, where β = 1.0 produces a linear load distribution and β = 1.5 generates a highly polarized load concentration toward high-centrality nodes. The equilibrium weight factor λ is fixed at 0.5 to ensure equal contribution from degree and betweenness centrality in the initial load calculation. The core parameter settings for the time-series evolution and cascading failure simulations are summarized in Table 1.
Nonlinear cascading dynamics under deliberate attacks
The third stage implements nonlinear cascading dynamics under deliberate attack conditions. The simulation initiates a deliberate attack by locking and forcibly removing the core node set in descending order of betweenness centrality, thereby disrupting the initial topology protection of the digital ecosystem to test dynamic stress at micro-cascade time steps. The load reallocation engine is triggered to reroute overflow flow constrained by the real-time remaining physical capacity of neighboring nodes, with a sink term of 10-8 introduced to simulate digital asset overflow when commercial pathways are completely blocked. A node is declared failed when its transient load exceeds its physical capacity, and this overload verification executes in parallel across all active nodes to update the binary survival state function. The deliberate attack targets nodes in strictly descending order of betweenness centrality, with each attack step removing exactly one node from the surviving active set. The load redistribution weight  assigned from a failed node i ∈ Fτ to a surviving neighbor j ∈ Aτ at micro-time step τ is computed as

where  represents the remaining physical capacity of neighbor j, Gij is the topological adjacency indicator, Aτ is the active surviving node set, and
  = 10-8 prevents division by zero. Based on these weights, the instantaneous load scale
  of surviving nodes is synchronously transitioned
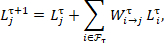
Subsequently, the secondary failure-state update is verified via a binary survival function  :
:
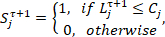
A node is declared failed ( ) when its transient load exceeds its capacity, updating the failure set Fτ+1. The cascade reaches steady state when Fτ+n = ∅, indicating that no additional nodes have failed in the current micro-time step and all surviving nodes operate within their capacity boundaries.
The cascading loop continues until no additional nodes fail, marking the arrival at a secondary steady state where the cascade potential is fully dissipated.
System resilience evaluation and threshold identification
The fourth stage evaluates system resilience by monitoring the macro-disintegration rate of the digital ecosystem graph. The relative scale of the largest connected component derived from surviving nodes is continuously extracted to plot the phase transition decay curve over the fraction of removed nodes. The global transmission efficiency E(τ) is calculated to quantify the connectivity of the surviving topology

where N is the initial total number of nodes (a constant), Aτ is the set of surviving active nodes, and  is the directed shortest geodesic distance from node i to j at the current step. The critical transition threshold is then identified by monitoring the mutation of the first derivative of this efficiency function with respect to the removal ratio. This threshold is determined as the point at which the first derivative attains its minimum value, indicating the steepest decline in transmission efficiency. The critical resilience threshold is calculated by numerically differentiating the global transmission efficiency E(τ) with respect to the node removal ratio f using a second-order central difference scheme. The first derivative trajectory dE/df is smoothed with a moving average window of five consecutive data points to reduce Monte Carlo sampling noise while preserving the location of the steepest descent. The critical threshold fc is selected as the removal ratio at which the smoothed first derivative attains its global minimum value, corresponding to the point of maximum decay rate in transmission efficiency. This selection criterion is applied consistently across all simulation scenarios and baseline models. The reported threshold value of 12.41% ± 0.63% represents the mean and standard deviation computed from 100 independent Monte Carlo simulations with different random seeds, ensuring statistical robustness of the phase transition localization.
Simulation configurations and baseline implementations
To ensure fully reproducible simulations, random seeds were sequentially assigned (integers 1 through 100) prior to each Monte Carlo iteration. The topological evolution and statistical modeling were executed using R with the tergm package, while the nonlinear cascading simulations were implemented in Python using the NetworkX library. Furthermore, for the comparative deep learning baseline, the GCN-Attack model was implemented using PyTorch Geometric. It was constructed with a standard two-layer Graph Convolutional Network architecture (hidden dimension of 64), and trained using the Adam optimizer with a learning rate of 0.01 for 200 epochs to ensure rigorous and consistent experimental control across baseline evaluations.
Ergebnisse
The overall execution logic and data flow of the proposed physical computation framework are illustrated in Figure 1. As the framework executes, the microscopic thermal characteristics of local overflow load redistribution and the nonlinear evolution of node degree distributions are captured (overviewed in Figure 2 and Figure 3, with dynamic details described below. The subsequent sections map the simulation outcomes directly to the protocol stages.
Temporal topology evolution via TERGM
Figure 4 visually deconstructs the spatial topology and community structure of the ICT-DE500 core network, highlighting the distribution of high-betweenness nodes targeted in deliberate attack simulations. The goodness-of-fit test confirms that the generated network topology effectively models the temporal evolution of real ecosystems, successfully avoiding gradient explosion or traps of local optimality after the 10,000-step burn-in period. Figure 5 presents the MCMC-MLE parameter convergence diagnostic trajectories and the geodesic distance goodness-of-fit. Figure 5A shows that the three core parameters representing edge density θ₁, mutuality θ₂, and geometrically weighted edgewise shared partnership θ₃ all terminate their large directional drift after crossing the 10,000-step burn-in threshold, with expected means converging and stabilizing near the horizontal baseline. Figure 5B demonstrates that the empirical observations of shortest geodesic distances fall robustly within the overall distribution boundaries of 1,000 independent network realizations. These realizations were extracted using a thinning interval of 10 from the 10,000 sequential Gibbs sampling iterations to minimize autocorrelation, confirming the reliability of the topology generation base. The specific MCMC-MLE parameter estimates, standard errors, and statistical significance for endogenous structural effects across the observation years are detailed in Table 2.
The temporal evolution of macroscopic topological structure is quantified in Figure 6. The network density steadily increased from 0.015 to 0.035 between 2018 and 2023, while the average clustering coefficient rose from 0.22 to 0.37, highlighting a significant density-cluster divergence phenomenon. The density rises most sharply between 2020 and 2021, fluctuating from 0.021 to 0.029, whereas the clustering coefficient reaches a local peak of approximately 0.31 in 2020 and subsequently drops to approximately 0.29 despite rapid density growth in 2021. This divergence reveals the adaptive evolution mechanism under macroeconomic cycle fluctuations, where risk-avoidance grouping in 2020 drives local clustering, while massive new cross-border connections in 2021 temporarily dilute the close-knit community structure.
Physical capacity calibration and load initialization
The bivariate sensitivity analysis in Figure 7 examines the joint effect of physical capacity redundancy and load polarization on the phase transition trajectory of the largest connected component. Across the nine orthogonal combinations of capacity tolerance α and load heterogeneity β, the array of panels shows that increasing α and decreasing β both delay network collapse. Under the polarized load scenario with β = 1.5 and minimal redundancy α = 0.1 in Figure 7A, the critical collapse threshold is approximately fc = 0.08. Raising α to 0.5 in Figure 7C shifts the inflection point rightward to fc ≈ 0.23. Under the balanced load scenario with β = 1.0 and α = 0.1 in Figure 7G, the threshold remains robust at fc ≈ 0.18, and at the optimal combination α = 0.5 and β = 1.0 in Figure 7I, the threshold extends significantly to fc ≈ 0.38. These results demonstrate that load balancing produces a greater marginal gain in resilience than capacity expansion alone.
Nonlinear cascading dynamics under deliberate attacks
As introduced in the framework overview, the microscopic thermal characteristics of local overflow load redistribution following the initial cascade failure are shown in Figure 2, and the nonlinear evolution of node degree distribution across three typical micro-time steps is presented in Figure 3.
System resilience evaluation and threshold identification
The critical transition threshold for global transmission efficiency is located at 12.41% ± 0.63% node removal during a targeted attack. In the context of the 500-node network, this proportion corresponds to the targeted removal of approximately 62 core hub nodes. This threshold marks the efficiency-collapse point (i.e., the onset of the steepest decline in transmission efficiency) rather than a complete topological disconnection. Figure 8 presents the three-dimensional evolution surface of global efficiency E(τ) over removal ratio and peak network load in Figure 8A, and the two-dimensional cross-section with numerical differentiation in Figure 8B. When the removal ratio f is below 0.10, E(τ) remains above 0.8 and the first derivative oscillates in a shallow region. The minimum of the first derivative trajectory identifies the critical transition threshold, with Figure 8B displaying a single-run cross-section at fc = 12.0% that is highly consistent with the statistical mean from 100 independent Monte Carlo simulations.
Simulation configurations and baseline implementations
The proposed model significantly outperforms the static and deep learning baselines under targeted attack scenarios. However, under random failure conditions, the Static BA-ML baseline exhibits a higher survival threshold (49.12%) compared to the TERGM-ML model (46.28%). It is important to note that the comparison with the Static BA-ML model serves as a distinct topological benchmark rather than a strictly controlled ablation, as the Barabási-Albert generative mechanism fundamentally differs from the ERGM framework. Figure 9 displays the raincloud plot of cascade propagation peak velocities across four model architectures. The Static BA-ML baseline shows a median peak velocity of approximately 49.7 nodes per step, with extreme batches approaching 140. The SNA-Cascading and GCN-Attack models have medians of approximately 35.6 and 23.9, respectively. The TERGM-ML model exhibits the strongest convergence with a median of 13.2 nodes per step, almost eliminating extreme collapses exceeding 40. Table 3 summarizes the critical thresholds and statistical significance for all models. These comparisons clarify that while the TERGM-ML framework demonstrates superior structural resilience to targeted asymmetric shocks, the observed performance differences reflect the joint influence of distinct underlying topologies, temporal evolution, and capacity-aware redistribution, rather than being solely attributable to isolated mechanism ablations.
DATA AVAILABILITY:
The raw data used in this study are derived from the Crunchbase global corporate investment and merger database, publicly accessible via the Kaggle platform at https://www.kaggle.com/datasets/justinas/startup-investments. The processed ICT-DE500 subset, consisting of 500 entities with annual edge matrices for the period 2018–2023 and node attribute data including degree and betweenness centrality, along with the TERGM estimation and convergence diagnostic scripts, the cascading failure simulation code with the improved Motter-Lai algorithm, and the complete dependency specifications, have been deposited in a publicly accessible GitHub repository at https://github.com/moonmoon1189/digital-economy-resilience-complex-networks.
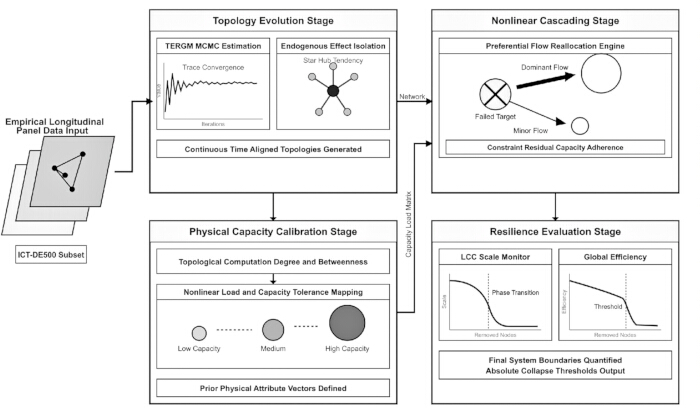
Figure 1: Temporal topology evolution and nonlinear cascade physical computation framework. This figure illustrates the overall execution logic and data flow, including topology evolution, physical capacity calibration, nonlinear cascading, and resilience evaluation stages for identifying the critical transition threshold. Please click here to view a larger version of this figure.
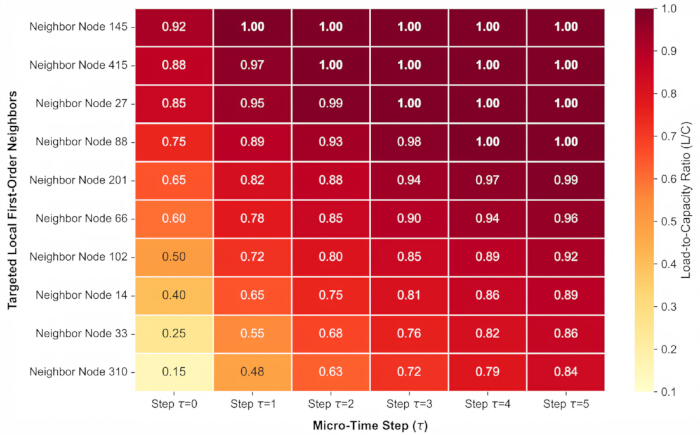
Figure 2: Thermal diagram of the microscopic evolution of nonlinear load redistribution and local cascade overload. The figure illustrates the dynamic thermal characteristics of the local redistribution of overflow load after the initial cascade failure from micro-time step 0 to step 5. Please click here to view a larger version of this figure.
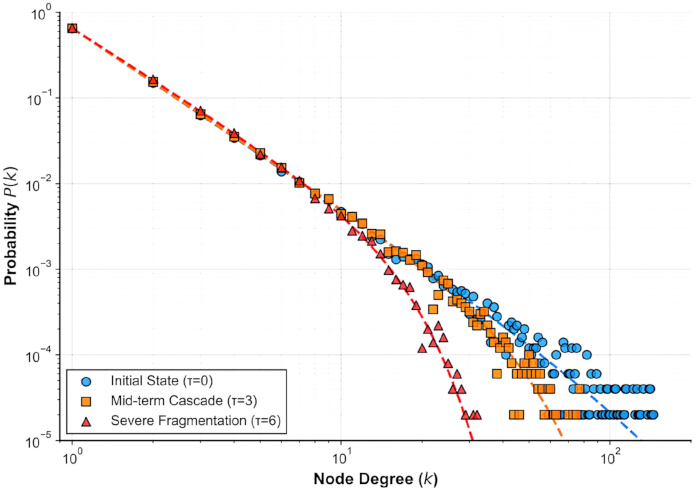
Figure 3: Scatter plot of nonlinear evolution of node degree distribution during cascading failure. The figure presents the evolution trajectory of the node degree distribution of the system at three typical micro-time steps (0, 3, 6). Please click here to view a larger version of this figure.
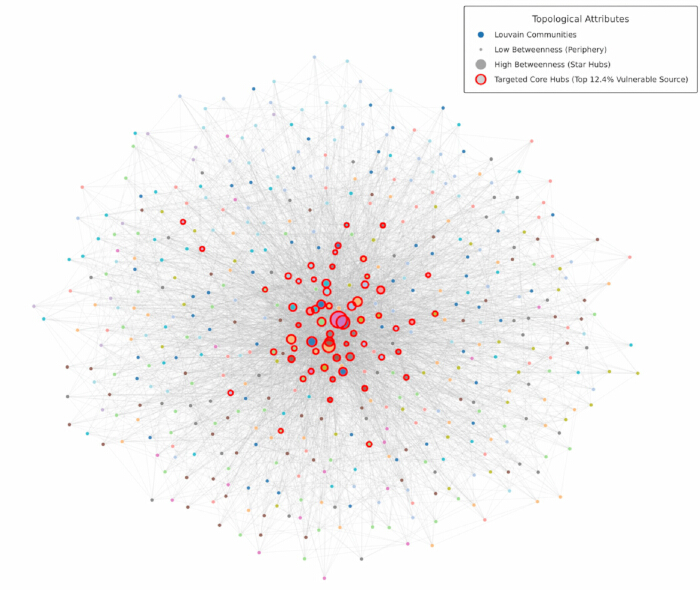
Figure 4: Spatial topology, community structure, and deliberate attack target distribution of the ICT-DE500 core network. The figure visually deconstructs the highly nonlinear macroscopic topology and microscopic node attributes of the core network, highlighting star hubs and vulnerable sources. Please click here to view a larger version of this figure.
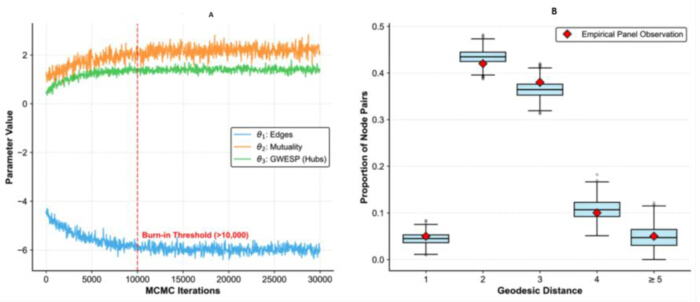
Figure 5: Goodness-of-fit test of Markov Chain Monte Carlo parameter diagnostic trajectory and geodesic distance. (A) This panel shows the diagnostic trajectory of MCMC-MLE parameter estimation across iterations, while panel (B) displays the goodness-of-fit test of the shortest geodesic distance. Please click here to view a larger version of this figure.
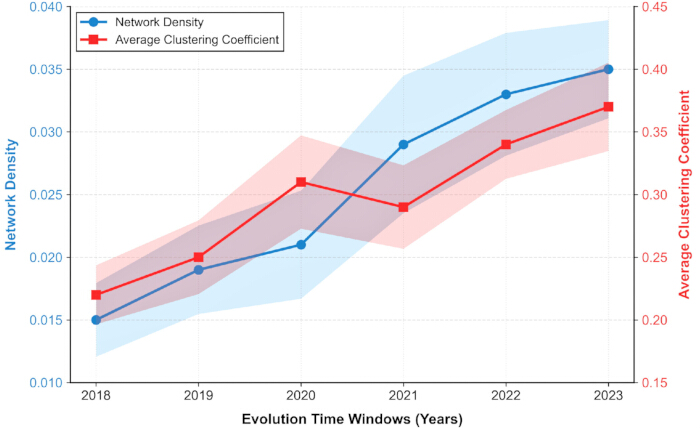
Figure 6: Joint distribution of macro-topological feature parameters in time series evolution. The figure shows the changing trend of macro-topological parameters, specifically network density and average clustering coefficient, for the digital economy ecosystem between 2018 and 2023. The shaded regions around the trend lines represent the 95% confidence intervals derived from 100 independent Monte Carlo simulations. Please click here to view a larger version of this figure.
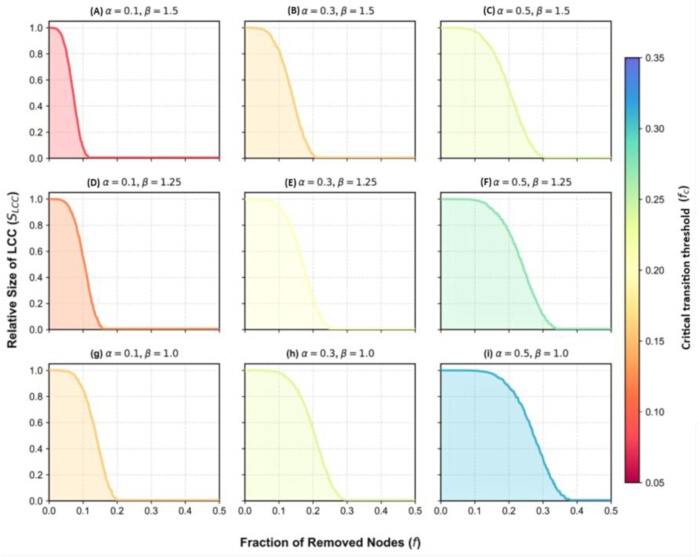
Figure 7: Array plot of phase transition decay for bivariate sensitivity to capacity tolerance and load heterogeneity. (A–I) These panels display the phase transition trajectories across various orthogonal combinations of capacity tolerance and load heterogeneity. Please click here to view a larger version of this figure.
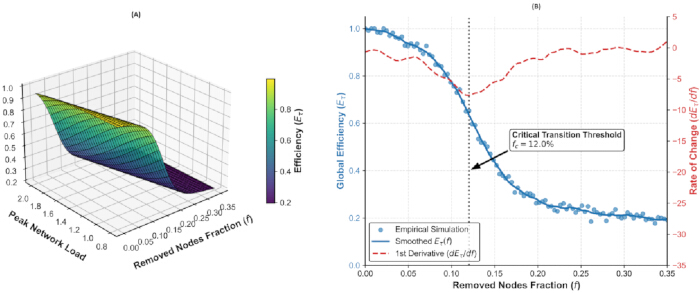
Figure 8: Joint profile of global transmission efficiency in three dimensions and cross-sectional critical transition threshold. Panel (A) constructs the three-dimensional spatial evolution of global transmission efficiency, and panel (B) extracts the two-dimensional cross-sectional critical transition threshold (i.e., the efficiency-collapse point) localization using numerical differentiation. Please click here to view a larger version of this figure.
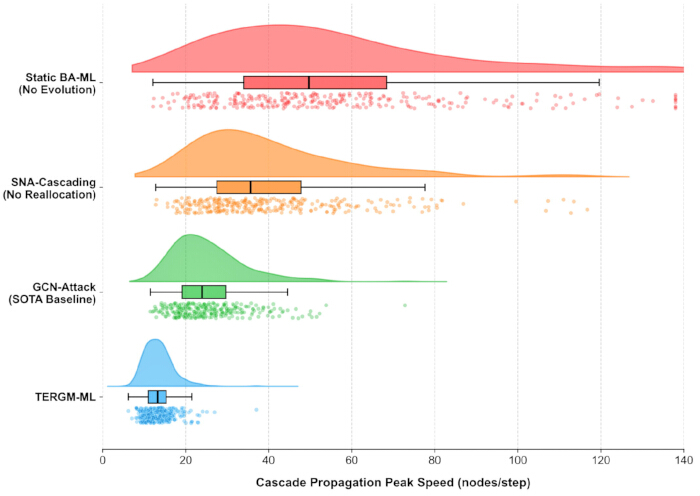
Figure 9: Heterogeneous distribution of cascade propagation peak evolution velocity in raincloud plot. The figure comprehensively displays the heterogeneous probability density distribution of the cascade propagation peak velocities of four models during secondary disaster outbreaks. Please click here to view a larger version of this figure.
| Parameter | Variable & Range | Constraint & Justification |
| Network Scale | N=500 | Fixed size of the extracted ICT-DE500 empirical network subset. |
| Centrality Weight | λ=0.5 | Anchored baseline ensuring equal weighting for degree and betweenness. |
| Load Allocation Index | β∈[1.0,1.5] | Non-linear exponent controlling initial business load heterogeneity. |
| Capacity Tolerance | α∈[1.0,1.5] | System-level redundancy ratio defining the upper bound of physical capacity. |
| MCMC Burn-in Period | >10,000 steps | Mandatory initial iterations discarded to achieve stationary distribution. |
| Gibbs Sampling Iterations | >10,000 steps | Sequential sampling steps to generate time-aligned network topologies. |
Table 1: Core parameter settings for time-series evolution and cascading failure physical simulations. The table defines the core parameters, including network scale, centrality weight, load allocation index, capacity tolerance, and Markov Chain Monte Carlo (MCMC) iterations.
| Observation Year | Edge Density (θ1) Estimate | Edge Density (θ1) Std.Error | Mutuality (θ2) Estimate | Mutuality (θ2) Std.Error | GWESP (θ3) Estimate | GWESP (θ3) Std.Error | Significance |
| 2018 | -6.35 | 0.12 | 1.95 | 0.08 | 1.25 | 0.05 | *** |
| 2019 | -6.15 | 0.11 | 1.98 | 0.09 | 1.35 | 0.06 | *** |
| 2020 | -6.05 | 0.14 | 2.15 | 0.1 | 1.55 | 0.07 | *** |
| 2021 | -5.85 | 0.13 | 1.9 | 0.09 | 1.3 | 0.06 | *** |
| 2022 | -5.75 | 0.12 | 2.05 | 0.08 | 1.42 | 0.05 | *** |
| 2023 | -5.65 | 0.11 | 2.1 | 0.07 | 1.48 | 0.05 | *** |
Table 2: TERGM parameter estimates for endogenous structural effects across observation years (2018–2023). The table reports the Markov Chain Monte Carlo Maximum Likelihood Estimation (MCMC-MLE) parameter estimates, standard errors, and statistical significance for edge density, mutuality, and geometrically weighted edgewise shared partnership across the six annual observation periods. ***p < 0.001. Standard errors are reported next to parameter estimates.
| Model Architecture | Temporal Evolution Mechanism | Dynamic Reallocation Mechanism | Critical Threshold (Targeted Attack) | Critical Threshold (Random Failure) | Statistical Significance (p-value) |
| TERGM-ML | Yes | Yes | 12.41% ± 0.63% | 46.28% ± 1.75% | Reference Baseline |
| Static BA-ML | No | Yes | 7.85% ± 0.42% | 49.12% ± 1.88% | p < 0.001 *** |
| SNA-Cascading | Yes | No | 8.93% ± 0.55% | 37.54% ± 1.42% | p = 0.003 ** |
| GCN-Attack (SOTA Baseline) | Implicit | Implicit | 10.76% ± 0.81% | 43.15% ± 2.05% | p = 0.021 * |
Table 3: Comparison of core mechanism ablation and multimodel architecture resilience boundary. The table details the critical thresholds and statistical test results for system resilience of time-series graphs and improved Motter-Lai (TERGM-ML) and three baseline models under both deliberate attack and random failure scenarios. Values are reported as mean ± standard deviation based on 100 independent Monte Carlo simulations. Targeted attack refers to the sequential removal of nodes based on descending betweenness centrality. Statistical significance evaluates the difference in the Targeted attack threshold between the respective baseline model and the proposed framework using an independent two-sample t-test (*p < 0.05, **p < 0.01, ***p < 0.001).
Diskussion
Der vorgeschlagene kaskadierte physikalische Berechnungsansatz, der gemeinsame Zeitreihengraphen und ein verbessertes Motter-Lai-Modell (TERGM-ML) kombiniert, mildert effektiv die Black-Box-Einschränkungen traditioneller rein datengetriebener Modelle bei der Vorhersage von Resilienz ab. Dieser Ansatz baut auf den grundlegenden exponentiellen Zufallsgraphmodellen von Wasserman und Pattison11 sowie auf dem ursprünglich von Motter und Lai entwickelten kaskadenbasierten Angriffsframework12 auf und erweitert beide Konzepte, um zeitliche Dynamiken und lokale Kapazitätsbeschränkungen zu berücksichtigen. Dieses Paradigma verknüpft eng die reale endogene topologische Entwicklung mit den Tragfähigkeitsgrenzen mikroskopischer Einheiten, indem eine selektive Flusslogik eingeführt wird, die auf lokalen physikalischen Kapazitätsgrenzen basiert. Der zeitliche Evolutionsmechanismus folgt den TERGM-Spezifikationen zur Modellierung dynamischer Netzwerke13,14, und die Strategie zur Kapazitätsverteilung orientiert sich an den Prinzipien des Entwurfs netzwerkbasierter Redundanz zur Minderung kaskadierender Ausfälle15,16.
Ein entscheidender Schritt im Protokoll ist der optimale Umleitungsmechanismus des zugrundeliegenden Geschäftsflusses basierend auf der verfügbaren Kapazität benachbarter Knoten, wodurch die unrealistische Annahme einer „durchschnittlichen Verteilung“ im traditionellen Motter-Lai-Modell ersetzt wird. Die Annahme einer gleichmäßigen Neuzuweisung im Standard-Motter-Lai-Modell wurde in jüngeren Studien zur Infrastrukturresilienz kritisiert, da sie heterogene Knotenkapazitätsbeschränkungen außer Acht lässt6,10. Die vorliegenden Ergebnisse zeigen, dass das zugrundeliegende geschlossene Gemeinschaftsnetzwerk einen definierten physikalischen Dämpfungseffekt auf Überschusslastspitzen besitzt, wodurch die Ausbreitung von Kaskaden effektiv unterdrückt und der Phasenübergang zum Zusammenbruch der globalen Übertragungseffizienz signifikant verzögert wird. Das TERGM-ML-Modell weist den höchsten kritischen Schwellenwert bei gezielten Angriffen auf, der bei 12,41 % ± 0,63 % liegt, was die Dämpfungsfähigkeit der endogenen Netzwerkarchitektur widerspiegelt und das globale Lawinenrisiko infolge eines einzelnen Überlastpunkts verringert. Die Erhöhung des kritischen Schwellenwerts von 7,85 % auf 12,41 % resultiert aus zwei synergistischen Mechanismen. Der zeitliche Entwicklungsmechanismus erzeugt geschlossene Gemeinschaftsstrukturen und wechselseitige Verbindungen, die in statischen skalenfreien Netzwerken fehlen. Diese Gemeinschaften begrenzen die räumliche Ausbreitung von Überlast, indem sie erzwingen, dass die Überschusslast mehrere innerhalb der Gemeinschaft verlaufende Pfade durchläuft, bevor sie entfernte Regionen erreicht, wobei bei jedem Durchlaufschritt ein Teil der transienten Last durch Aufnahme in benachbarte Knoten dissipiert wird. Der dynamische Umverteilungsmechanismus leitet die Überschusslast ausschließlich an Nachbarknoten mit positiver verbleibender Kapazität ΔCj(τ) > 0 weiter und vermeidet so die gleichmäßige Verteilung, die im Standard-Motter-Lai-Modell die lokale Redundanz rasch erschöpft. Die geschlossenen Gemeinschaftsnetzwerke stellen die topologische Struktur bereit, die kapazitätsbasiertes Routing effektiv macht, während das kapazitätsbasierte Routing eine vorzeitige Sättigung der innerhalb der Gemeinschaft liegenden Verbindungen verhindert. Diese Kopplung erklärt, warum das kombinierte Framework im kritischen Schwellenwert um mehr als 4 Prozentpunkte das statische Basismodell übertrifft. Dieser Schwellenwert stimmt mit theoretischen Vorhersagen für skalenfreie Netzwerke unter gezielten Angriffen17 sowie mit Perkolationsphasenübergangsverhalten, das in komplexen Systemen beobachtet wurde, überein18.
Trotz dieser Fortschritte bestehen Einschränkungen der Methode. Aufgrund der bestehenden Beobachtungsgrenzen stützen sich aktuelle Extrapolationen stark auf zentralisierte, vollständige Ausschnitte der globalen Topologie, und ihre diskretisierten Abtastzeitfenster können mikrozeitlich variierende Impedanzstörungen, die durch hochfrequente, plötzliche äußere Umweltschwingungen verursacht werden, nicht genau erfassen. Diese Einschränkungen spiegeln die Herausforderungen wider, die kürzlich in Übersichtsarbeiten zu Resilienzmetriken für cyber-physische Systeme und zur Modellierung von Kaskadenfehlern unter dynamischen Bedingungen identifiziert wurden19,20. Zukünftige Forschung und Anwendungen können sich auf dezentrale Architekturen ausrichten und adaptive dynamische Resilienzkompensationsmechanismen erforschen, die auf einer verteilten Zusammenarbeit mehrerer Agenten unter Bedingungen unvollständiger Informationsspiele basieren. Die einlagige Graphabstraktion und die globale Parameterzuweisung stellen zentrale Einschränkungen des gegenwärtigen Frameworks dar. Untersuchungen zu mehrschichtigen Netzwerken haben gezeigt, dass Abhängigkeiten zwischen Interaktionsschichten die Ausbreitung von Kaskaden verstärken oder abschwächen können, was von einlagigen Modellen nicht erfasst wird. Die globale Zuweisung der Kapazitätstoleranz α und des Lastverteilungsexponenten β abstrahiert von der entitätsspezifischen Heterogenität bezüglich Kapazitätsspielräumen und Lastempfindlichkeiten. Drei Erweiterungen verdienen weitere Untersuchung: Ersetzung der einlagigen Topologie durch eine mehrschichtige Darstellung, die Kapitalflüsse, Technologielizenzierung und Dienstleistungserbringung als separate Schichten mit Querverbindungen zwischen den Schichten unterscheidet; Kalibrierung entitätsspezifischer Kapazitäts- und Lastparameter anhand betrieblicher Firmendaten; sowie der Übergang von zentralisierten Topologieausschnitten zu dezentralen Multiagenten-Architekturen, bei denen Knoten adaptive Umverteilungsentscheidungen auf Grundlage lokal beobachtbarer Signale treffen. Jüngste Studien zu mehrschichtigen Netzwerken haben gezeigt, dass Abhängigkeiten zwischen unterschiedlichen Interaktionsschichten die Ausbreitung von Kaskaden verstärken oder abschwächen können, was von einlagigen Modellen nicht erfasst wird.
Offenlegungen
Die Autoren geben keine Wettbewerbsinteressen an. Bei der Erstellung, Erzeugung oder Bearbeitung grafischer Elemente wurden keine generativen KI-Tools (künstliche Intelligenz) verwendet.
Autorenbeiträge:
F.Y. und Y.Z. entwarfen die Studie und planten sie. F.Y. führte die computergestützten Simulationen durch, analysierte die Daten und verfasste den ursprünglichen Manuskriptentwurf. Y.Z. leitete die Forschung, gab theoretische Anleitung und überarbeitete das Manuskript kritisch hinsichtlich wichtiger geistiger Inhalte. Alle Autoren überprüften und genehmigten den endgültigen Manuskriptentwurf.
Danksagungen
Die Autoren erhielten keine Unterstützung von irgendeiner Organisation für die eingereichte Arbeit.
Materialien
| Name | Unternehmen | Katalognummer | Kommentare |
|---|---|---|---|
| AMD EPYC 7742 CPU | Advanced Micro Devices | 7742 | Leistungsstarker Prozessor zum Durchlaufen von Graphstrukturen und Neuberechnung kürzester Pfade. |
| Crunchbase-Datenbank | Kaggle | startup-investments | Weltweite Unternehmensinvestitions- und M&A-Netzwerkdatensätze, die als globale Netzwerkbasis verwendet werden. |
| CUDA 11.6 | NVIDIA | version 11.6 | Hardware-Beschleunigungsplattform zur Durchführung von Tensoroperationen im GCN-Basismodell. |
| NetworkX 2.8 | NetworkX-Entwickler | version 2.8 | Bibliothek zur Analyse komplexer Netzwerke, verwendet zur Extraktion von Graphparametern und Pfadsuche. |
| NumPy | NumPy-Entwickler | N/A | Mathematischer Kernel-Framework, der deterministische Logik sicherstellt und numerische Drift verhindert. |
| NVIDIA RTX 3090 GPU | NVIDIA | RTX 3090 | Grafikprozessor zur Beschleunigung von Tensorberechnungen im Deep-Learning-Basismodell. |
| Python 3.9 | Python Software Foundation | version 3.9 | Grundlegendes Ausführungsumfeld für den kompilierten und ausgeführten Kernframework. |
| PyTorch 1.12 | Meta AI | version 1.12 | Deep-Learning-Bibliothek zur Berechnung von Berechnungsgraphen und Vorwärtsausbreitung im Basismodell. |
| R | / | version 4.2.2 | / |
| statnet-Paket | Das statnet-Projekt | N/A | Erweitertes statistisches Erweiterungspaket zur mehrstufigen dynamischen Netzwerk-TERGM-MCMC-MLE. |
| tergm-Paket | / | version 4.2.0 | / |
| Ubuntu 22.04.1 LTS | Canonical | 22.04.1 LTS | Server-Betriebssystemkonfiguration, die die mehrfädige Berechnungsmatrix hostet. |
Referenzen
- Rong K. Research agenda for the digital economy. J Digit Econ. 2022;1(1):20–31.
- Fan R, et al. Network dynamics of inter-firm innovation in China’s digital economy: a two-layer network perspective. Technol Anal Strateg Manag. 2025:1–20.
- Feng Y, Huang M. The geographical analysis of global economic uncertainty: resource distribution, geopolitical risks, and systemic vulnerability. Geogr Res Bull. 2025;4:570–573.
- Zhang H, Liu H, Chen R. Multilayer innovation network resilience: a framework for digital economy vulnerability assessment. iScience. 2026;29(1):114295.
- Zang T, et al. Current status and perspective of vulnerability assessment of cyber-physical power systems based on complex network theory. Energies. 2023;16(18):6509.
- He S, et al. Cascading failure in cyber-physical systems: a review on failure modeling and vulnerability analysis. IEEE Trans Cybern. 2024;54(12):7936–7954.
- Dong G, Sun Z, Sun N, Wang F. Understanding percolation phase transition behaviors in complex networks from the macro and meso-micro perspectives. Europhys Lett. 2022;139(6):61001.
- Shi X, Huang X, Liu H. Research on the structural features and influence mechanism of the low-carbon technology cooperation network based on temporal exponential random graph model. Sustainability. 2022;14(19):12341.
- Yao X, Du Y, Pu Y, Wang B. Structural evolution and its determinants of domestic value-added network of digital service exports based on temporal exponential random graph model. Emerg Mark Finance Trade. 2024;60(14):3387–3401.
- Lu Z, Qiu W. Resilience analysis of seaport-dry-port network in container transport: multi-stage load redistribution dynamics following cascade failure. Systems. 2025;13(4):299.
- Wasserman S, Pattison P. Logit models and logistic regressions for social networks: I. An introduction to Markov graphs and p*. Psychometrika. 1996;61(3):401–425.
- Motter AE, Lai YC. Cascade-based attacks on complex networks. Phys Rev E. 2002;66(6):065102.
- Fritz C, Mehrl M, Thurner PW, Kauermann G. Exponential random graph models for dynamic signed networks: an application to international relations. Polit Anal. 2025;33(3):211–230.
- Li Y, Pu Y. Pattern evolution and dynamic formation mechanism of global scrap copper trade network: based on temporal exponential random graph model. Ecol Econ. 2025;236:108664.
- Liu J, Liu X, Liu P. Capacity allocation strategy against cascading failure of complex network. J Syst Eng Electron. 2024;35(6):1507–1515.
- Motter AE. Cascade control and defense in complex networks. Phys Rev Lett. 2004;93(9):098701.
- Albert R, Jeong H, Barabási AL. Error and attack tolerance of complex networks. Nature. 2000;406(6794):378–382.
- Artime O, et al. Robustness and resilience of complex networks. Nat Rev Phys. 2024;6(2):114–131.
- Li ZS, Wu G, Cassandro R, Wang H. A review of resilience metrics and modeling methods for cyber-physical power systems. IEEE Trans Reliab. 2024;73(1):59–66.
- Ma C, et al. A review of supply chain resilience: a network modeling perspective. Appl Sci. 2025;15(1):265.